A blog that tries to make sense of how the UK's national climate translates into local weather for Wanstead and the surrounding regions of east London and west Essex.
Check out my twitter feed @wanstead_meteo for local weather forecasts, stats, records and phenomena for the east London areas of Wanstead, Aldersbrook, Leytonstone and Stratford. And anything else weather
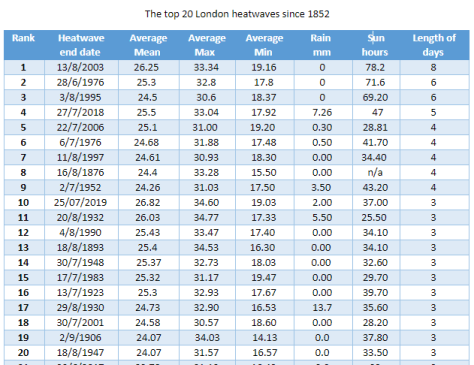
Last month’s heatwave was the hottest three-day event recorded in this area since 1850. It bettered a similar event in 1932 by 0.8C to take 10th in my all-time list of heatwaves.
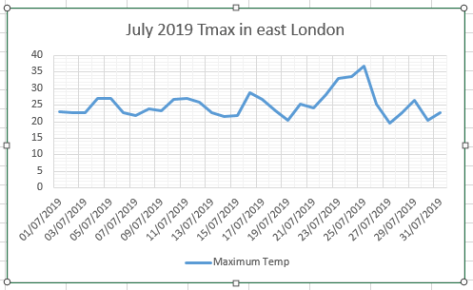
July 2019 saw the month’s daily maximum record broken on the 25th with a high of 36.8C, The reading beat the previous record set on July 1st 2015 by 0.8C and was the second highest reading recorded in this area. Cloud that drifted in mid afternoon put paid to any chance of all-time record though Cambridge, further north, managed to break the UK record with a reading of 38.7C. This temperature set in the Botanic Gardens beat the previous record of 38.5C set in Brogdale, Kent, in 2003.
Brogdale
Cambridge
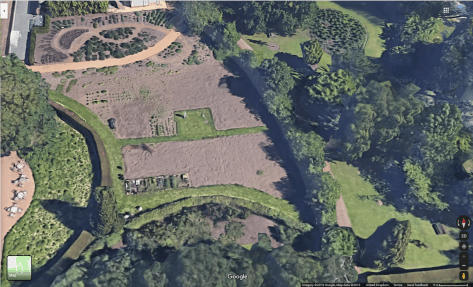
The weather enclosure in the Cambridge Botanic Gardens meets WMO guidelines
Although it has been mentioned that the Cambridge site appears to be overdeveloped it meets the WMO standard and the Met Office are happy with the record.
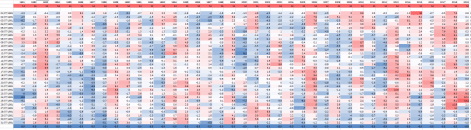
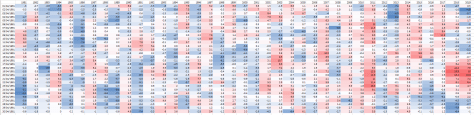
Compared with 2003 the heat this time was far more widespread and further north, with many stations recording higher values than 2003, as shown by these 24 hours to 6pm readings below.
In 2003 some 44 stations recorded 30C or above whereas this year some 67 reached 30C or higher.
Though the heat was record breaking it was much shorter lived than 2003. Like last month and July 2015 the 9-day temperature trace is far more ‘pointed’ – perhaps a symptom of the changing behaviour of the jet stream.
Overall the monthly mean finished 19.9C, that’s 1.4C above average though 1.8C cooler than last July – the warmest month on record.
Rainfall at 61.5mm, was 141 per cent of average, the wettest for 2 years. Sunshine, at 165hrs, is 85 per cent of average and well down on last July’s 273hrs.
Sleeping in heatwaves is never a great prospect even in an age where fans and air conditioning units are becoming more and more common.
In 1948, however, residents of Kensington and other areas of London were so hot and desperate to escape oven-like houses caused by temperatures well into the 90s that they decamped en masse into the streets and local parks to get some kip.
A report published in the Aberdeen Journal on Friday 30th July describes how folk down south were coping with the heat.
“The metropolis last night was like a large restless household—with all the lights ablaze, doors and windows thrown open, the family fretful, and endless pots of tea brewing far into this morning.
“Perhaps one in ten among the 8,000,000 of us slept after midnight. For the rest, we tossed and turned and saw out this heatwave night, when temperatures were never below 71 degrees, a variety of ways. About midnight I walked past the gaunt old Edwardian mansions in Kensington. With the exception the lights that burned from every window, the scene was reminiscent of the early days of the Blitz.
“Families trekked across the roadway in varying stages of undress to their little bits of ornamental gardens. With them went camp beds, bed linen, umbrellas, “in case,” the children, and the household pets, choose a cool open-air camping spot and feel wonderfully adventurous and spartan in the process.”
“At regular intervals the adolescent members of the squatting colonies were dispatched to the tea and coffee stalls on the corner, and perhaps for the first time in years these traders ran out of stocks. On the Kensington-Chelsea boundary, where life becomes noticeably less inhibited and on occasions less swish, a mixed group of young artists was sleeping on the pavement off Fulham Road.
“Round the next corner, where many theatrical and film stars live, several had slung hammocks on their meagre front lawns – one actually suspended between the bathroom windows of two adjacent houses. Midnight street wear for both sexes was cool if unconventional —silk pyjamas, bath robes, tennis shorts, and one in kilt and bathing costume top who could have gone straight into the arena at Lonach.”
The temperature at Westminster that night never fell below 23.3C (73.9 F), a record for July that still stands.
The column goes on to describe the situation in the House of Commons where the heat had reached “almost Turkish bath intensity”.
“Some members were in natty tussore silk suitings, but this helped little, and it was many of their number who appealed to the Speaker to have more windows opened. The Speaker, panting like the rest of us, said they were all open. If they wanted more cool breezes from the Thames, members would have to smash the windows.”
June 2019 saw no high temperature records broken but a jump in anomaly, produced on the 29th by the 3rd hottest June day back to 1959, is higher than any I can find back to that year..
The only phenomena similar that I can find, albeit in the other direction, is the Beast from the East in March 2018 that sent temperatures plummeting.
The month finished a little above average though the final figure, like May and April, masked cool warm spells.
The mean temperature finished 16.9C that’s 0.8C above average, the coolest for 3 years.
Rainfall was 63mm, 123% of average, the wettest for 2 years. Sunshine was 158 hours, 88.7% of average, and dullest for 3 years.
Looking out the window on a cold and miserable June afternoon yesterday reminded me of similar such days during the Seventies and Eighties.
But the mind plays tricks and I wondered if these kind of days were that common in the past.
To weed out the also-rans qualifying days had to be sunless with an anomaly that was at least 4C cooler than the daily average and rainfall of at least 12mm.
This gave the following list.
So, in the last 60 years there have been only 12 days similar to June 10th 2019. That would give a probability of less than 1% (0.00743)
Looking elsewhere it would appear that there was much more rain to the north, south and west of Wanstead.
June can be a strange month weatherwise. Scorching temperatures as well as washout, cold weather, perhaps epitomised by the Queen’s Diamond Jubilee pageant on the river Thames in 2012, can feature prominently.
The month can also throw up some striking anomalies, none more so than the fact that the 13th is the only day in the month where the temperature has never reached or exceeded 30C anywhere in the British Isles.
According to TORRO the highest daily maximum recorded in the UK is 28.3C at Earls Colne, Essex, in 1948; at Brixton, south London, in 1896 and Aboyne in 1994. Yet either side of this date has records comfortably above 31C, as the table below shows.
The closest we’ve got locally to 30C in the last 60 years was in 1989 when 27C was recorded.
So why is the 13th ‘cursed’ with traditionally being the coolest day of the month? The best explaination perhaps is the fact that the date occurs more or less during the middle of the North-west European monsoon.
According to Philip Eden’s list of singularities the June monsoon can strike any time between the 1st and 21st but normally peaks on the 16th with a 77 per cent frequency.
As well as cool temperatures the phenomenon can also bring copious amounts of rain, as happened in 1903 when large parts of Redbridge were inundated following a 59-hour deluge that started on… the 13th.
Will we see a repeat this Thursday? Unlikely, though the general pattern is not that different to what led to events over a hundred years ago.
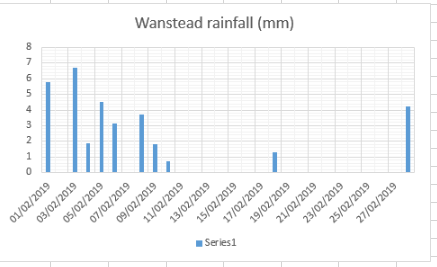
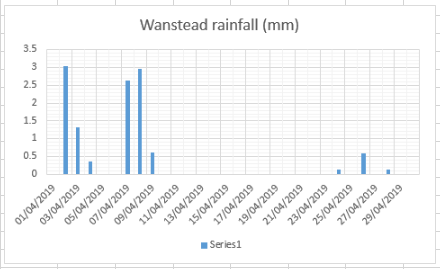
Since February most of this region’s rainfall has been falling during the first half of the month.
February: 86%
March: 134%
April 28%
May (to 26th) 54%
With only one of these months wetter than average the long-term, rolling trend continues to head downwards.
Considering past rainfall patterns it can only be a matter of time before the graph heads upwards again. Looking further back at rainfall data to 1961 reveals the extremes were higher and that the jump from dry to wet can be sudden.
The wettest 12-month rolling period ended mid way through May 1975 with a total of 873mm. However, just 16 months later, at the end of the hot summer of 1976, the rolling 12-month average was just 302mm, that’s less than half of our average annual rainfall!
Zermatt and the surrounding Valais area in Switzerland has a varied Alpine climate. But a study of weather data back to the beginning of 2011 reveals distinct seasonal patterns in terms of air pressure and precipitation.
Although these patterns can’t be relied on completely in terms of planning a wintersport or summer climbing trip awareness of the extremes can be a big help. Knowing when pressure is usually highest can help mountaineers pick that ideal week in summer to tackle 4,000m peaks. Similarly pinpointing weeks with lowest pressure and highest precipitation is the holy grail for those hunting for powder snow.
Looking at the averages pressure is highest on December 23rd. Further scrutiny of rolling weekly averages shows this date coincides with the week commencing December 20th. Anyone who’s been to the Alps at Christmas time will know that this period can be very unreliable for deep snow cover. In terms of summer pressure is highest on August 21st.
Pressure is lowest on February 2nd. Again this date often coincides when the deepest snowfalls often arrive after weeks of dry weather. Despite the unsettled pattern at this time annual precipitation is usually greatest at the end of October / beginning of November. I’ve lost count of the number of times the press interpret these early snowfalls to be a sign of a bumper season ahead only for the skies to clear at the end of November and, sometimes, the arrival of unseasonably warm weather.
The second wettest period is usually the end of April / beginning of May. Again, this past week has seen some parts of the Alps record the best snowfalls this season.


“Perhaps one in ten among the 8,000,000 of us slept after midnight. For the rest, we tossed and turned and saw out this heatwave night, when temperatures were never below 71 degrees, a variety of ways. About midnight I walked past the gaunt old Edwardian mansions in Kensington. With the exception the lights that burned from every window, the scene was reminiscent of the early days of the Blitz.


You must be logged in to post a comment.