
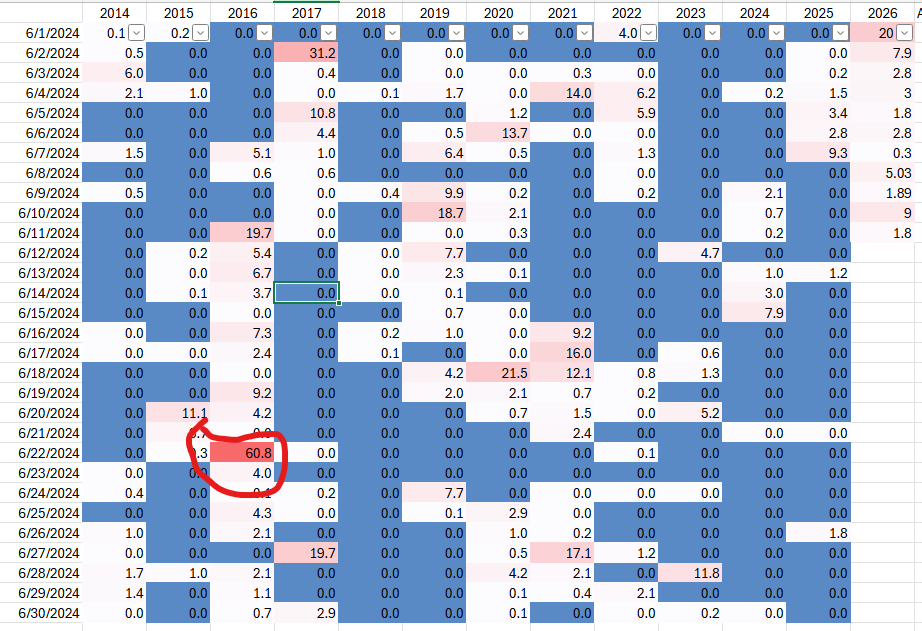
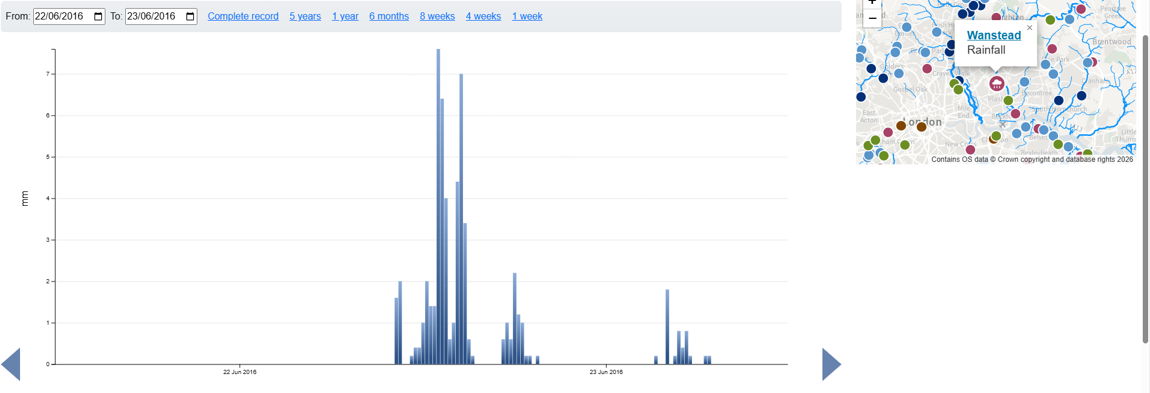
It’s 10 years tonight that this station recorded over 60mm of rain in 24 hours.
It remains the largest daily fall at this station since records began in 1960.
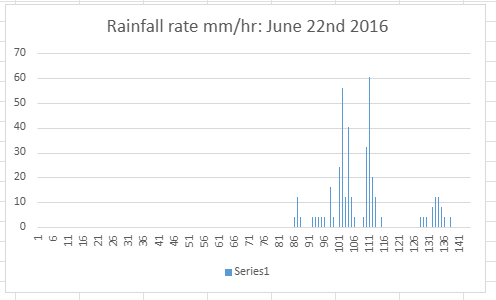
Rainfall rates touched over 60mm/hr during the early hours of June 23rd.
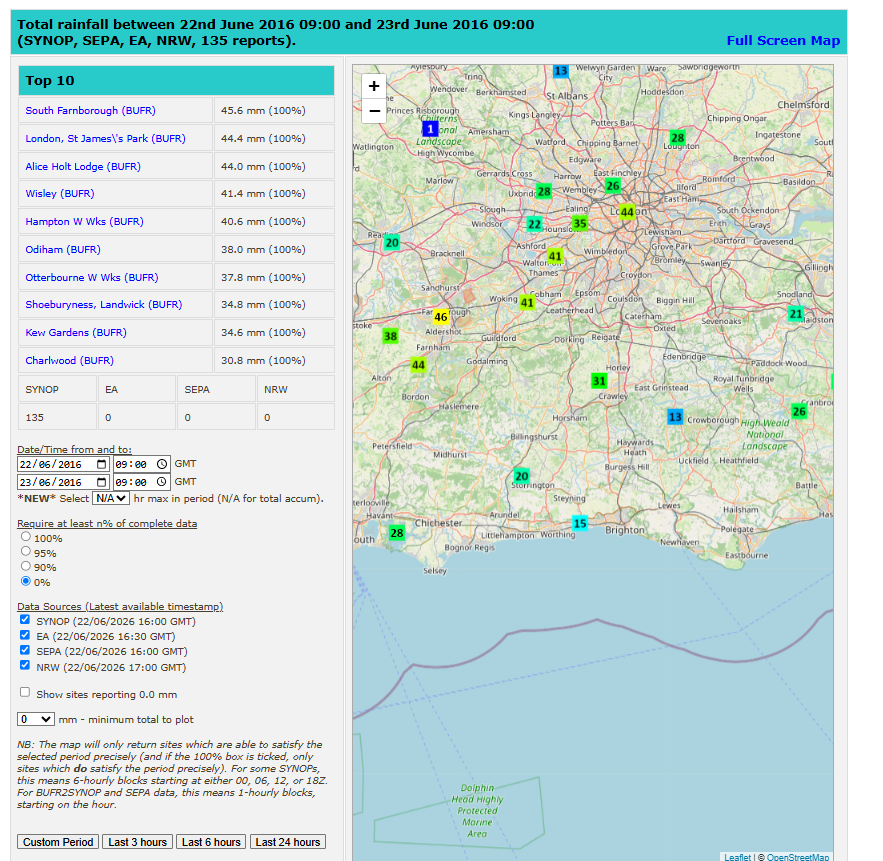
The closest station at the waterworks at Redbridge Roundabout recorded a similar amount.
The next closest official station, St James’s Park, recorded only 46mm, illustrating how varied rainfall can be over a small area.
The rainfall during the event was around three times heavier than the deluge on June 2nd.

It’s been a wet winter so far. Some 177mm has fallen in Wanstead – already 122 per cent more what falls in an average winter.
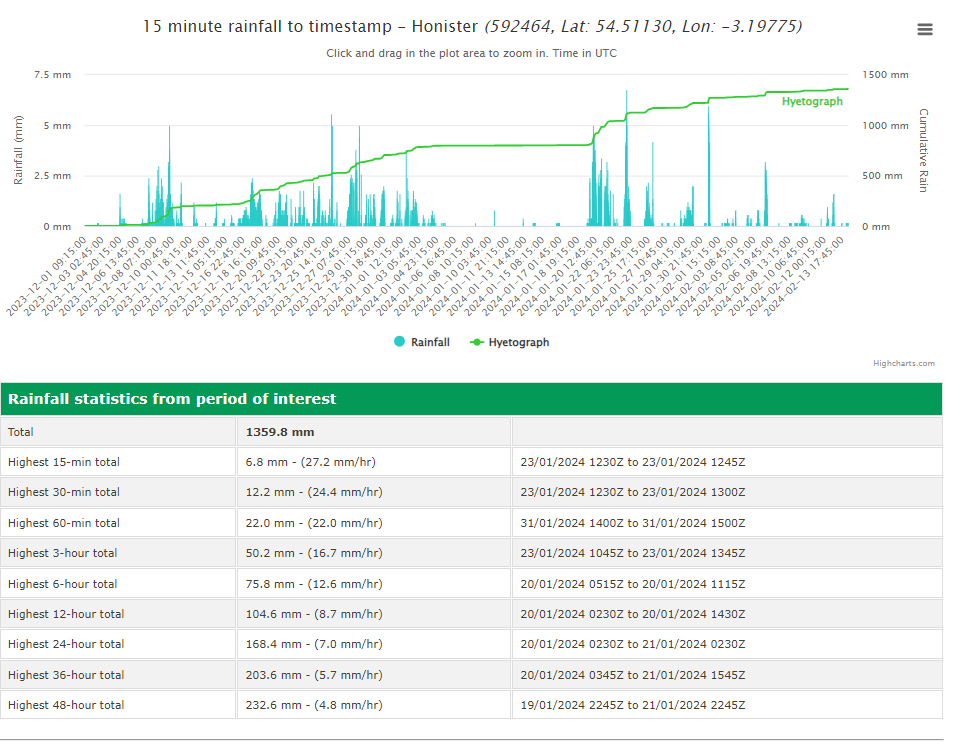
But the amount pales into comparison with the Lake District. Since December 1st 1360mm has fallen at Honister, a station close to Seathwaite which proudly proclaims itself as ‘England’s wettest place’.
Over a calendar year the area usually sees 5.6 times the amount of rainfall of London. However, this winter the total of 1360mm makes it 7.7 times wetter! A testament to just how persistent the SW’ly airstreams have been this season. And a reminder that the Lake District is the called the Lake District for a reason.
Data from the excellent Starlings Roost Weather.

Since February most of this region’s rainfall has been falling during the first half of the month.
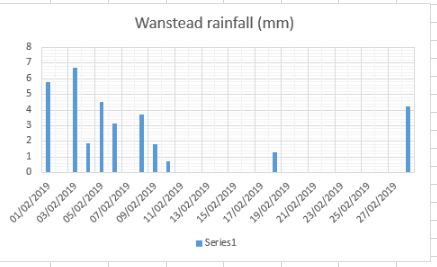
February: 86%

March: 134%

April 28%

May (to 26th) 54%
With only one of these months wetter than average the long-term, rolling trend continues to head downwards.
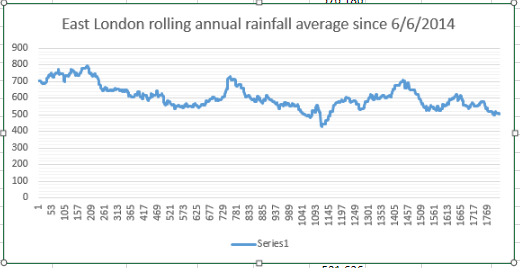
Considering past rainfall patterns it can only be a matter of time before the graph heads upwards again. Looking further back at rainfall data to 1961 reveals the extremes were higher and that the jump from dry to wet can be sudden.
The wettest 12-month rolling period ended mid way through May 1975 with a total of 873mm. However, just 16 months later, at the end of the hot summer of 1976, the rolling 12-month average was just 302mm, that’s less than half of our average annual rainfall!

Meteorology-based musings about east London and beyond


You must be logged in to post a comment.