
Since February most of this region’s rainfall has been falling during the first half of the month.
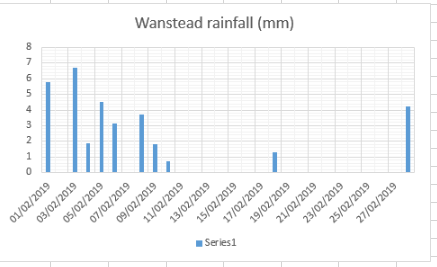
February: 86%

March: 134%
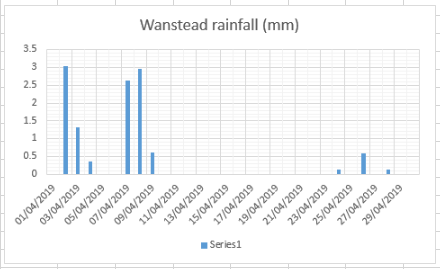
April 28%

May (to 26th) 54%
With only one of these months wetter than average the long-term, rolling trend continues to head downwards.

Considering past rainfall patterns it can only be a matter of time before the graph heads upwards again. Looking further back at rainfall data to 1961 reveals the extremes were higher and that the jump from dry to wet can be sudden.
The wettest 12-month rolling period ended mid way through May 1975 with a total of 873mm. However, just 16 months later, at the end of the hot summer of 1976, the rolling 12-month average was just 302mm, that’s less than half of our average annual rainfall!

