Widespread heavy rain and gales across the UK have made the start of summer feel very unseasonal. But the conditions, which follow an extended period of mostly dry weather, are very typical for early June.
The pattern for June over the past 10 years reveals the month often starts unsettled before drying up in the final week
The ‘NW European monsoon’ is one of the most reliable ‘singularities’ on the annual weather calendar. Though it sounds very unscientific that the atmosphere can remember how it behaved on a certain date in previous years much statistical work over the past 170 years highlight tendencies for unusual weather at particular times of the year. These tendencies were first identified by the German climatologist, A.Schmauss, in 1938.
While the pattern isn’t set in stone statistics show that the probability of the euro monsoon occurring between June 1st and 21st is 77 per cent.
The GFS operational run suggests an unsettled outlook
24hr rainfall totals
Depression across the UK
One of the most notable inclement spells of weather in June happened during the D-Day landings in 1944.
0100 June 5 1944
12 June 6 2017
With the changes in ice at the North and South Poles, together with the massive positive temperature anomalies last winter, it would be thought logical that this would have some bearing on the general pattern this year. But polar ice is only one variable to consider when trying to predict the world’s climate.
November 2016 was the sunniest in a record going back to 1881. Some 91 hours were recorded, 156 per cent above average and a complete contrast to last November which was the dullest for 47 years.
The temperature in the early hours of the 30th fell to -6.1C, colder than any night last winter and the coldest since January 2013
The mean temperature for the month finished 6.4C, that’s 1.5C below the 1981-2010 average ; 4C cooler than last year and the coldest November since 2010. The warmest day occurred on the 15th with 15.9C recorded. The first air frosts of autumn were recorded. The lowest temperature occurred on the 29th when the spirit fell to -6.1C.
Rainfall was 135 per cent of average with 80.1mm recorded. The wettest day was on the 19th when 23.5mm of rain fell.
The sunniest days were on the 2nd, 13th and 25th when eight hours of sunshine were recorded.
Air frosts: 4, Ground frosts: 19
The dolphin-shape of this radar image shows Storm Angus before it hit the south coast. The system stayed far enough south of us not to cause any damage in London
What has December got in store weatherwise? The models suggest the high pressure that has been anchored over us, bringing cold nights, will pull away to the continent. This will allow an ever milder but mostly dry source of air off the Atlantic through to mid month. Days will grow milder while frost and fog will feature less at night.
Beyond the grasp of the models my long range outlook method suggests an coldmonth is most likely at 43 per cent probability. Average comes in at 29 per cent probability while rather mild and rather cold are both 14 per cent probabilities.
Rainfall looks finely balanced. Wetter and dryer than average both come in at 43% probability while average is 14 per cent. Given the influence of high pressure at the beginning of the month I’m inclined to think it will be a drier than average month.
So, to sum up, we’re looking at a mean of 4.4C, rainfall: 55mm, sunshine: 39hrs.
My forecast last month was good: predicted mean 6.8C (result 6.4C). Rainfall: 55mm (result 80mm). Sunshine was way off, however – predicted total: 41hrs (result 91hrs)
I have also published a winter forecast covering the London area that you can find here.
Here follows the full weather diary for November…Full stats for the month here:http://1drv.ms/1rSfT7Y
1st: Cloudy and mild all day. Patchy drizzle at times.
2nd: Sunny, cold start after first ground frost of the autumn.
3rd: Sunny, cold start with cirrostratus and cumulus drifting around. Cloud thickened through the afternoon with some light rain around 9pm.
4th: Cloudy, dull start up to 11am. Rain pushed in and lasted for much of afternoon, clearing in evening.
5th: Cloudy, cold and damp start. Some brightness though with a cold wind.
6th: Sunny, cold start, tending to cloud in. Rain after 3pm. Feeling cold but too windy for a frost overnight.
7th: Sunny, cold and very breezy to start, the cloud tending to fill in through the day. Clearer overnight though too much cloud and occasional air prevented an air frost.
8th: Sunny and cold start. Cloud thickened during the day to bring rain after dark at 8pm that then fell through the night – the biggest fall since Brexit day.
9th: Light rain slowly clearing to cloud.
1oth: Cloudy start with light rain showers around 10.30am then cloudy. Some sunny intervals in the afternoon. Milder.
11th: Bright start with cloud decreasing through the morning to leave a pleasant and clear afternoon.
12th: Miserable and rainy to start, this lasting past 11.15am. Drizzle thereafter into 6pm.
13th: Sunny start though cloud tended to fill in through the day. Damp overnight with patchy drizzle.
14th: Cloudy and damp start with some breeze. Brief brightness at noon but patchy drizzle moved in around 4pm.
15th: Cloudy and miserable though very mild.
16th: Sunny start and very mild though cloud tended to fill in during the day making the sunshine milky.
17th: Bright, breezy start, the breeze increasing until a squall blew through at 2.40pm then sunny spells.
18th: Bright start with milky sunshine then tending to cloud over. Feeling cold.
19th: Bright sunshine though cold to start. Patchy altocumulus developed through the day, leaving it to become bright, the strength of the sun diminishing. Rain started around 6pm and fell through night with varying intensity.
20th: Dull and cloudy start with rain returning at 10am. Cloudy afternoon with rain returning late evening and through the night, some heavier bursts.
21st: Cloudy with showers past noon. Heavier showers moved in mid afternoon and fell into the evening.
22nd: Cloudy with a few very light showers around. Breezy.
23rd: Cloudy and breezy. Feeling mild.
24th: Cloudy and mostly dull with brief brightness at noon.
25th: Sunny with just a few cumulus around.
26th: Sunny start but low cloud blotted out the sun around midday then cloudy and cool.
27th: Cloudy and mild.
28th Sunny all day with just a few cumulus floating around.
29th: Sunny all day with frost persisting on grass in shade.
30th: Sunny and very frosty start. Frost persisting on the grass all day with a very cold start to the night. A veil of cloud crossed the region late evening, lifting the temperature above freezing, before clearing before dawn
Summer 2016 turned out to be a very decent season overall, the mean temperature of 18.7C (1.1C above average) made it the sixth warmest summer since 1797.
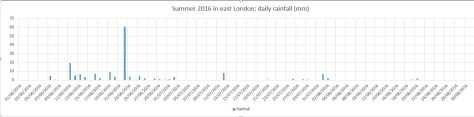
While it wasn’t quite up there with the hot summers of 1976 and 2003 it still produced some notable records. The stormy beginning to June effectively ended with the Brexit vote, a period of 24 hours that coincided with the highest daily rainfall this area has seen since at least 1959.
The multi-cell thunderstorm in the early hours of June 23rd produced 60.8mm of rainfall, nearly half of the month’s total which became the third wettest June in a record going back to 1797. The high rainfall was in complete contrast to July and August and helped skew the overall figure: 168.6mm is 114 per cent over average summer rainfall.
With so much rainfall overall sunshine was affected with only 451 hours recorded, just 80 per cent of what can be expected in an average summer.
July produced another record, this time the highest overnight minimum recorded since 1959. The minimum of 21.1C was recorded during the early hours of the 20th – coming hours after the hottest day of the year: 33.5C – the 14th hottest day on record.
The warm and very dry theme continued into the final month of summer with the warmest August for 12 years, the 10th warmest and 12th driest since 1797.
My summer forecast, when the monthly probabilities are considered, was broadly correct though I didn’t estimate correctly just how warm it would be.
Though there were no records broken August 2016 goes down as a mighty fine summer month, the warmest for 12 years. The mean of 19.5C was 1.3C warmer than average and only 0.1C cooler than 2004.
Grasslands around Wanstead Park have gradually turned brown because of the lack of rainfall
The month ended a three-year run of poor or so-so Augusts: in terms of mean temperature the month was the 10th warmest in a local series going back to 1797.
It was another very dry month: just 11.9mm fell, 24 per cent of average, the driest August since 2003 and the 12th driest in the local record.
The month only falls down in terms of impressiveness when sunshine hours are considered. Some 192 hours were recorded, the 59th sunniest since 1797 – 1995 had 80hrs more sun.
Air frosts: 0, Ground frosts: 0
So what has September got in store weatherwise? The models on the 1st suggest the month will start mixed, though any precipitation will be below average. Temperatures remaining on the warm side.
Beyond the grasp of the models my long range outlook method is again hampered by a very dry August. However, the data I do have suggests an average month at 100 per cent probability.
A wetter than average month looks most likely at 75% probability.
The rainfall probability makes me wonder whether we are in for a very unsettled second half of September, the Atlantic cranking into life with the remnants of tropical storms and hurricanes having an ever-increasing influence as the month progresses.
So to sum up: mean 15.3C (average), rainfall 162mm (300%), sunshine 140 hours (100%).
My August outlook for temperature was good. I predicted a mean of 19C (outcome: 19.5C). It was drier than I thought: 30.3mm (outcome: 11.9mm). Sunshine was poor: 239 hours (outcome: 192 hours).
Here follows the full weather diary for August…Full stats for the month here:http://1drv.ms/1rSfT7Y
1st: Cloudy start to 1pm. Rain started at 5pm through to 10pm. A brief interlude before more light to moderate rain through the night 4.30am, then drizzle
2nd: Damp, miserable start – the rain became light to moderate in the early afternoon before drying up – very high dew points through the day.
3rd: Bright and breezy with variable cloud.
4th: Bright start with variable cloud and sunny spells.
5th: Good sunny spells all day – perfect summer’s day, not too much humidity – though an isolated shower passed over at 8pm.
6th: Sunny, clear start. Lots of sunny spells during the day.
7th: Bright start though very breezy. Cloud decreased through the day to leave a gorgeous late afternoon and evening.
8th: Sunny, clear start with lots of fair weather cumulus throughout the day. Cloudier spells mid afternoon.
9th: Sunny with fair weather cumulus up until noon then cloudy afternoon.
10th: Sunny with fair weather cumulus, variable throughout the day. Breezy.
11th: Cloudy start with very brief light rain, barely enough to damp ground. Some sunny intervals later and bright and warm.
12th: Sunny start with a few clouds. Turned gin clear at 11am and stayed clear all day. Feeling hot.
13th: Bright start but turning cloudier. Sunny intervals PM.
14th: Cloudy start breaking to some long sunny spells. Feeling very warm in the sun.
15th: Bright start soon turned sunny with a clearance at 1pm.
16th: Bright start though a lot of haze around. Sunnier later though still hazy.
17th: Sunny with patchy cloud to start, this clearing late morning to leave a clear if rather hazy afternoon.
18th: Sunny if a bit hazy to start, this tending to decrease to leave warm sunshine.
19th: Cloudy with rain threatening. Low cloud at Stansted. Brief rain in afternoon then cloudy.
20th: Dull and overcast at 9am. Burst of heavy rain at 10.15am clearing to sunny spells at noon 30. Rain between 7pm and 8pm and 3am and 4am.
21st: Bright start. Sunny intervals till 3pm then sunny spells.
22nd: Bright after earlier rain at 0719 then sunny spells.
23rd: Clear and sunny start with a few cirrus clouds through the day. Hot.
24th: Sunny, gin clear start. Patchy cirrus through the day. Hot.
25th: Lots of altocumulus and sunny spells but felt sultry due to high dew points.
26th: Cloudy start but gradually decreased to leave clear pm.
27th: Overcast but bright start. Brightness through the day but hazy. Some heavy storms further north.
28th: Overcast until early afternoon, 5 minute shower at 2pm then sunny intervals..
29th: Bright start then sunny spells and cirro cumulus gradually clearing to leave a sunny evening and clear night.
30th: Clear and sunny start.
31st: Bright start though cloud filling in by 3pm, clearing again at 8.30pm
On a Saturday closest to full moon in July thousands of cyclists congregate in London Fields and ride 200km through the night to Dunwich on the coast of Suffolk.
Weather stats for London during the Dunwich Dynamo
Modestly described by the organisers as a “gentle bike ride to the beach, through soft country on good roads” the hours of darkness present a huge challenge for participants.
Michael Barry, the retired Canadian professional road racing cyclist, rated the challenge 5/10, harder than the 280 mile London to Paris ride which he ranked only 2/10.
Taking place in summer you would expect long hours of moonlight to be a welcome assist for these brave souls who peddle hours through the night to reach their goal. A look at the synoptic charts and statistics of each ride, however, reveals weather that is often a long way from being summery.
Looking in detail there appears to be very little chance of the ride coinciding with a heatwave. In 1999, 2003, 2004 and 2014 riders left the capital during days where the mercury reached above 80F (26.7C) – though this represents only 17% of starts. Temperatures around 70F (21.1C) are much more common.
Over 40% of the rides have seen over 1mm of rain on the opening day, this falls to 17% on the second day – a dry end to the marathon challenge is perhaps to be expected.
Patrick Field, of the London School of Cycling, said that 2007, the wettest start day to a Dynamo, was “gloriously wet”.
Perhaps what this blog also reveals is that UK weather at full moon, even in high summer, is notoriously unpredictable. Luke Howard , the father of meteorology, tried for 50 years to
prove a link between the weather and phases of the moon, but died still mystified at the ripe old age of 91.
Low pressure centred along the south coast brought a ‘gloriously wet’ Dynamo in 2007.
A movie of all synoptic charts highlights just how unsettled this time of year can be found here.
* The author is planning to take part in this year’s event to raise money for Cancer Research.
** Full stats for the weather in London during the Dunwich Dynamo back to 1992 can be found here: https://onedrive.live.com/redir?resid=A148835276FAFDEE!2561&authkey=!AEMmoeUZRVSq7uU&ithint=file%2cxlsx
The winter of 2015/16 was skewed by a ridiculously mild December which brought the natural calendar forward three months.
A persistent flow of air from the Azores caused the unseasonable warmth in December, skewing the overall temperature for the season
Daffodils and other spring bulbs which normally come out in early March in this part of the UK were in full bloom at the end of December. Spring blossom was also very early with many may trees out in early February.
The mean temperature for the season finished 7.38C, that’s 1.9C above average. It was the third warmest winter in my series going back to 1797, behind 1989 / 90 and 1974 / 75.
Rainfall was almost precisely average: 144.8mm fell, within half a millimetre of what normally falls. Sunshine was just under average: 162.8 hrs is just over 5 hours short of what we’d normally expect during December, January and February.
The warmest day of the winter occurred on December 19th with 16.3C recorded, the second warmest December day in my daily record going back to 1959 – the record fell short by just 0.1C.
Snowfall, like the previous two winters, was very scarce
The coldest night of the winter coincided with the coldest mean temperature on January 19th. A low of -5.7C was the lowest value recorded in Wanstead for three years.
The wettest day of the winter occurred on January 10th when 11.6mm, a very unremarkable amount for winter and in complete contrast to the deluge that affected NW England and NE Scotland. There were 51 rain days (where 0.2mm or less fell) and 37 wet days (where 1mm of rain falls over a 24hr period).
Although sunshine was around average there were 24 sunless days.
Snow, like the previous two winters, was very scarce: just one day of snow falling and lying occurred on January 17th, though you had to be up early to see it.
So, all in all, not bad. The Daily Express and others should take note. This is what they printed last November… I’ll leave it up to the reader which forecast was more useful…
During the opening months frequent cold blasts brought much wintry weather. Cold weather at the end of January turned severe during the second week of February.
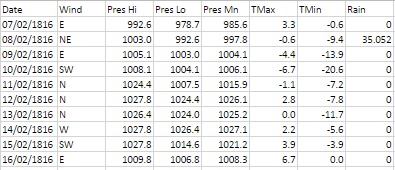
In the early hours of the 7th heavy snow, driven by gale-force north-easterly winds, brought some of the worst winter weather this area has ever seen. Some 35mm of precipitation is recorded on the 8th – this would normally give at least one foot of level snow that could obviously be whipped up into huge drifts.
Luke Howard described the scene in his diary entry saying the abundance of snow “loaded the trees to their tops and weighed down the smaller shrubs to the ground.”
The snow and polar continental air also produced perfect conditions for a textbook radiative cooling night within two days of the snowfall. The minimum recorded on the morning of the 10th: -20.6C has not, as far as I can tell, been repeated since.
To put that into perspective the lowest minimum of the severe winter of 1963 for this area was -12.2C recorded at Greenwich on January 21st. The coldest night I have personally recorded was -10.3C on January 12th 1987.
Howard, who would have taken readings at his laboratory in Stratford and home in Tottenham, remarked on the rare occurrence of the cold and said that the thermometer had remained below 0F (-17.8C) for a number of hours: “an occasion that happened less than five times within a century – the last appearing to be 19 years previous.”
Howard’s theory of the day was that such extremes didn’t occur during long continued frosts but rather at an interval of one winter after such a season. He mentions the frost of 1794-95, which lasted 44 days, immediately before which the thermometer fell to -2F. The following year a low temperature of -6.5F was recorded. The year 1816 followed the cold winter of 1813/14 – the same pattern, so Howard was prepared for the night of February 9th 1816.
Modern climatologists tend to discount these old records by arguing that standard conditions set by the World Meteorological Organisation were not met. However, Howard backs up his findings with a very thorough explanation of how he went about measuring the record low temperature that followed a freezing day where the maximum thermometer didn’t rise above -6.7C.
“Early in the evening on trying the experiment of placing a wet finger on the iron railing it was found to adhere immediately and strongly to the iron. I exposed several thermometers in different situations.
“At 8 pm, a quicksilver thermometer with the bulb supported a little above the snow stood at 0F. At 11pm a spirit thermometer in the same position indicated -4F, the former which had a pretty large bulb had not sunk below -3F. At 7.30am the 10th a quicksilver and a spirit thermometer hung overnight about 8ft above the ground indicated respectively -3F and were evidently rising.
“The thermometer near the surface of the snow had fallen to 5F and probably lower, but at the usual height from the ground of my standard thermometer the temperature was at no time below -5F. The exposure is north and very open.”
Howard goes on to describe the following day:
“From 8am the thermometer continued to rise steadily at noon a temperature of 25F was pleasant by contrast to the feeling and it was easy to keep warm in walking without an upper coat. Even at 0F, however, the first impression of the air on the skin was not disagreeable; the dryness and stillness greatly tending to prevent that sudden abstraction of heat which is felt in moist and quickly flowing air.
“Early in the afternoon the wind changed all at once to SW some large cirri which had appeared all day passed to cirrocumulus and cirrostratus with obscurity to the south. I now confidently expected rain as had happened in former instances but was deceived and the thaw took place with a dry air for the most part and with several interruptions by night.
As often happens with severe cold snaps Howard reported on the 17th that the snow “was mostly gone but very thick ice remains on ponds”; a period of just over a week.
The cold snap saw the mean temperature for February 1816 over three degrees colder than average at 0.8C.
Such extreme temperatures are rare in the capital though not unheard of. I know that there have been cases of sub -20C readings in, for example, the Rickmansworth frost hollow and Ian Currie’s Chipstead Valley, but I have never seen anything so low in east London. Could it be repeated again? Possibly, but like 1816, the synoptics would have to be absolutely perfect for it to happen.
This year finished as the ninth warmest year on record – some 0.5C cooler than 2014.
Every month of 2015, apart from September, November and December, was roughly average – the means being within +/-0.7 every month, bringing the mean temperature to 11.9C, 0.7C above the 1981-2010 average.
Rainfall was less remarkable with the year being dryer than average. The total of 553mm puts it as the 162nd wettest since 1797.
It was also a very slightly duller than average year with 1,433 hours of sunshine recorded. That’s 97 per cent of average, the 77th dullest since 1881 – the least amount of sunshine for 11 years.
When I was writing up my winter forecast I came across an analogue that was very similar to what happened during the period November 10th to December 31st.
The period November 10th – December 31st in 1806 and 2015 show some striking similarities. It is also notable that mean during 2015 was 3C higher than 1806. Is this a question of synoptics or a warming world?
The results showed a close similarity between the two periods, November 10th – December 31st, though the mean in 2015 was some 3C warmer than 1806. Is this a question of synoptics or is this area now 3C warmer than it was just over 200 years ago?
Rainfall was also remarkably similar: 87.7mm fell from 10/10 – 31/12, just over 5mm more than 1806.
The period November 10th – December 31st in 1806 and 2015 show some striking similarities. It is also notable that mean during 2015 was 3C higher than 1806. Is this a question of synoptics or a warming world?
Luke Howard, in his first volume of The Climate of London, describes a very warm December that followed on from a warm November that fooled flora and fauna into thinking spring had begun early.
Howard’s statistics are very high: a November mean of 9.5C while December was 7.2C. CET that November was 2.3C above average while December was 3.3C above average. Considering the England Wales Precipitation series a slightly wetter than average November was followed by a very wet December – over 250% the monthly average.
“The catkins of the filberts expanded prematurely. On December 25th a hedge sparrow’s nest was taken at Doveridge, Derbyshire, with four eggs and near Warwick a green linnet’s with two eggs. It is worthy of remark that the heat was the same on December 24th as on June 24th last – on both those days the thermometer being nearly 60F.”
Howard goes on to describe how the south-west wind had “reigned for weeks” – for most of November and December before finally giving way at the turn of the year.
“The south west wind which had so long reigned yielded just at the close of the year to the north and west . Some frost ensued which, however, had not the characters of permanence being neither ushered in by driven snows nor accompanied with a dry and serene atmosphere.”
The period November 10th – December 31st in 1806 and 2015 show some striking similarities. It is also notable that mean during 2015 was 3C higher than 1806. Is this a question of synoptics or a warming world?
His description is not dissimilar from what is known as a “three-day toppler” cold spell where a dominant European high briefly gives way to cold air from the north-west or north, bringing often heavy snow to Scotland and the north but just a few cooler days in the south, before the cold feed is cut off as the high re-establishes itself.
Howard also describes how the warmth affected plants.
“The effects of the late high winter temperature on vegetation must have been obvious to everyone who has seen the country. To the very close of the year the grass continued to grow, the daisies to enamel the turf and many of the inmates of our gardens native and exotic to thrive and blossom. Even hyacinth bulbs left in the open beds shot up and flowered. Ten years ago winter came on six weeks earlier and with considerable severity.”
Words that echo what’s going on this month, particularly in the south-west where I’ve heard reports of roses still in bloom and affected by greenfly whiles daffodils look like they will be out in a couple of days.
January and February 1807 were, by the standards of that time, roughly average.
Much of the UK media has been very persistent in the past few months in saying that large positive anomaly El Niño years herald cold winters – basing their assumption on one year: 2009/10.
Whilst that winter was very cold, among the top 10 coldest of the last 70 years in this area, another El Niñoyear, 1997/98 – the strongest in recent history – brought London its third-warmest winter in a record going back to 1797.
When I had a look at ENSO data going back to 1950 a few months ago I found it impossible to find a definitive teleconnection between El Niño and winters in north-west Europe. However, now that we are midway through November, and with a fair impression of how the monthly mean will finish, I had another look.
NOAA data shows that the most similar El Niño years to this are: 1957, 1965, 1972, 1982, 1997, 2002. Taking in to account only mean temperature shows that November values have increased.
What does this mean for this winter? It is still impossible to tell and is just another variable to consider when the time comes to predict winter.


 With so much rainfall overall sunshine was affected with only 451 hours recorded, just 80 per cent of what can be expected in an average summer.
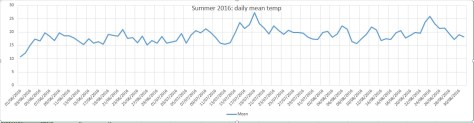


 Beyond the grasp of the models my long range outlook method is again hampered by a very dry August. However, the data I do have suggests an average month at 100 per cent probability.
 My August outlook for temperature was good. I predicted a mean of 19C (outcome: 19.5C). It was drier than I thought: 30.3mm (outcome: 11.9mm). Sunshine was poor: 239 hours (outcome: 192 hours).


You must be logged in to post a comment.