It is no surprise that London’s heatwaves are getting hotter but by what rate are they increasing?
Using a list of hot spells made nine years ago I set out to find how the 30-year trends have moved through the decades since 1852.
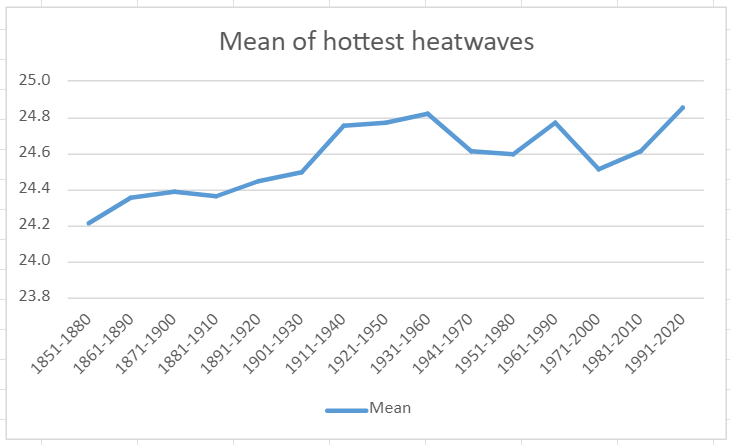
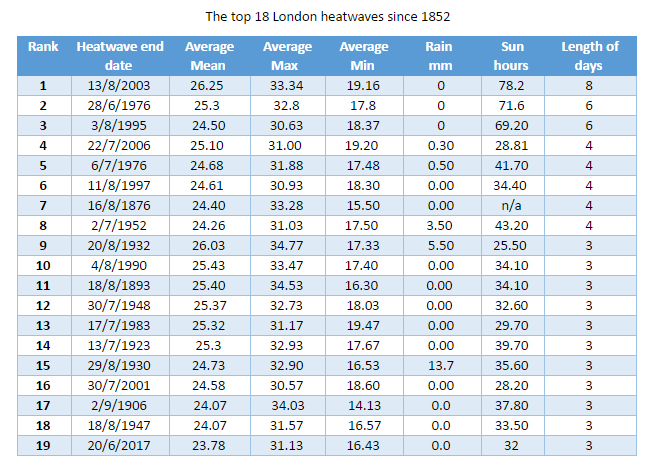
The mean of these hot spells has increased from 24.2C in 1851-1880 to 24.9 in 1991-2020, an increase of 0.7C.
Maxima during these spells, on the other hand, has decreased from 32.6C to 31.8C. It should be noted that the spell that produced this area’s hottest ever daily maximum, 40.1C on July 19th 2022, was a 2-day affair that didn’t qualify for the list.
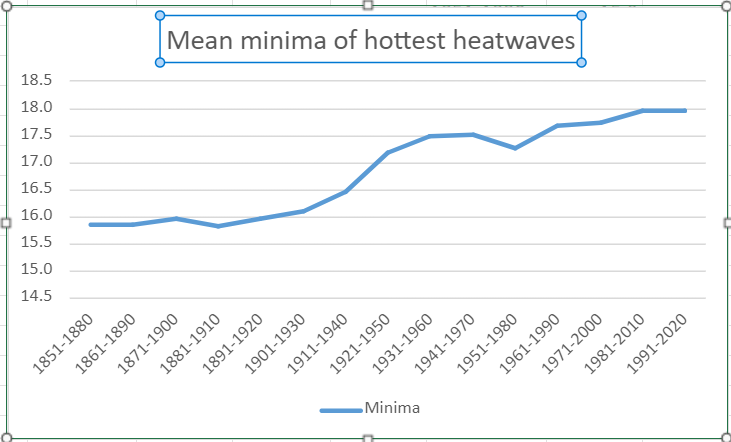
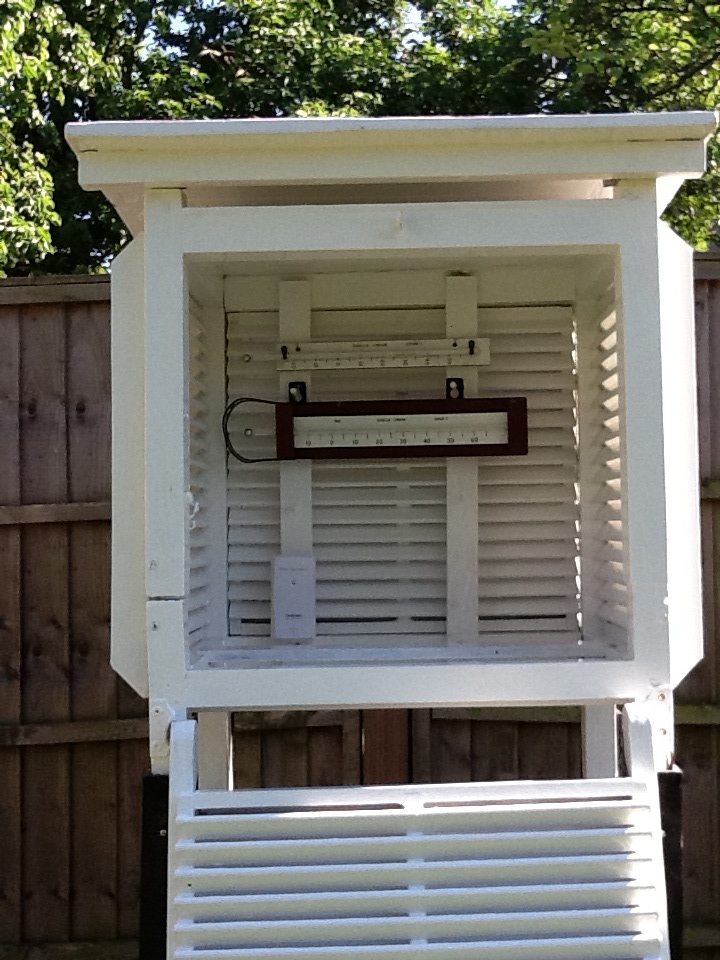
It is the minima that produces the most notable results with average low temperatures increasing over 2C from 15.9C to 18C! The urban heat island in full effect although the estate where a large proportion of these stats are gathered has changed little since it was built in the early 1900s.
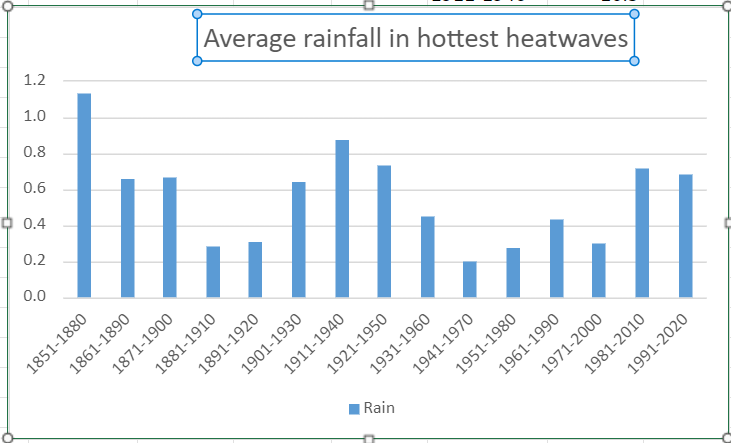
Rainfall during these hottest heatwaves is cyclical, in keeping with daily rainfall patterns observed over the same period.
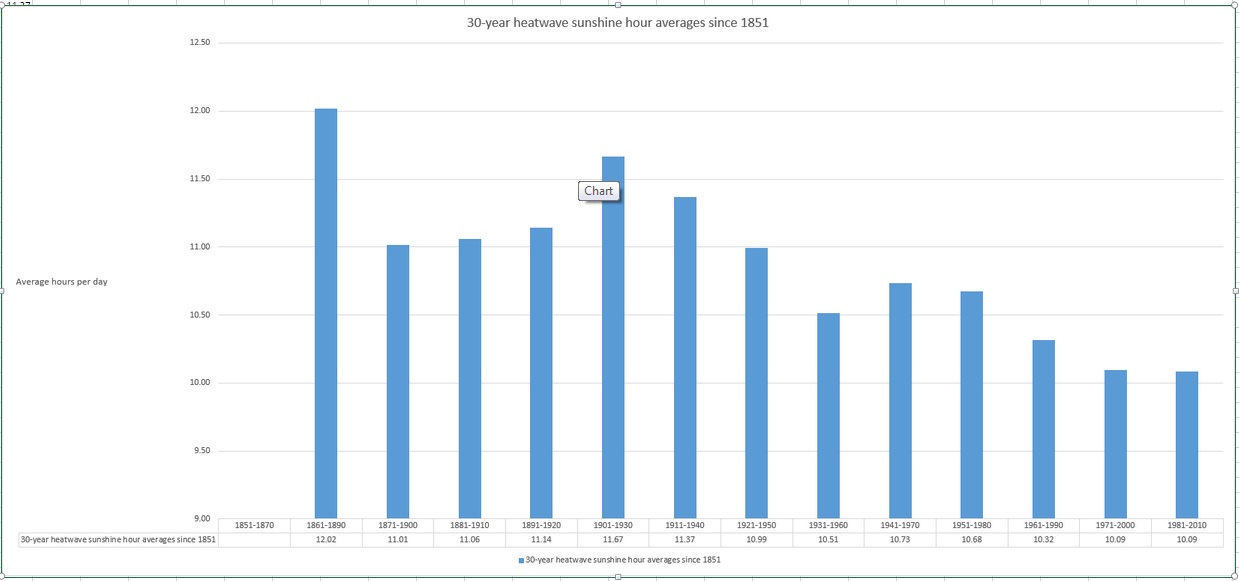
Average sunshine in these heatwaves has shown a slight decline. It is no coincidence that maxima was at its highest during 1911-1950 when there was most sun. Increased cloud cover overall would take the edge off maxima while making the nights warmer.
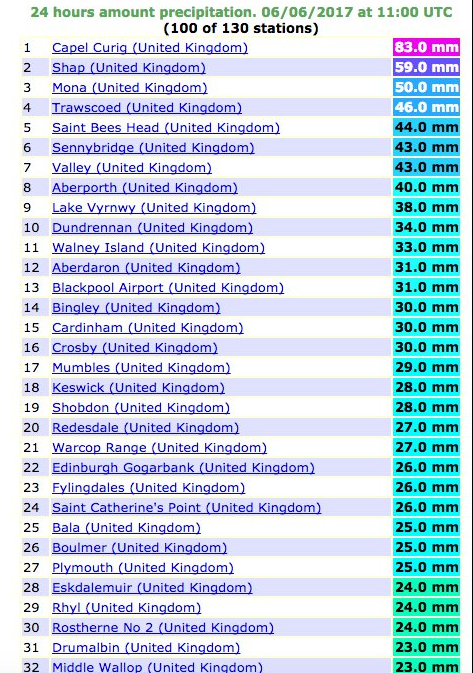
June 2017 has been a month of real contrasts. A thundery deluge on the 2nd was followed by conditions typically brought by the European monsoon.
24hr rainfall totals
Warm weather followed in the second week before a full-blown heatwave arrived bringing the hottest June spell since 1976.
The mean temperature for the month finished at 18.9C, that’s 2.8C above average. It was the second warmest June in a local record going back to 1797. Though it was only 0.4C cooler than 1976 it was also much wetter than that very dry month.
Though it appeared a wet month, over two-thirds of the recorded rain fell in two episodes.
Sunshine for the month was 202.3hrs, 114% of average.
In terms of the rest of the summer you would be forgiven for thinking that we have already had more than our fair share of good weather. One way of looking at it is to count the number of days the mercury rises above 25C with 10 hrs of sunshine. Since May that has happened on 13 occasions – far higher than anything in the past four years.
It will be interesting to see if July and August, normally the months where we get most of our summery weather are as good as June.
Summary for June 2017
Temperature (°C):
Mean (min+max) 18.9
Mean Minimum 13.8
Mean Maximum 23.9
Minimum 9.9 day 12
Maximum 31.5 day 21
Highest Minimum 21.1 day 21
Lowest Maximum 16.7 day 28
Air frosts 0
Rainfall (mm):
Total for month 71.1 (138.9%)
Wettest day 31.2 day 02
High rain rate 108.4 day 02
Rain days 8
Dry days 22
Wind (mph):
Highest Gust 27.3 day 05
Average Speed 3.5
Wind Run 2550.5 miles
Gale days 1
Pressure (mb):
Maximum 1025.0 day 16
Minimum 984.2 day 05
Total hours of sunshine 202.3
Here follows the full weather diary for June. To view full stats follow this link:http://1drv.ms/1kiTuzv
1st: Sunny with scattered cumulus through the morning, the cloud thicker during the day.
2nd: Cloudy start though brightening up with long sunny spells. Cloud bubbled up and a heavy thunderstorm moved in at 3.15pm and lasted an hour. Sunny again by 6pm.
3rd: Bright start with decreasing cloud.
4th: Sunny start though cloud bubbling up late morning into early afternoon. Cloudy and breezy with a few spots of rain at dusk.
5th: Cloudy and very breezy start. Bright at times.
6th: Rain and very windy to start with gale force 9 in Channel. Rain lasted into the early afternoon before clearing to bright spells. Odd shower overnight but remained blustery with a few trees down. Flowering cherry fell at mum’s at 6.30pm.
7th: Sunny with long sunny spells. An area of rain after dark then overcast through the night.
8th: Cloudy and breezy, a shower at noon and some bright spells at 1pm.
9th: Sunny though breezy with lots of cloud. Spots of rain in the wind.
10th: Sunny and warm start with lots of sunshine. Very breezy.
11h: Sunny and feeling very humid but breezy. Alternating between very warm sunshine and cloud. Very brief few drops of rain at dusk then mostly cloudy night.
12th: Sunny periods throughout the day. Cloudier at times. Clear overnight with warm, sunny start.
13th: Sunny, clear start and feeling warm early.
14th: Sunny most of the day with odd cumulus. Very warm though turning a bit fresher overnight.
15th: Sunny morning though with more cloud than yesterday. A fresh breeze developing.
16th: Sunny with variable cloud. Warm.
17th: Sunny though lots of hazy cumulus.
18th: Sunny though much cloud amid the humidity. Felt airless with only limited breeze. Oppressive overnight.
19th: Sunny with cloud decreasing
20th: Bright start though cloud breaking at 11am to leave clear afternoon with just a couple of cumulus.
21st: Sunny and hot all day with patchy cirrus. Warmest June day since 1976 at Heathrow 33.9C. Warm overnight but more of a breeze. Sunny early.
22nd: Very brief rain shower at obs time then sunny intervals. Cooler but still humid. Very breezy overnight.
23rd: Long sunny spells with hazy cumulus. Although cooler still hot in the sunshine. Cooler overnight and breezy.
24th: Mostly cloudy though bright. A sharp shower in the evening.
25th: Bright though mostly cloudy. A couple of bursts of drizzle but then sunny spells late evening.
26th: Sunny with lots of cirrus, cirrocumlus and a fallstreak hole in the sky. Warm but low humidity.
27th Sunny start though sun becoming scarce. Patchy light rain at 10.30am and thunder then a heavy shower at 3.45pm. Rain in the evening that lasted into the early hours.
28th: Cloudy and very dull at times with very light drizzle. Humid.
29th: Cloudy though bright with some sunny intervals.
30th Sunny though with lots of cloud. Decreasing cloud in the afternoon and a pleasant evening.
Heatwave hype has been building over the past few days and, for once, the media has been justified in its coverage of the current spell.
Temperatures over the past few days have been enough for the Met Office to trigger its Heath-Health Watch whereby the mean temperature (an average of the maximum and minimum) for two consecutive days reaches 23.5C.
A couple of years ago I compiled a list of heatwaves for this area back to 1852 where the mean temperature reaches at least 23.5C three days running. This spell, the only other June heatwave (the other being 1976!), only just scrapes into the list.
Although it felt hot this spell, in terms of Premier League quality, was more Middlesbrough than Chelsea.
Forecasters say today is likely to be the hottest June day for 40 years though I’d be surprised if we exceed the 34.2C recorded on June 27th 2011. It would be the fifth day running that 30C has been reached in this area, enough to fulfil the World Meteorological Organisation’s (WMO) definition of a heatwave.
Whatever happens today the fact that the heat has been produced by a tropical maritime airmass is remarkable. With France and Spain recording some very high temperatures of late the same pattern in July and August could put more records at risk of being broken.
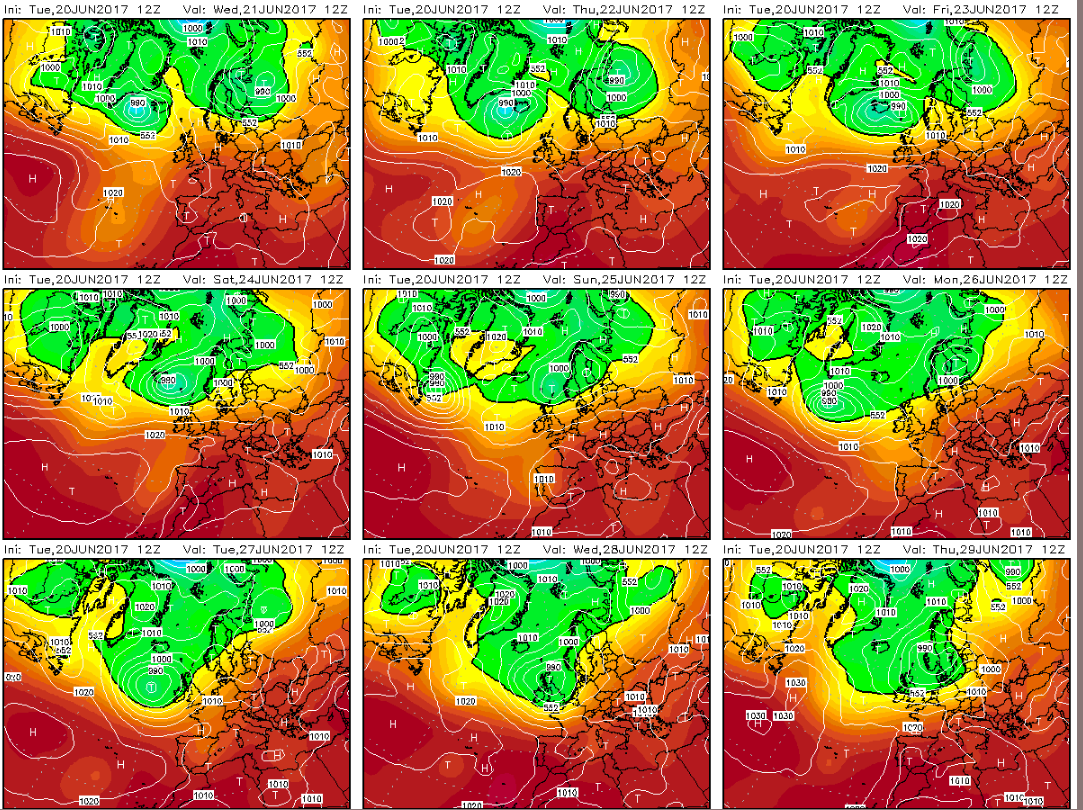
This week marks the 41st anniversary of the start of probably the finest British summer in history, but anyone hoping that yet another parallel with the 1970s is about to come true should take a look at the latest model runs.
The latest GFS operational run suggests a much cooler, more unsettled end to June – a polar opposite of 1976…
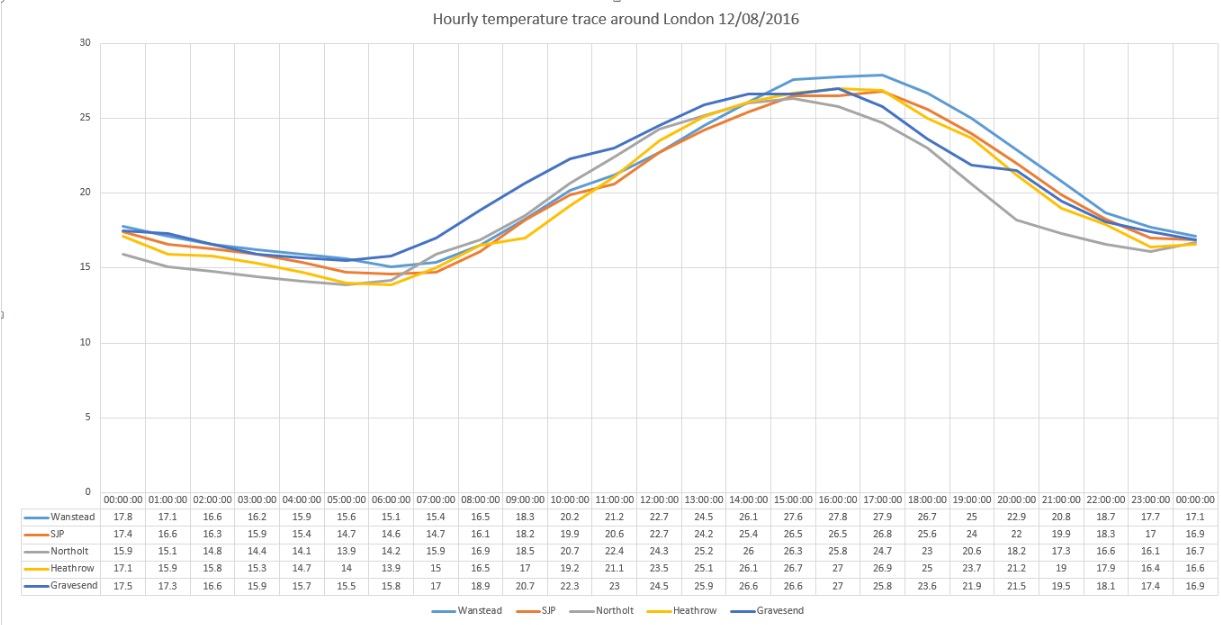
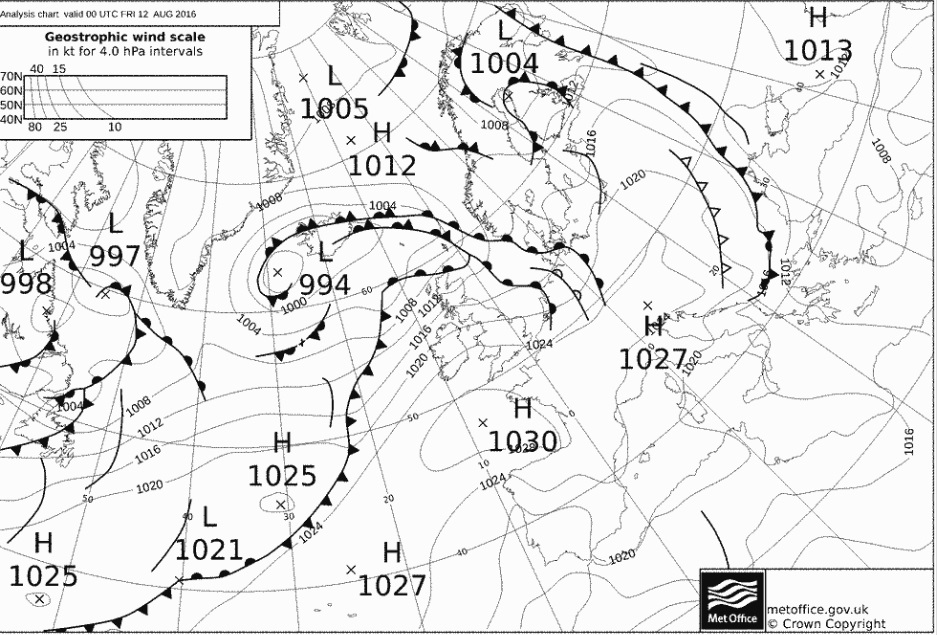
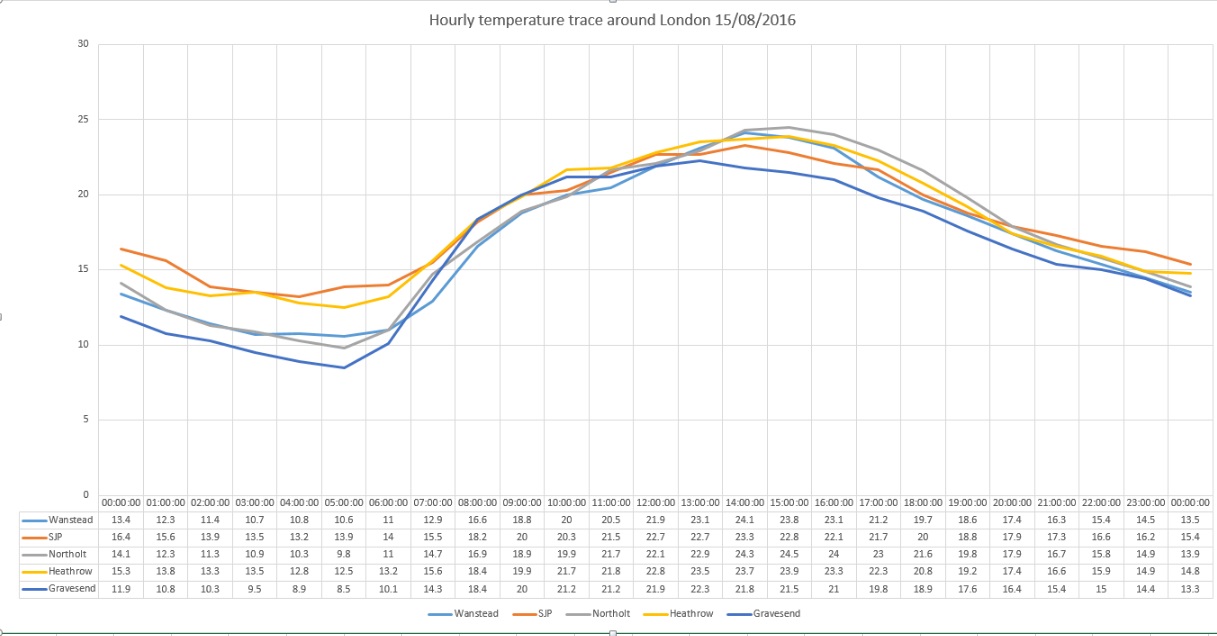
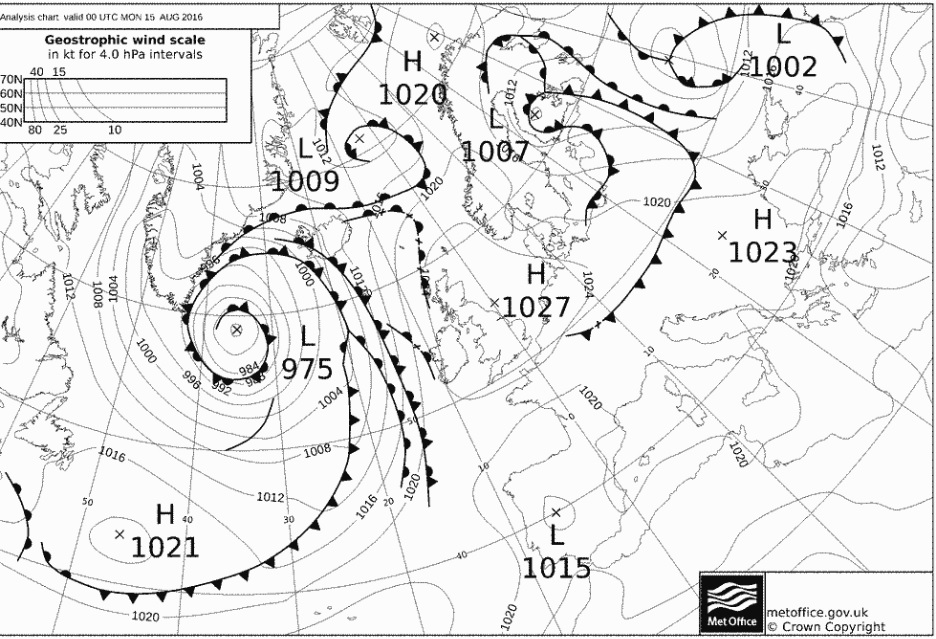
The past few days have offered a couple of perfect examples of how wind direction can have a massive effect on the resulting maximum temperature at this time of year.
Friday, August 12th and Monday, August 15th, were both very similar in that any morning cloud completely cleared by 11am. But while the wind blew from a SW’ly direction on Friday, nudging Wanstead up to a very warm 28.1C, by Monday the high pressure had drifted north, drawing in a cool NE’ly flow off the North Sea. The high temperature in Wanstead on Monday was nearly four degrees cooler at 24.4C.
Under these conditions temperatures will be warmer the further west you go, as the graphs below show.
Highs to 6pm on 12th were: Wanstead 28.1C with Northolt reaching 27C
Highs to 6pm on 15th were Northolt at 25C. Gravesend, being furthest east and most influenced by the cooling North Sea breeze reached 22.6C
Total days where the mean temp was 23.5C or higher
There are 2.5 times as many hot days during summer in London as there were 100 years ago – that’s the result I have found while looking at data for Greenwich going back to 1851.
Very hot conditions, where the mean daily temperature is 23.5°C or higher, as defined by the Met Office’s Heat-Health Watch System, have been achieved in this area on 199 days since 1852.
The Met Office, and other meteorological agencies, use 30-year averages to smooth any spikes of hot and cold years – so the result, in my view, is quite remarkable – even though it is just one dataset.
Looking at the data overall it can be seen that while average maxima has decreased by 1.6°C since 1881-1910, minima has increased by 2.1°C.
30-year hot day max / min average since 1881
The decreased maxima is possibly explained by the fact that the sun shines, on average, just over an hour less than it did a century ago. The reason for this could be because of increased air pollution and aircraft contrails?
The increased minima, on the other hand, could be being caused by the fact that vast tracts of suburban front and back gardens are now paved over – along with the loss of the shade of many trees. This, and increased road and house building, acts as a huge radiator, keeping nights warmer than they would have been a century ago.
Experts would question the hybrid nature of my dataset, even though my observing sites are very close to those of Greenwich. It is a shame that many of the first climatological stations, such as Camden Square set up in the early 19th century by George Symons, are not still around as they would now offer an unquestionable insight into just how much London’s climate has warmed.
Sunshine hours have decreased since the 19th century
You could argue that there is no doubt that the warming in these data is man made though, perhaps, paved gardens keeping summer nights warmer would be a lot easier and cheaper to solve than fulfilling the carbon capture policies of many of the world’s governments. But that is an argument for another post.
For now, as the capital’s population continues to increase, it is vitally important that planners get the next generation of property developments right to keep the population cool when a heatwave strikes. Extreme heat severely affects public health, not least the suicide rate – a study has shown that above 18°C, each 1°C increase in mean temperature has associated with a 3.8 and 5.0% rise in suicide and violent suicide respectively. Planners cannot just leave it to energy-hungry air conditioning to bring relief – developments should incorporate plenty of shade and natural cooling in their designs to help counteract the health impacts of future heatwaves.
* There were hot spells before the period in this post but I have excluded these: Luke Howard’s maxima observations from Plaistow, Stratford and Tottenham were taken under non-standard conditions and may be on the high side.
** I have focused my investigation on data recorded at the Royal Observatory, Greenwich. For some reason the data during a couple of years in the 1950s was incomplete – to fill in these gaps I used official data gathered at Kew. The data is completed up to the present day using my own observations taken since 1988.
July 2014 was yet another milder than normal month; the mean temperature of 20.2C was 1.7C above average, making it the 9th warmest July since 1797 – and 0.5C cooler than last July.
The month was marked with spectacular thunderstorms and torrential downpours, contributing to what was a much wetter than average month – some 73mm fell which is 168% of the monthly average. While on paper the month looks very wet it should be noted that 52% of the July total fell in two episodes: a stalling warm front on the 10th and a cloudburst on 25th. I was away for the thunderstorm though a friend remarked that the roads close to Redbridge Roundabout were like torrents, the rain was so intense for a short period. I’ve put together a series of radar images that show the evolution of the storm, together with graphs, that can be accessed here.
The hottest day was July 18th with 32.7C recorded. There were 12 occasions where the mercury reached or exceeded 80F – pretty respectable though last July saw that figure reached on 20 days!
The sunniest day was on the 3rd when 15 hours of sunshine were recorded. Throughout the month there were 11 days with 10 hours or more of sunshine. There were also 5 days with thunder recorded – the average for July is 3.
Looking further afield there were many thunderstorms around the UK though many places missed out on the big downpours. Perhaps the most impressive was the development of the MCS that moved up from France during the evening of July 18th. There were numerous superb pictures but my favourite is probably this shot taken by Richard Dixon in Whitstable, Kent. It shows, perfectly, the contrast betweeen the bright orange sunset and the impending doom of the approaching MCS from the continent.
This shot was taken by Richard Dixon in Whitstable, Kent. It shows, perfectly, the contrast betweeen the bright orange sunset and the impending doom of the approaching MCS from the continent
A thunderstorm on Sunday, July 20th, saw three inches of rain fall on Canvey Island in a very short space of time. A good round up of events, including pictures, can be seen here. The thunderstorm on 25th was felt across London and the Home Counties – there’s an excellent picture of the approaching shelf cloud here. Brighton was rudely awoken by a storm on 28th by a slow-moving thunderstorm.
It is a typical feature of summer that rainfall can vary a great deal across a small area. The nearest official station to Wanstead, St James’s Park 8.4 miles to our south-west, recorded recorded just 25.9mm – 35% of what fell here.
The nights were mostly warm – the 14.8C average is higher than last July.
Overall July was a superb summer month – sunshine, heat, thunderstorms in abundance.
Sunset on 31st looking across Wanstead Flats. July was a classic summer month for weather
Ask a dozen people what they think is a heatwave in this country and you’ll probably get 12 different answers.
The view across to St Paul’s from Bankside at low tide.
The UK press is always keen to tell us that a ‘heatwave is on the way’ – even if it is March and the heatwave in question brings temperatures no greater than the high teens Celsius.
Although in the UK there is no official definition of a heatwave the World Meteorological Organization description is “when the daily maximum temperature on more than five consecutive days exceeds the average maximum temperature by 5 °C, the normal period being 1961-1990”. In other words that March heatwave would see the thermometer peak higher than 15.3C five days in a row. Pleasant enough – but no big deal.
The Met Office, working with the Department of Health, provides a ‘Heat-Health Watch System’ for England which is triggered when a threshold temperature in the South East is 31 °C by day and 16 °C overnight for at least two consecutive days.
I have vague memories of the weeks of sunshine in 1976 but the hot spells that stick in my mind the most are August 1990, when the UK temperature record was set in Cheltenham, Gloucestershire, and August 2003 when an 8-day hot spell saw the all-time UK temperature record broken when 38.5C was reached at Brogdale, near Faversham, Kent.
Last July, when compared with the previous summers, saw some of the best summer weather since 2006. But where does last year compare with the good summers of 2003, 1995, 1990 and 1976? I decided to have a look back at the daily records for this area which stretch back to 1959.
I have drawn up a list of all days back to 1959 that have an average mean daily temperature of 23.5C or higher. This shows that there has been 93 such days. However, to qualify for the Met Office’s Heat-Health Watch System – ie two days like this in a row the list narrows. To make my job easier, I have narrowed the list further to 3 consecutive days where the mean has been 23.5C or higher. Though I loathe really hot weather in my experience I can put up with it for a couple of days. It is only when it gets to the third day of hot, sleepless nights that it starts becoming unbearable.
In terms of intensity and hours of sunshine, 2003 comes out on top. Though many people will argue that 1976 is more impressive -that summer, which comes in second, only produced two spells that satisfy my criteria. The first heatwave saw temperatures soar above 31C for six consecutive days from June 23. The start of the second, on July 3, saw Bjorn Borg win the first of five Wimbledon mens’ titles as he prevailed over Ilie Nastase in 35C heat.
The summer of 1995, which saw my driest-ever August with just 0.7mm of rainfall all month, comes in 3rd, with six days of mean temperatures of 23.5C or higher.
Polo advert for the heatwave that coincided with the Queen Mother’s birthday in 1990
Looking at the data another way, ranking the average total daily mean temperature of each spell, sees 2003 again come out 1st, with August 1990 and July 1983, 2nd and 3rd. Looking back through history it is not really surprising that 2003 comes out on top. While it was hot in London the heatwave across the Channel contributed to the death of over 70,000 people throughout Europe, France being the most affected.
This weekend promises to be very warm and sunny but it will pale into insignificance compared with the hot spells of the past. The mean temperature on Saturday and Sunday is unlikely to exceed 17C.
With all the talk of heatwaves this week it won’t be long before the media switches from piping on about the UK facing “10 years of miserable summers” to “Is our climate getting warmer?”.
But the simple fact is that the UK’s climate has always varied greatly – some years, as in the last two, the pattern for summer has brought mostly miserable weather. Other years we get a run of warm, dry summers.
A case in point was the heatwave of July 1808. Far removed from images of freezing Georgian winters and miserable summers the July of 205 years ago was among the warmest ever. The monthly mean for July 1808, according to the Central England Temperature series, was 18.4C – the 6th hottest July since the beginning of the series in 1659.
Readings taken by Luke Howard at Plaistow show the build up of heat to the 14th. The series on the right, taken in Wanstead, around 3 miles to the north-east, will be added to by the author as July unfoldsLuke Howard, the ‘father of meteorology’ who at the time lived in Plaistow, referred to the heatwave in his diary on July 13th: “Temperature at 9am 84F. The intense heat of the maximum lasted nearly three hours till about 4pm. At 6pm the temperature was 90F.” Another entry mentions a reading taken nearby. “Another at Plashet, a mile and a half eastward, indicated 96F as the maximum under the shade of a house.”
While Howard’s methods of measuring the temperature ran short of modern standards, his thermometer was hung under a laurel bush, the values still give a valid insight into the heatwave.
Tales of the heatwave, which particularly affected east and north-east England, can be seen in letters sent to local newspapers around the country. Many describe labourers dying from heat exhaustion while working in fields. Farm animals and horses suffered a similar fate. One letter from Hull, published in the Coventry Mercury, said: “At Sigglesthorne, the honey in some beehives melted, ran out upon the ground, and most of the bees drowned in it. At Sutton, a lamb and a dog belonging to the Rev Mr Croft of Rowley, expired in the heat; and several birds dropped down dead, while flying over the streets of this town.”
Of course it is impossible to know about the health of people and animals that died but that birds dropped out the sky suggests extreme heat.
While temperature records of July 1808 are not unheard of in an English summer one record that remains is the size of the hail – which fell in damaging storms when a thundery breakdown arrived on the 15th.
The main storm missed Wanstead and the surrounding area – though Howard, writing in his Plaistow observatory, knew the weather was on the turn: “Dew on the grass, a fine breeze from ENE. Much lightning in the west this night, a few drops of rain.” Howard would have been referring to all the action about 120-odd miles west where one of the most ferocious storms in recorded history was unfolding.
Much was reported in the local press on the days following the storm which affected an area from Somerset northwards. As well as local records Luke Howard also noted national events in his diary: “After several days of uncommon and oppressive heat the city of Gloucester experienced a storm of thunder and lightning which extended many miles round and exceeded in awful phenomena any one remembered for many years past.”
Trees were “shivered to atoms”, livestock killed by lightning, crops were ruined and countless windows and glasshouses smashed by huge hailstones. A lot of the detail of the storm was compiled by a man named Crocker, then governor of Frome school, Somerset. One account from Batcombe describes a hailstone that measured 13.5 inches in circumference. To give you an idea of the size of a 342mm circumference hailstone I, with the help of my daughters, made one of my own. It is thought the size of the 1808 hailstone may, along with a storm in 1697, be the national record for hailstone size – being 20mm greater in diameter than those measured in a Horsham, West Sussex, storm in 1958
Howard’s report continues: “The most tremendous circumstance of this storm was the destructive hail shower which accompanied its progress.”
The Tornado and Storm Research Organisation (TORRO) grades haistorms from H1-H10, where the hail increases in size from 5-10 to over 125mm in diameter. From the historic descriptions the 1808 storm was an H8/9.This exceeds the British record made during the Horsham, West Sussex, storm of September 5, 1958, which produced hailstones up to 80mm in diameter. Hailstones for the 1808 storm were about 109mm in diameter. Since 1650 there have been 119 independent H5 hailstorms in England and Wales.
Since 1900 there has been a halving in the frequency of recorded destructive hailstorms. Scientists are undecided on whether this is a result of climate change or just a variability of the British weather. But any future uptick in destructive hail should be tempered by this historic record.
It is my belief that people’s current expectations for summer were raised to unrealistic levels when we had a run of warm, dry summers a few years ago. The fact is that because of our maritime climate warm, dry summers occur in this country only occasionally. ‘Default’ summer weather is changeable, rather cloudy and, for many in the north, rather cool
So, if any media outlets do start coming out with any stories of “unprecedented heat” or “worst storm in history” bear in mind that it has probably all happened before.


You must be logged in to post a comment.