Tag Archives: London climate

The local problem of global climate change

This year is likely to be the warmest on record globally, statistics from the Copernicus Climate Change Service suggest.

Samantha Burgess, deputy director of the Copernicus Climate Change Service, said: “October 2023 has seen exceptional temperature anomalies, following on from four months of global temperature records being obliterated. We can say with near certainty that 2023 will be the warmest year on record, and is currently 1.43ºC above the preindustrial average.”

On a local scale the average maximum temperature, considering the rolling 12-month average, has actually decreased 0.6ºC compared with last year at this date.

Looking at the last 10 years the past 12 months have been the 3rd warmest. With a building El Nino it could be assumed that next year will see a greater increase in anomaly here but, 2015 suggests, positive ENSO can actually lead to a decrease. As can a La Nina lead to an increase, as shown in 2022.

The climate system of the world is complicated in that it doesn’t warm uniformly which leads to problems when a sizeable part of a population look out of their windows and see weather that is cold and miserable. That social media lists the ever increasing number of weather disasters around the world doesn’t seem to make a difference.

Governments and agencies have their work cut out trying to convince enough people that we really must better look after the world, starting in our own back yards.

As Burgess adds regarding the United Nations Climate Change Conference later this month: “The sense of urgency for ambitious climate action going into COP28 has never been higher.”

YearRolling 12-month maximum at 7/11Change
201416.58
201515.53+1.05
201616.36-0.83
201715.96-0.4
201816.22+0.26
201916.21-0.01
202016.35+0.14
202115.25-1.1
202217.09+1.84
202316.49-0.6

London droughts back to 1871 (2022 update)

Since I wrote the original blog on London droughts in July 2018 there have been five more meteorological droughts.

The latest, as I write this on August 8th 2022, now sits joint 2nd in longest droughts in this area.

The rolling 12-month rainfall total has now reduced to 457mm; the lowest since 2017, and low given that the annual Jan-Dec rainfall average here is 602mm. At this point last year the rolling 12-month total was 818mm!

Looking further back, at a monthly rainfall series that goes back to 1797, the opening seven months of this 2022 are the 6th driest.

Whatever way you look at it this area is desperate for rain.

London’s colder than average months

Last November was on the cold side prompting me to investigate whether we were about to record a third month in a row below average. December turned out to be mild and wet, the lack of snow especially stark in Scotland.

The findings of that study showed that any sustained period of colder than average months was more likely to happen during months of March, April and May, nothing unusual there, especially considering H.H Lamb’s weather types.

I decided to scrutinise further all the colder than average months in this area, considering the 1981-2010 average, back to 1981. This gave the below results.

neg anoms

The dataset covers 399 months, of which 200 were colder than average.

The overall picture shows that negative anomalies are becoming more and more rare, though with notable exceptions being March 2013, December 2010 and January 2010.

The only month that has showed any sort of consistent general decrease in negative anomaly is November.

*For good snowfall at this station needs a negative anomaly of 2C during the months of November, December, January and February.

CET v Greenwich values since 1850

The climate of London can vary greatly to figures revealed in the Central England Temperature series. Because this dataset covers an area of the UK enclosed by Lancashire, London and Bristol the resulting monthly mean temperature can often be quite a bit lower than what is experienced in the capital.

Though these anomalies are smoothed in the monthly series that stretches back to 1659 notable daily extremes that happen nationwide tend to get lost. One example was earlier this month when the UK’s November maximum temperature record was broken. Trawsgoed in Wales reached 22.4C on the afternoon of the 1st whereas a largely foggy east London recorded just 11.5C.

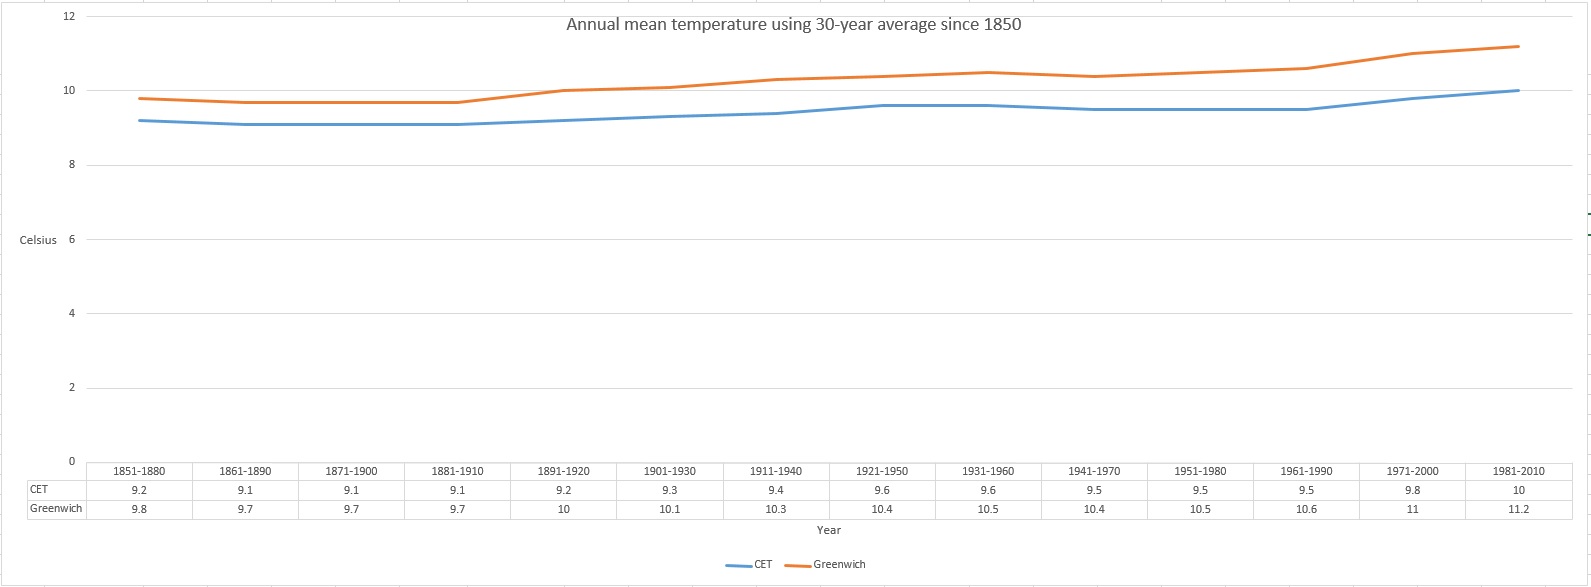
Comparing CET with data from Greenwich back to 1850 reveals a gradual decoupling between the two series, the warmth of London’s urban heat island effect an ever-growing influence.

CETvGreenwich

The 1851-1880 30-year average means show that Greenwich was 0.6C warmer than the CET series. By 1981-2010 this gap had widened to 1.2C – indeed the London series is today 1.4C warmer than it was in 1851-80 whereas CET has warmed by only 0.6C.

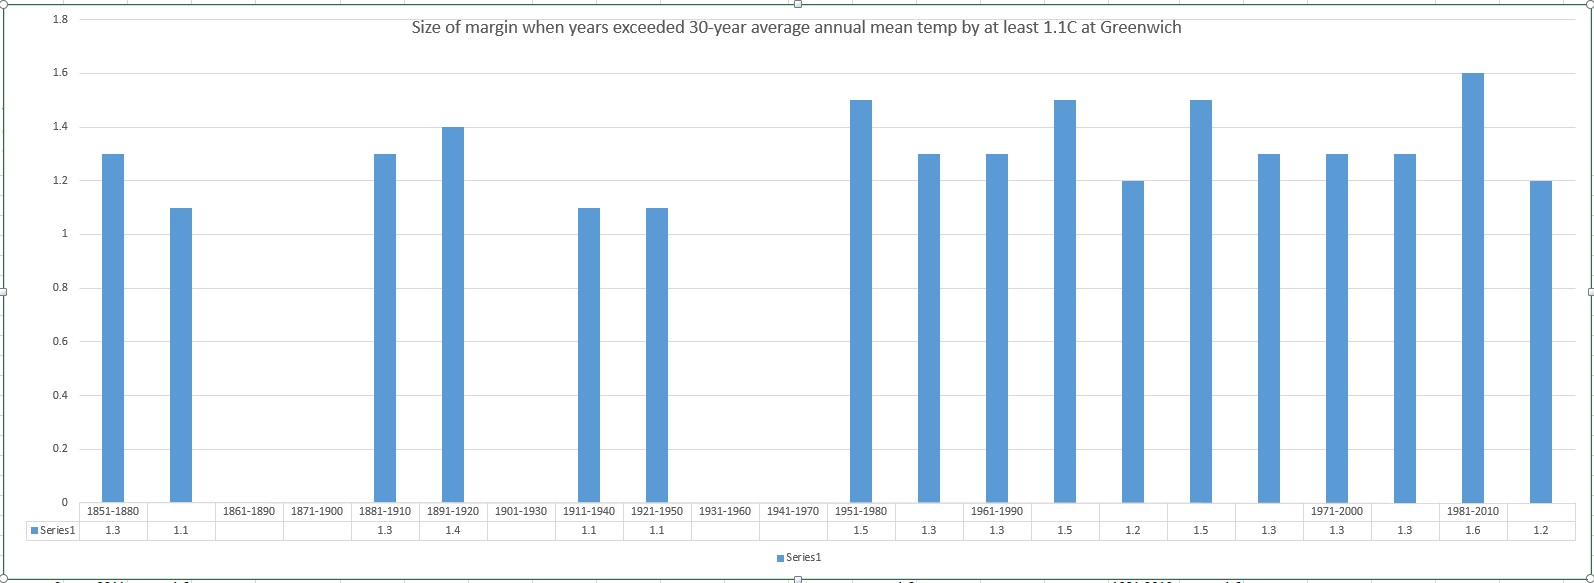
Delving further into the data reveals an increase in the number of times that the 30-year average mean is being breached by at least 1.1C. The period 1961-90 was the warmest in both cases with the mean being breached by 1.1C or more on four occasions in the case of CET and five in London. It is interesting to note, however, that the largest anomaly in the CET series is 1.3C in 1921, greater, albeit by only 0.1C, than the warm years of 1990 and 1999.

The largest anomaly in London, 1.6C, was set in 2011, 0.1C higher than 1999, 1997 and 1989.years exceeding relevant 30-year average annual temperature by 1.1C

The graph below shows the number of occasions that the 30-year average has been exceeded in each period by 1.1C or more. With 1961-90 being so warm it appears that CET warming has slowed though it should be borne in mind that we have another five years before the 1991-20 series can be released.

numberof years that exceeded 30-year average annual mean CET by 1.1C

With reference to the London graph below showing the number of occasions that the 30-year average has been exceeded in each period by 1.1C or more merely confirms that the level of the anomalies have increased but, as already mentioned, there are probably far more outside influences affecting the outcome such as UHI, population growth, further industrialisation etc.

The accelerated warming is a worry in terms of how London would adapt should summer temperatures greatly increase, though, of course, it remains to be seen if the anomalies will advance even further from current levels.

Global temperatures are on the rise though our part of the globe may not be as adversely affected as elsewhere.Size of margin when years exceeded 30-year average annual mean temp by at least 1.1C at Greenwich* The CET dataset is the longest instrumental record of temperature in the world. The mean, minimum and maximum datasets are updated monthly, with data for a month usually available by the 3rd of the next month. A provisional CET value for the current month is calculated on a daily basis. The mean daily data series begins in 1772 and the mean monthly data in 1659. Mean maximum and minimum daily and monthly data are also available, beginning in 1878.

For more information on CET follow this link.