
The current site hosting Wanstead’s weather station has been running for 11 years this month; the automatic station uploading data every 10 minutes to the internet.
The 10-year averages from the station are now good enough to be listed on the Climatological Observers Link.
A look at the eleventh month shows some interesting trends…
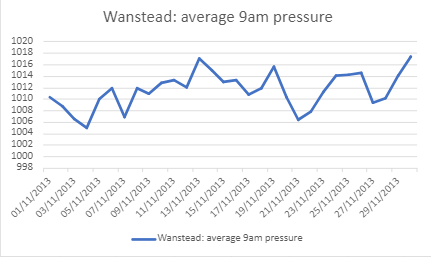
The 9am air pressure readings were not included in previous climate summaries owing to analogue barometers only giving approximate air pressure readings. The advent of AWS has changed that, particularly for independent amateur observers.
A look at the below graphic shows pressure lowest around the 4th, the stormiest weather of the month. Storm Ciaran in 2023 is proof of that.
Average daily windrun is how much wind there’s been during a 24 hour period. The 21st comes out as windiest, the date when in the past there has been some notable early snowfalls in the south of the UK.

Average rainfall shows most precipitation in the first two thirds of the month with the biggest fall of rain on the 19th.

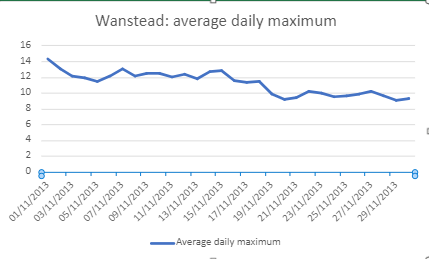
Average daily maximum temperatures during November take a general decline but, again, there’s a notable fall away on the 20th.
Average daily minima decline to the 5th (the 6th is the median for the first air frost) before increasing before falling away again after mid month.


One thought on “Wanstead weather in November”