Anyone hoping for a continuation of June and July’s hot weather would have been left sorely disappointed by last month which was characterised by frequent rain and the coldest August night for over 20 years.
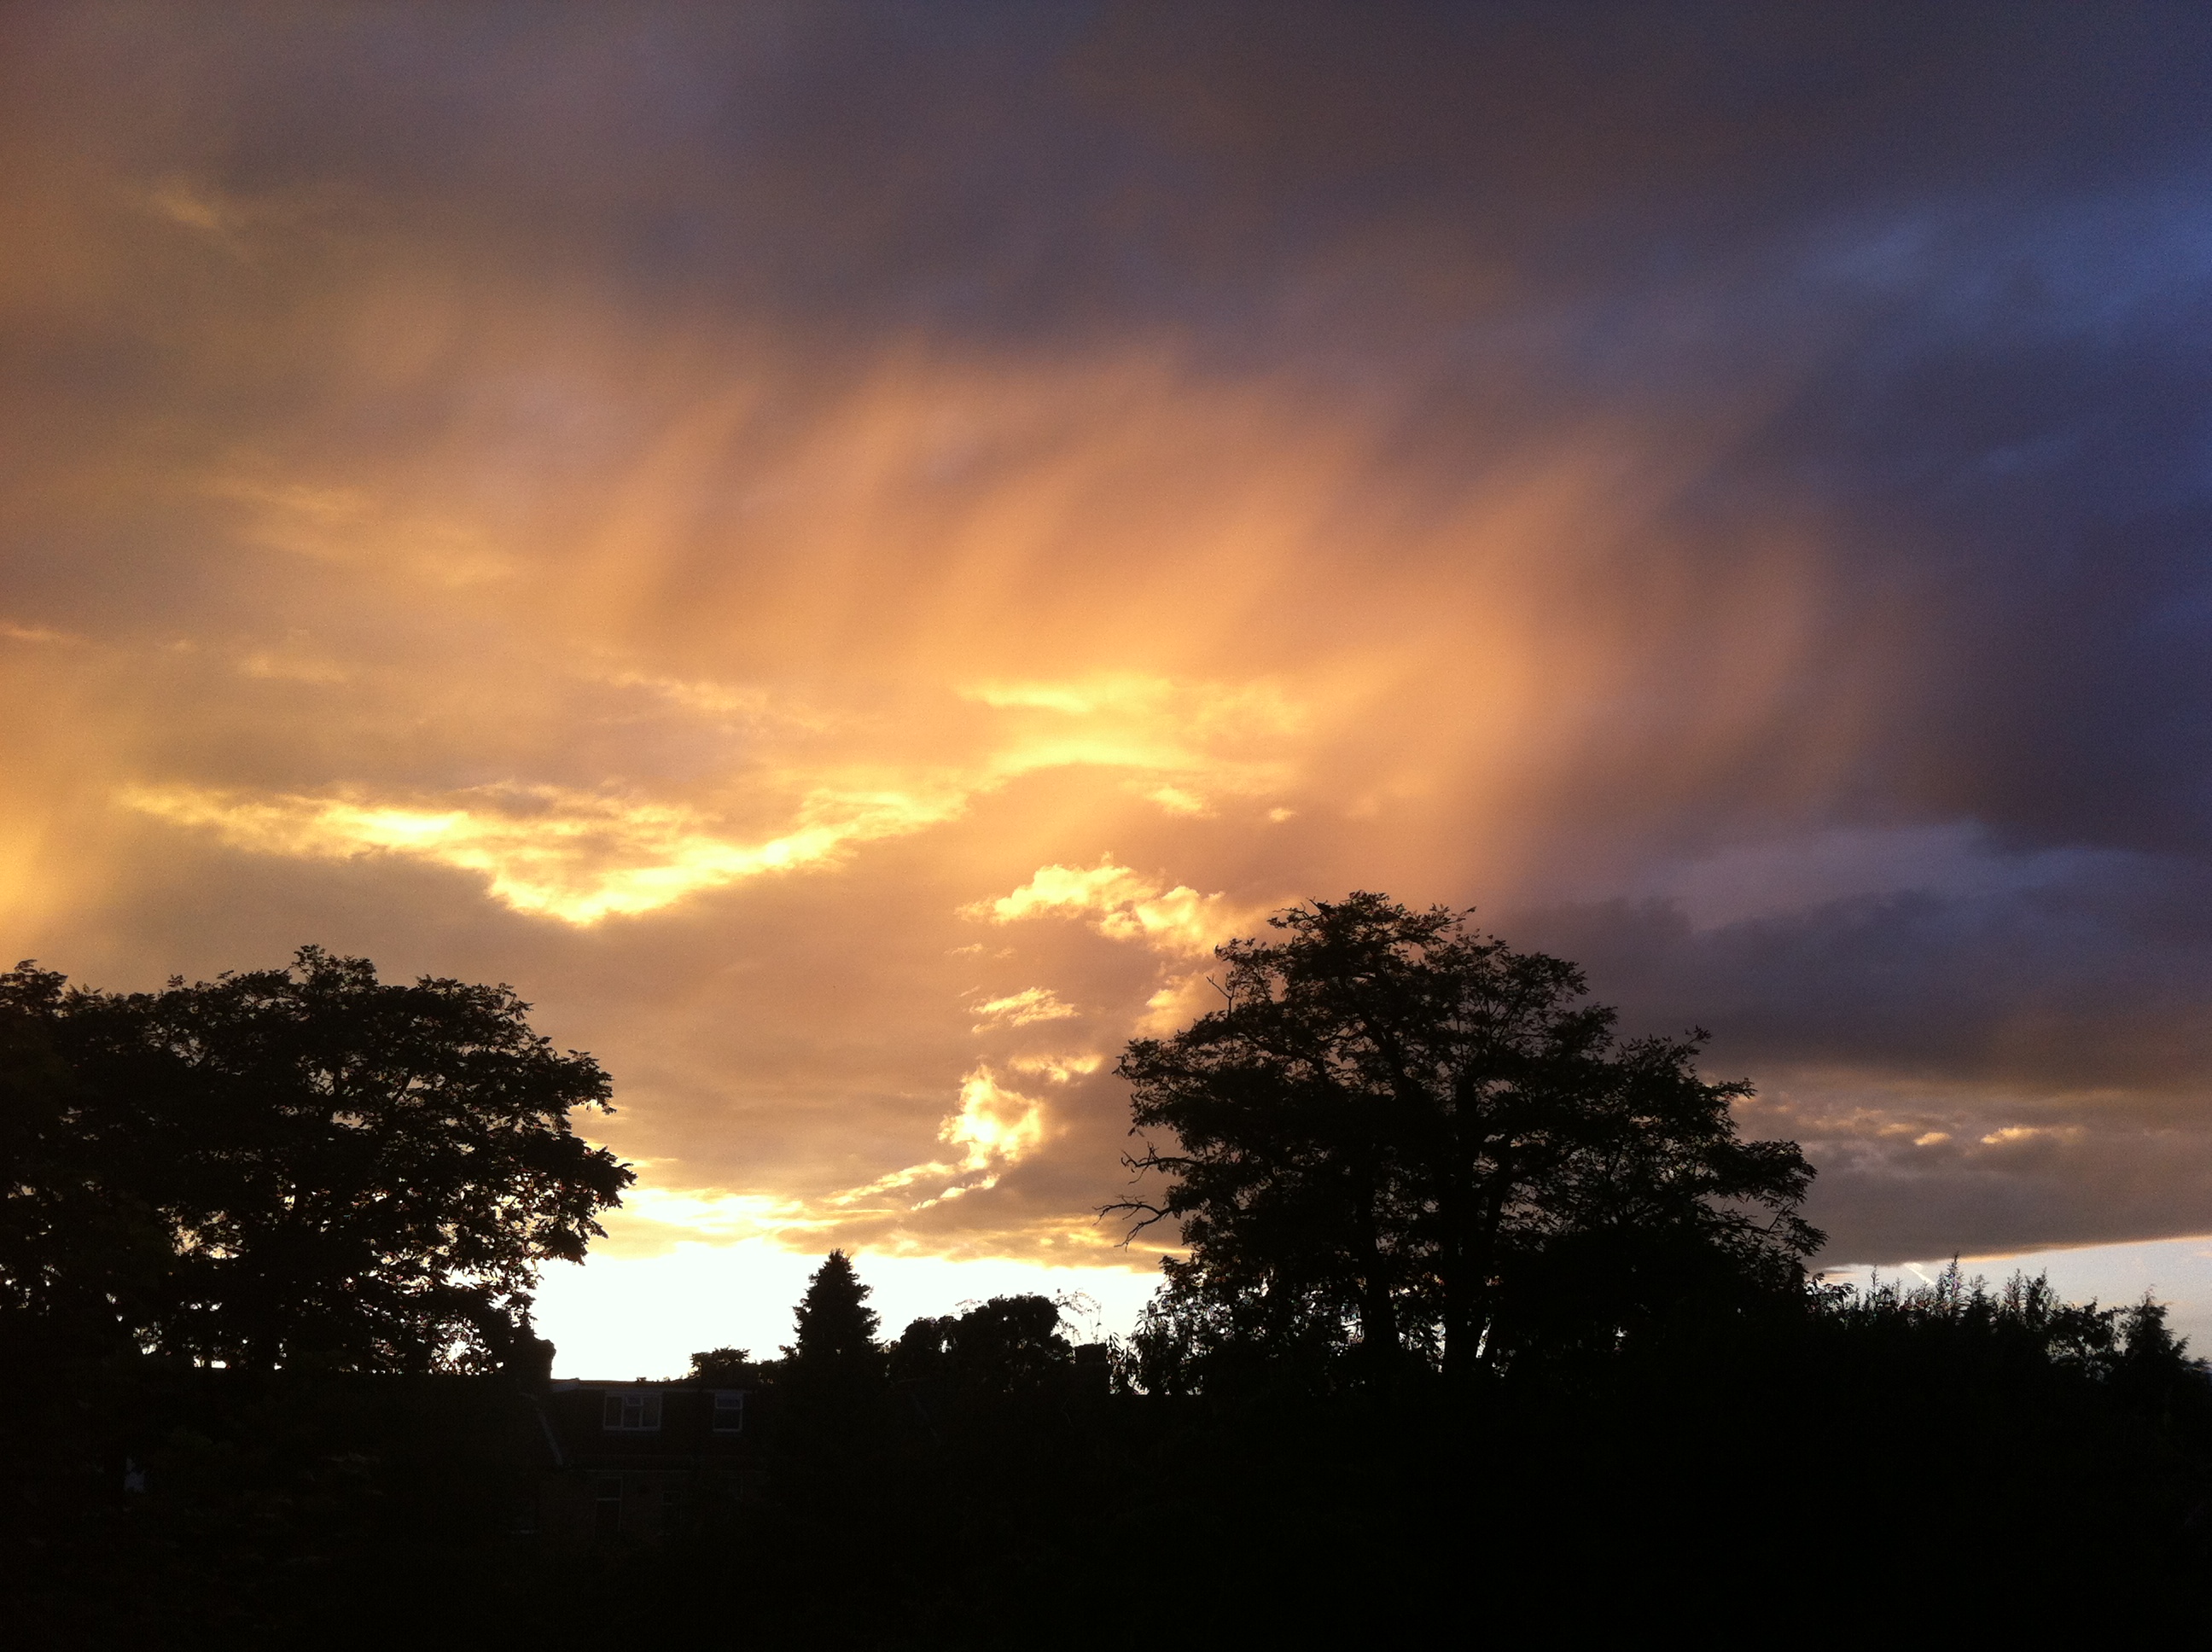
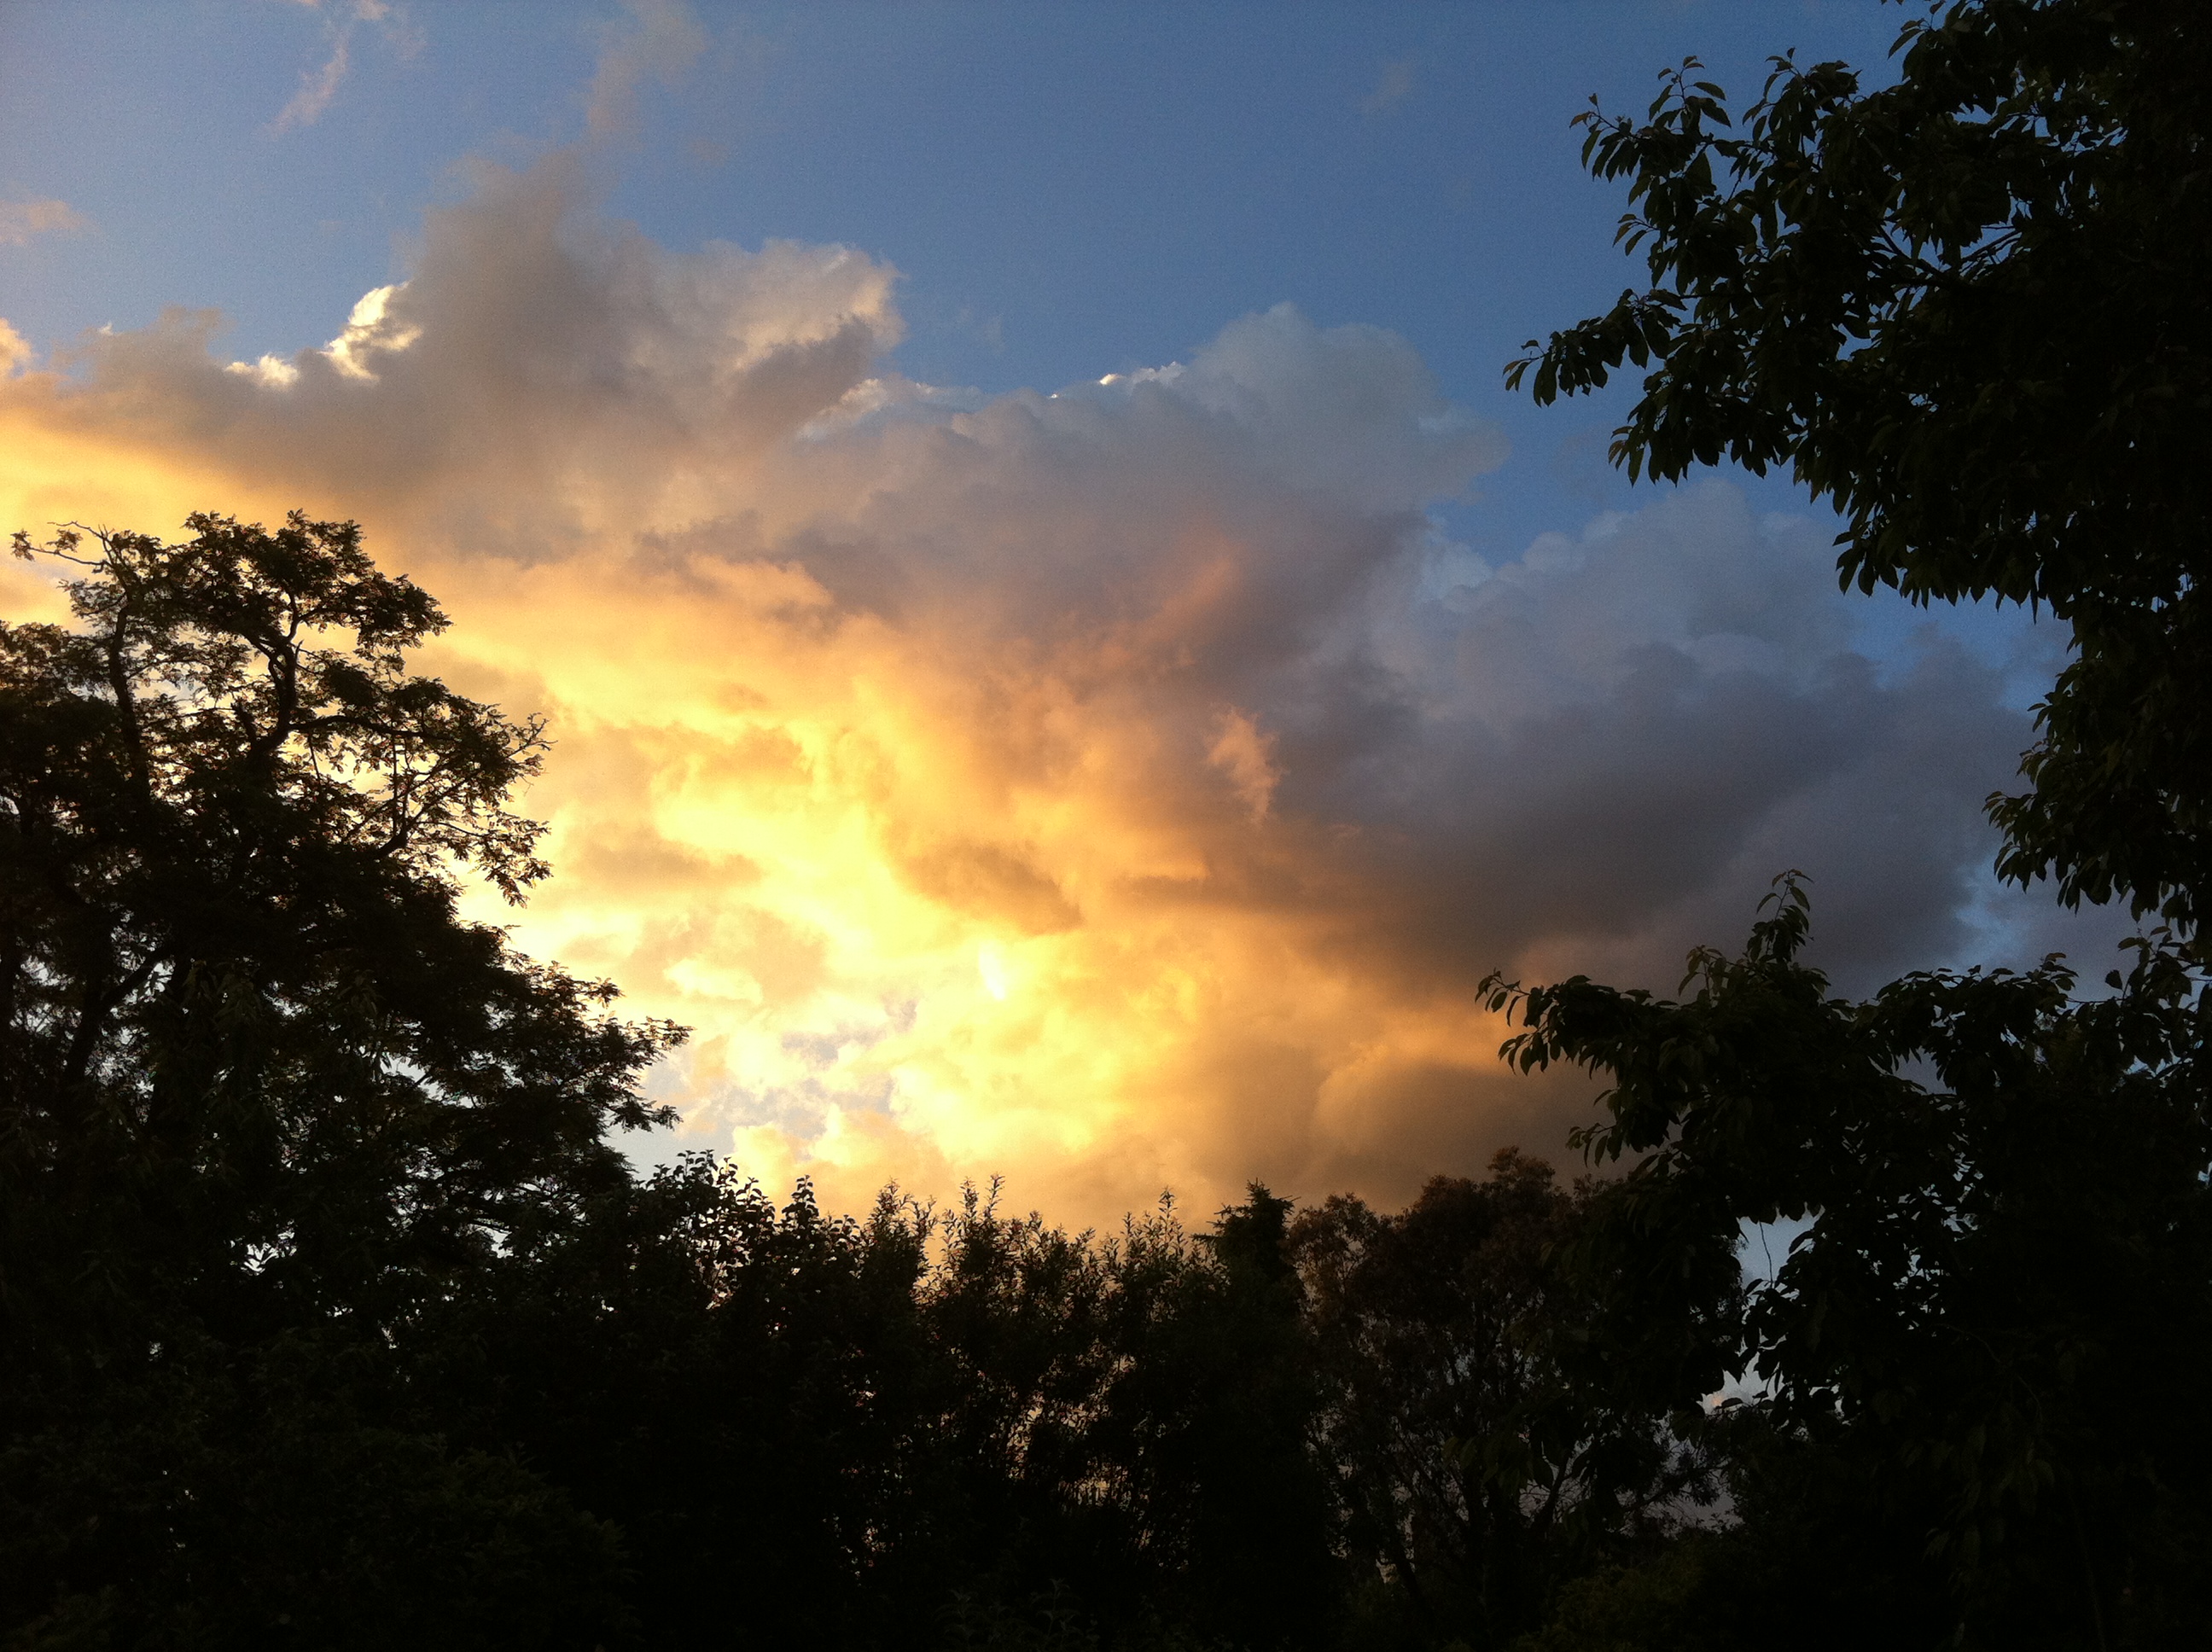
A stunning example of sunlight illuminating the underside of cloud at sunset was seen mid-month
August 2014 was the first month this year to be cooler than average; the mean temperature of 17.2C was 1C below average, making it the 89th warmest August since 1797: 1.6C cooler than last August, the coolest for 7 years.
The month was marked with thunderstorms and heavy downpours, contributing to what was a much wetter than average month – some 76mm fell which is 152% of the monthly average and the wettest for 4 years.
The hottest day occurred on the 7th with 27.3C recorded – nothing special for August and a date that heralded the end of the hot spell during June and July.
A couple of nights were notably cool for August: 5C was recorded during the early hours of the 23rd – the coldest August night since 1993.
Sunshine was below average with 161 hours recorded – that’s 83 per cent of mean. The sunniest day was on the 3rd when 12 hours of sunshine were recorded. Throughout the month there were just 2 days with 10 hours or more of sunshine. There were 4 days with thunder recorded – the average for August is 3.
Looking further afield there were many thunderstorms around the UK though many places missed out on the big downpours. It was yet another month where rainfall totals could vary greatly in the space of just a few miles.
On the 9th a station in Woodford Green recorded 24.4mm, double what fell in Wanstead. The legacy of TS Bertha coincided with the end of our extended hot spell – an excellent analysis of this storm can be found here.
There were some spectacular cloud formations not far from here. A particularly good one was seen in Witham.
On 25th a perfect curl could be seen on a depression centred off the west coast of Irleland. The rain associated with this low pressure brought the month’s highest daily rainfall total: 23.4mm (the system bringing 27.5mm) – a thoroughly miserable Bank Holiday Monday where it rained ALL day, from 6am until 9.30pm. It was yet another example of how much even frontal rainfall can vary over a small area.
On 25th a perfect curl could be seen on a depression centred off the west coast of Irleland. The rain associated with this low pressure brought the month’s highest daily rainfall total: 23.4mm (the system bringing 27.5mm) – a thoroughly miserable Bank Holiday Monday where it rained ALL day, from 6am until 9.30pm. It was yet another example of how much even frontal rainfall can vary over a small area with St James Park recording 38.2mm. The top 30 totals for that day can be seen here.
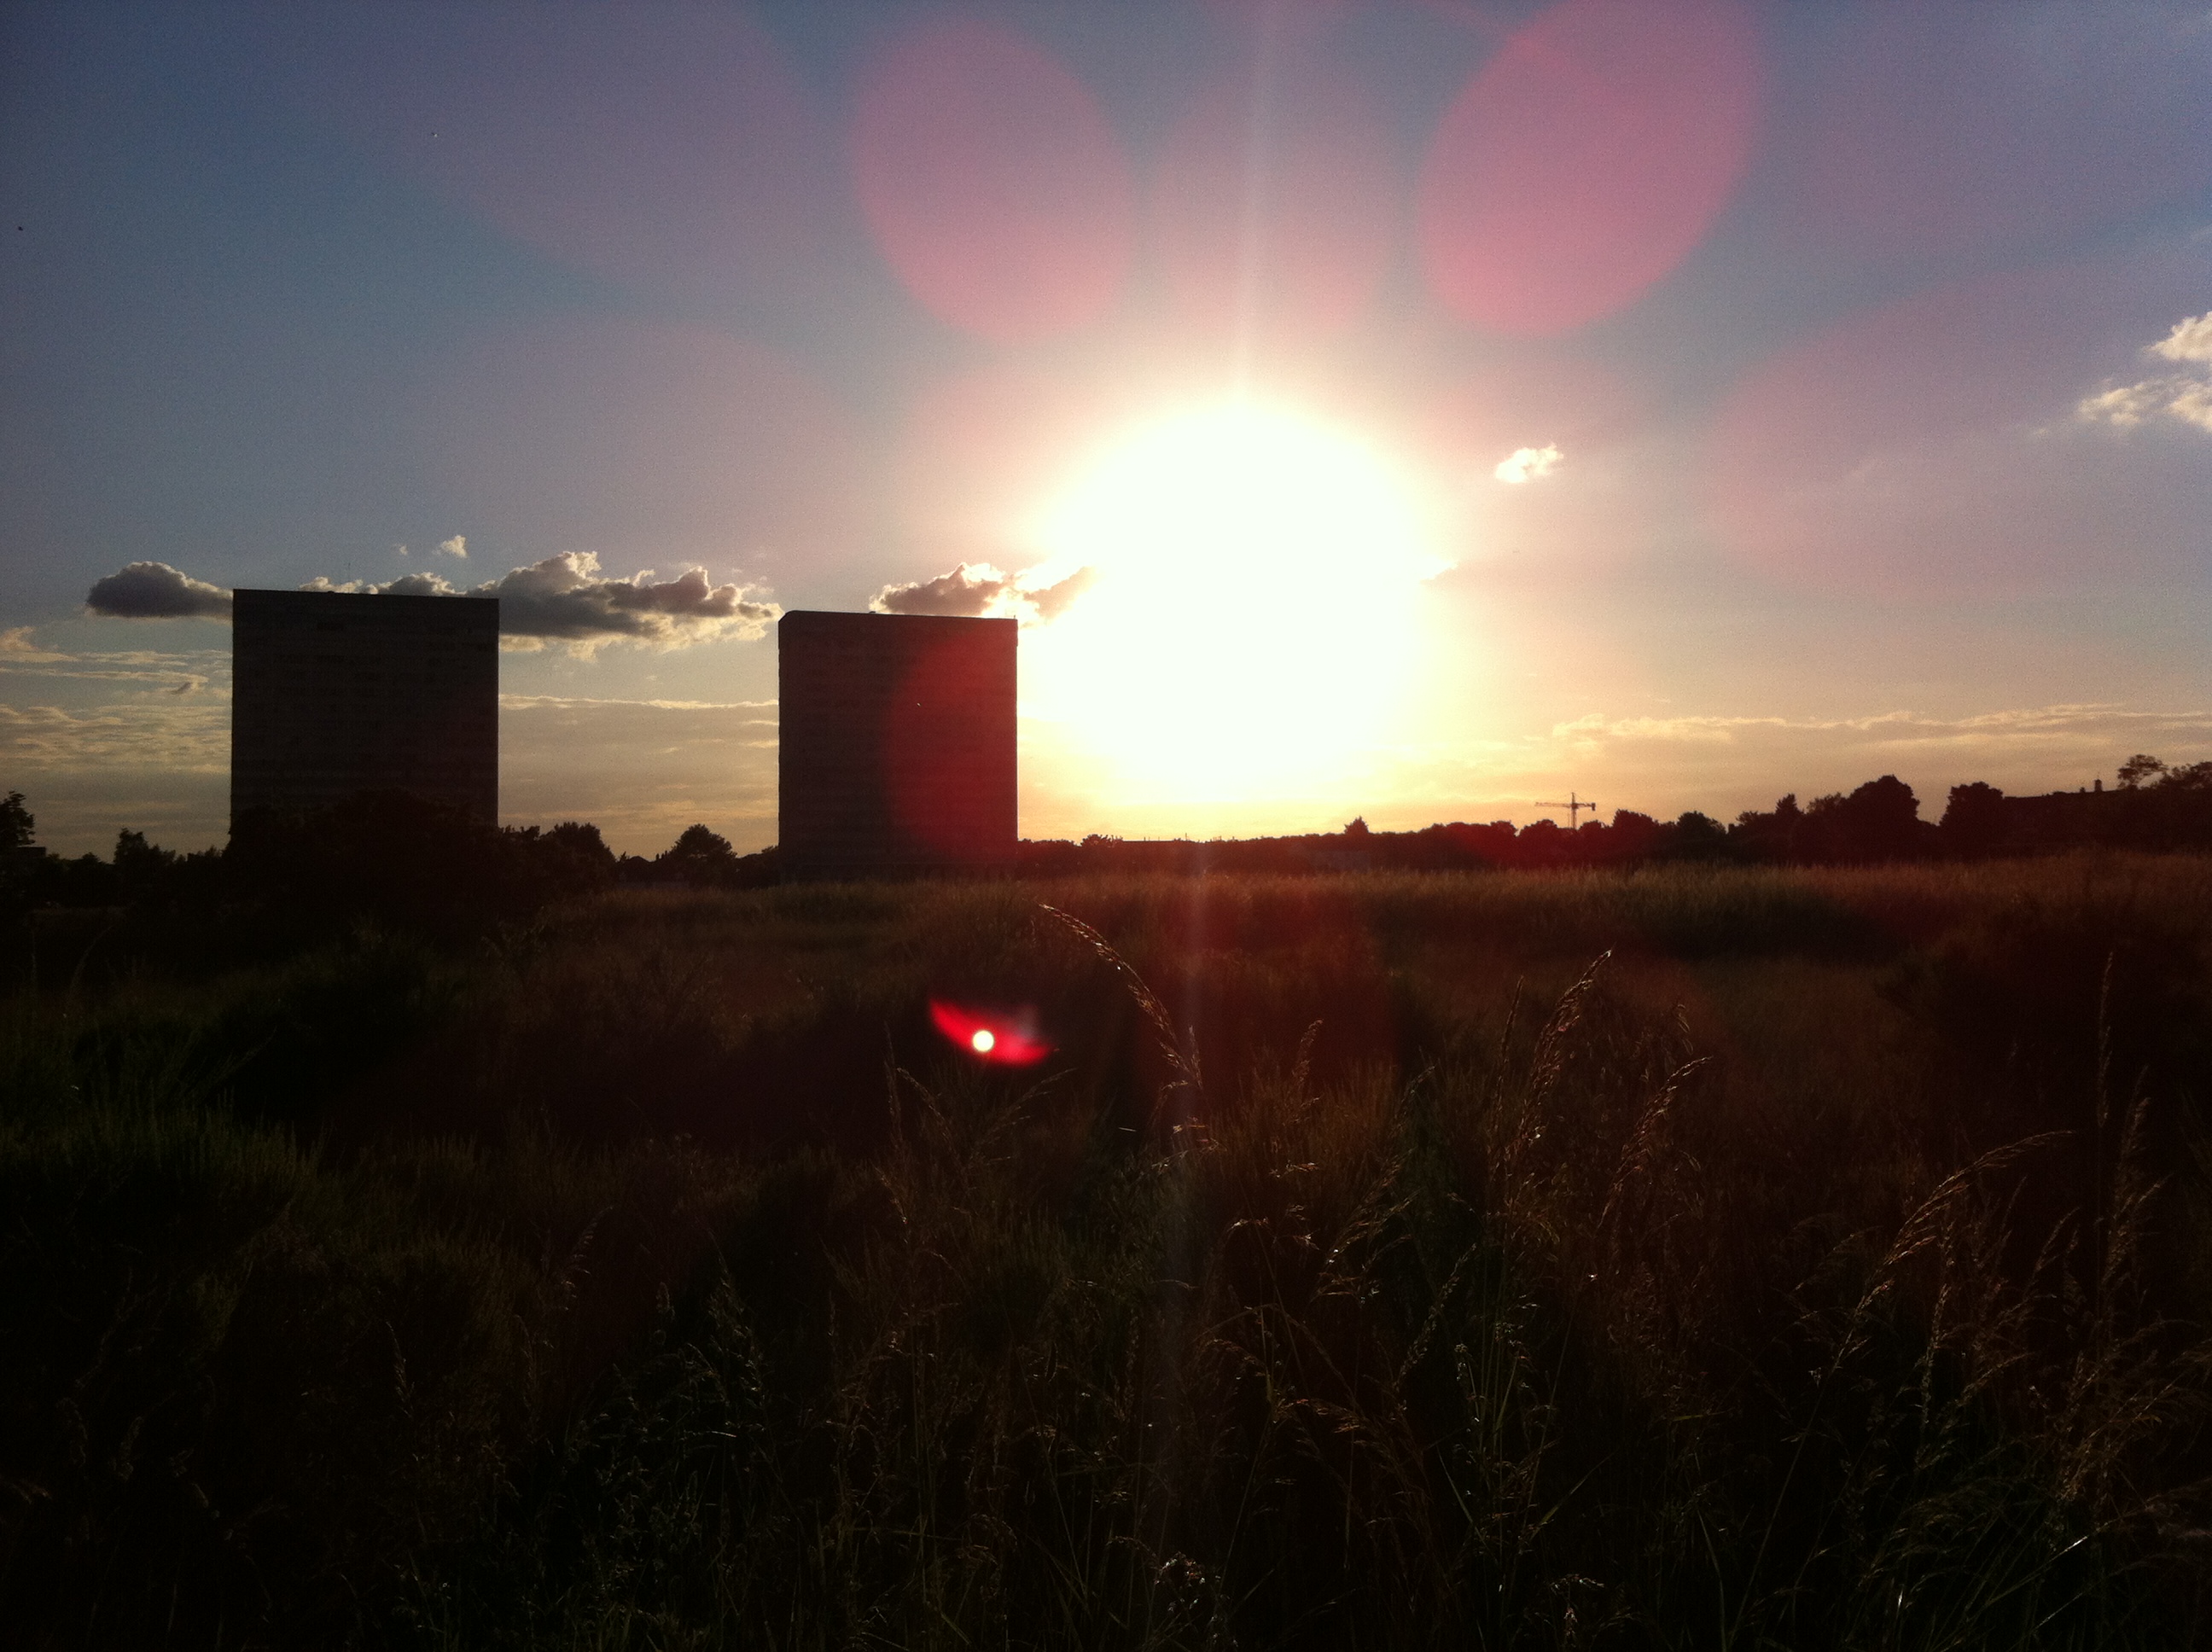
sunset overlooking Wanstead Flats 2nd August
Looking even further afield four people were killed in a flash flood at an Italian festival early on in the month.
July 2014 was yet another milder than normal month; the mean temperature of 20.2C was 1.7C above average, making it the 9th warmest July since 1797 – and 0.5C cooler than last July.
The month was marked with spectacular thunderstorms and torrential downpours, contributing to what was a much wetter than average month – some 73mm fell which is 168% of the monthly average. While on paper the month looks very wet it should be noted that 52% of the July total fell in two episodes: a stalling warm front on the 10th and a cloudburst on 25th. I was away for the thunderstorm though a friend remarked that the roads close to Redbridge Roundabout were like torrents, the rain was so intense for a short period. I’ve put together a series of radar images that show the evolution of the storm, together with graphs, that can be accessed here.
The hottest day was July 18th with 32.7C recorded. There were 12 occasions where the mercury reached or exceeded 80F – pretty respectable though last July saw that figure reached on 20 days!
The sunniest day was on the 3rd when 15 hours of sunshine were recorded. Throughout the month there were 11 days with 10 hours or more of sunshine. There were also 5 days with thunder recorded – the average for July is 3.
Looking further afield there were many thunderstorms around the UK though many places missed out on the big downpours. Perhaps the most impressive was the development of the MCS that moved up from France during the evening of July 18th. There were numerous superb pictures but my favourite is probably this shot taken by Richard Dixon in Whitstable, Kent. It shows, perfectly, the contrast betweeen the bright orange sunset and the impending doom of the approaching MCS from the continent.
This shot was taken by Richard Dixon in Whitstable, Kent. It shows, perfectly, the contrast betweeen the bright orange sunset and the impending doom of the approaching MCS from the continent
A thunderstorm on Sunday, July 20th, saw three inches of rain fall on Canvey Island in a very short space of time. A good round up of events, including pictures, can be seen here. The thunderstorm on 25th was felt across London and the Home Counties – there’s an excellent picture of the approaching shelf cloud here. Brighton was rudely awoken by a storm on 28th by a slow-moving thunderstorm.
It is a typical feature of summer that rainfall can vary a great deal across a small area. The nearest official station to Wanstead, St James’s Park 8.4 miles to our south-west, recorded recorded just 25.9mm – 35% of what fell here.
The nights were mostly warm – the 14.8C average is higher than last July.
Overall July was a superb summer month – sunshine, heat, thunderstorms in abundance.
Sunset on 31st looking across Wanstead Flats. July was a classic summer month for weather
I’ve decided to cobble together a few lines on last night’s notable thunderstorms which reminded me so much of the stormy nights on the 1980s.
The radar at 3am, produced by the excellent Home and Dry, revealed that the storm’s rainfall was quite widespread. The white areas show the most intense rainfall
After writing off the risk of storms for our area last night I was awoken at 3am by loud, rumbling thunder – the kind that seems to resonate all around you. A quick look on the radar revealed quite a widespread thunderstorm, quite different from the smaller, more intense one that woke up most of Wanstead on July 23rd last year.
On viewing the live lightning map at 3.10am it became clear that this was no flash in the pan. Further rumbles and strikes had me leaping out of bed to monitor the station. EssexWeather reported 1809 lightning strikes in two hours for our region.
And on viewing the pressure graph the first storm saw a 6mb fall in pressure in a matter of minutes.
A second storm around 5.30am was less severe though still notable. The 9.4mm that the weather station recorded fell at a rate of 45mm/hr at 3am and 40mm/hr at 5.15am. Though the AWS is often out in heavy rainfall situations on this occasion it was more or less spot on – my 10am reading of my traditional 5″ raingauge revealed the official total to be 9.3mm. The rain took the July total to 108% of the 1981-2010 mean.
And a squall that blew through just before 4am is well portrayed on this wind graph.
So, all in all, a really lively sticky night where the temperature didn’t fall below 18.2C. I didn’t manage to get any of my own pictures but this one by @justinstokes on Twitter caught my eye.
According to the CAPE / lifted index further storms seem likely tonight. Indeed the situation across the Channel could be dire. It is probable a few will trundle their way across the sea to give us another sleepless night…
This wind graph shows a gust of 22.8mph at 0336z in my sheltered gardenRadar at 0519 shows another white blob (very heavy rain) about to cross Wanstead
This pressure trace shows the fall in pressure of the two thunderstorms that crossed our regionLive lightning map from http://www.lightningmaps.org/realtime at 3.10am
St Swithun’s reputation as a weather saint is said to have arisen from the translation of his body from a lowly grave to its golden shrine within Winchester cathedral, having been delayed by incessant rain for 40 days
Legend has it that the weather on Monday will be the same for the next 40 days.
St Swithun’s day, if thou dost rain,
For forty days it will remain;
St Swithun’s day, if thou be fair,
For forty days ’twill rain na mair.
St Swithun’s Day is probably among the most well known of weather folklore – but, taken at face value, it is probably the most unreliable.
Since 1961 Wanstead has enjoyed 30 dry St Swithun’s Days (57%). From these the longest dry spell that followed was just 18 days, in 2000. On average, if St Swithun’s is dry, the weather stays fair for five days, with rain arriving on the 20th.
Another interesting observation is that the 40-day period that followed a dry St Swithun’s is on average 13% WETTER than if it rained on July 15th.
So what does this mean for the rest of July and the summer? Looking back at other years that have seen a mostly dry and warm pattern in the run up to St Swithun’s Day we should see a continuation of the mostly dry, warm and sunny conditions, perhaps with frequent thundery breakdowns, the first arriving on Thursday into Friday.
Putting superstition and singularities aside current weather models back this up.
St Swithun was born around 800AD and died on July 2, 862, at Winchester, Hampshire. According to historians he was fond of building churches in places where there were none. St Swithun, who was bishop of Winchester, was buried in the churchyard of the Old Minster at Winchester, where passers by might tread on his grave and where the rain from the eaves might fall on it.
His reputation as a weather saint is said to have arisen from the translation of his body from this lowly grave to its golden shrine within the cathedral, having been delayed by incessant rain for 40 days.
The basis of the St Swithun’s saying follows the fact that by July 15th summer weather patterns are already well established and tend to persist through the coming weeks.
In meterological terms the position of the frontal zone around the end of June to early July, indicated by the position of the jet stream, determines the general weather patterns (hot, cold, dry, wet) for the rest of the summer. Like a little stream in its bed, the frontal zone tends to ‘dig in’ shortly after the summer solstice.
As the path of our weather systems is controlled by the jet stream, a more southerly location of the frontal zone – as happened last year – is likely to bring unsettled, wet and cool weather. On the other hand, a frontal zone shifted further to the north – as is happening this year – will help the Azores high to build over western Europe, thus bringing dry and pleasant weather to the UK.
Other western European countries also have similar St Swithun’s day sayings – that follow the principle rule. In France they say ‘Quand il pleut a la Saint Gervais Il pleut quarante jours apres’ – If it rains on St. Gervais’ day (July 19th), it will rain for fourty days afterward.
In Germany the Siebenschlaefer or seven sleepers day (July 7th, after the Gregorian calendar) refers to the weather patterns of the following seven weeks.
June 2014 continued this year’s theme of being milder than normal; the mean temperature of 17.1C was 1C above average, making it the 22nd warmest June since 1797.
June was marked by some spectacular cloudscapes and sunsets. This was the view across Wanstead Flats from Centre Road looking toward Ilford on the 21st
June, like March and April, was dryer than average with just 15.2mm of rain, that’s just under 30 per cent of average.
The driest June since 2000 started off unsettled with frequent rain – 6mm falling on the 3rd. The following day was cool with the temperature reaching just 16.2C.
Though there were nine days when over 10 hours of sunshine was recorded the magic 80F was surpassed just once: on the 9th when 27.5C was reached under 6 hours of sunshine. This sunniest day was the 10th when 14 hours of sunshine nudged the thermometer to 24.5C. Overall there were 214.1 hours of sunshine – that’s 120% of average, the sunniest since 2011.
On many days during June, including the 30th shown here, the sky turned dark but just spits and spots of rain were often produced
Despite plenty of potential no incidents of thunder were recorded – the much-hyped weekend of the 7th / 8th saw less than 2mm of rain – all of the action staying well to our east in the France, Germany and the Low Countries. Further thundery potential on the 13th failed to produce anything in this area though a disturbance over Berkshire saw thunderstorms develop in the Oxford, Reading, Basingstoke and Wokingham region, with up to 38mm of rain falling over a wide area.
It is a typical feature of summer that rainfall can vary a great deal across a small area. The nearest official station to Wanstead, St James’s Park 8.4 miles to our south-west, recorded 33.8mm – more than double what fell here.
Some nights were chilly when the sky cleared but there was no air frost or ground frost.
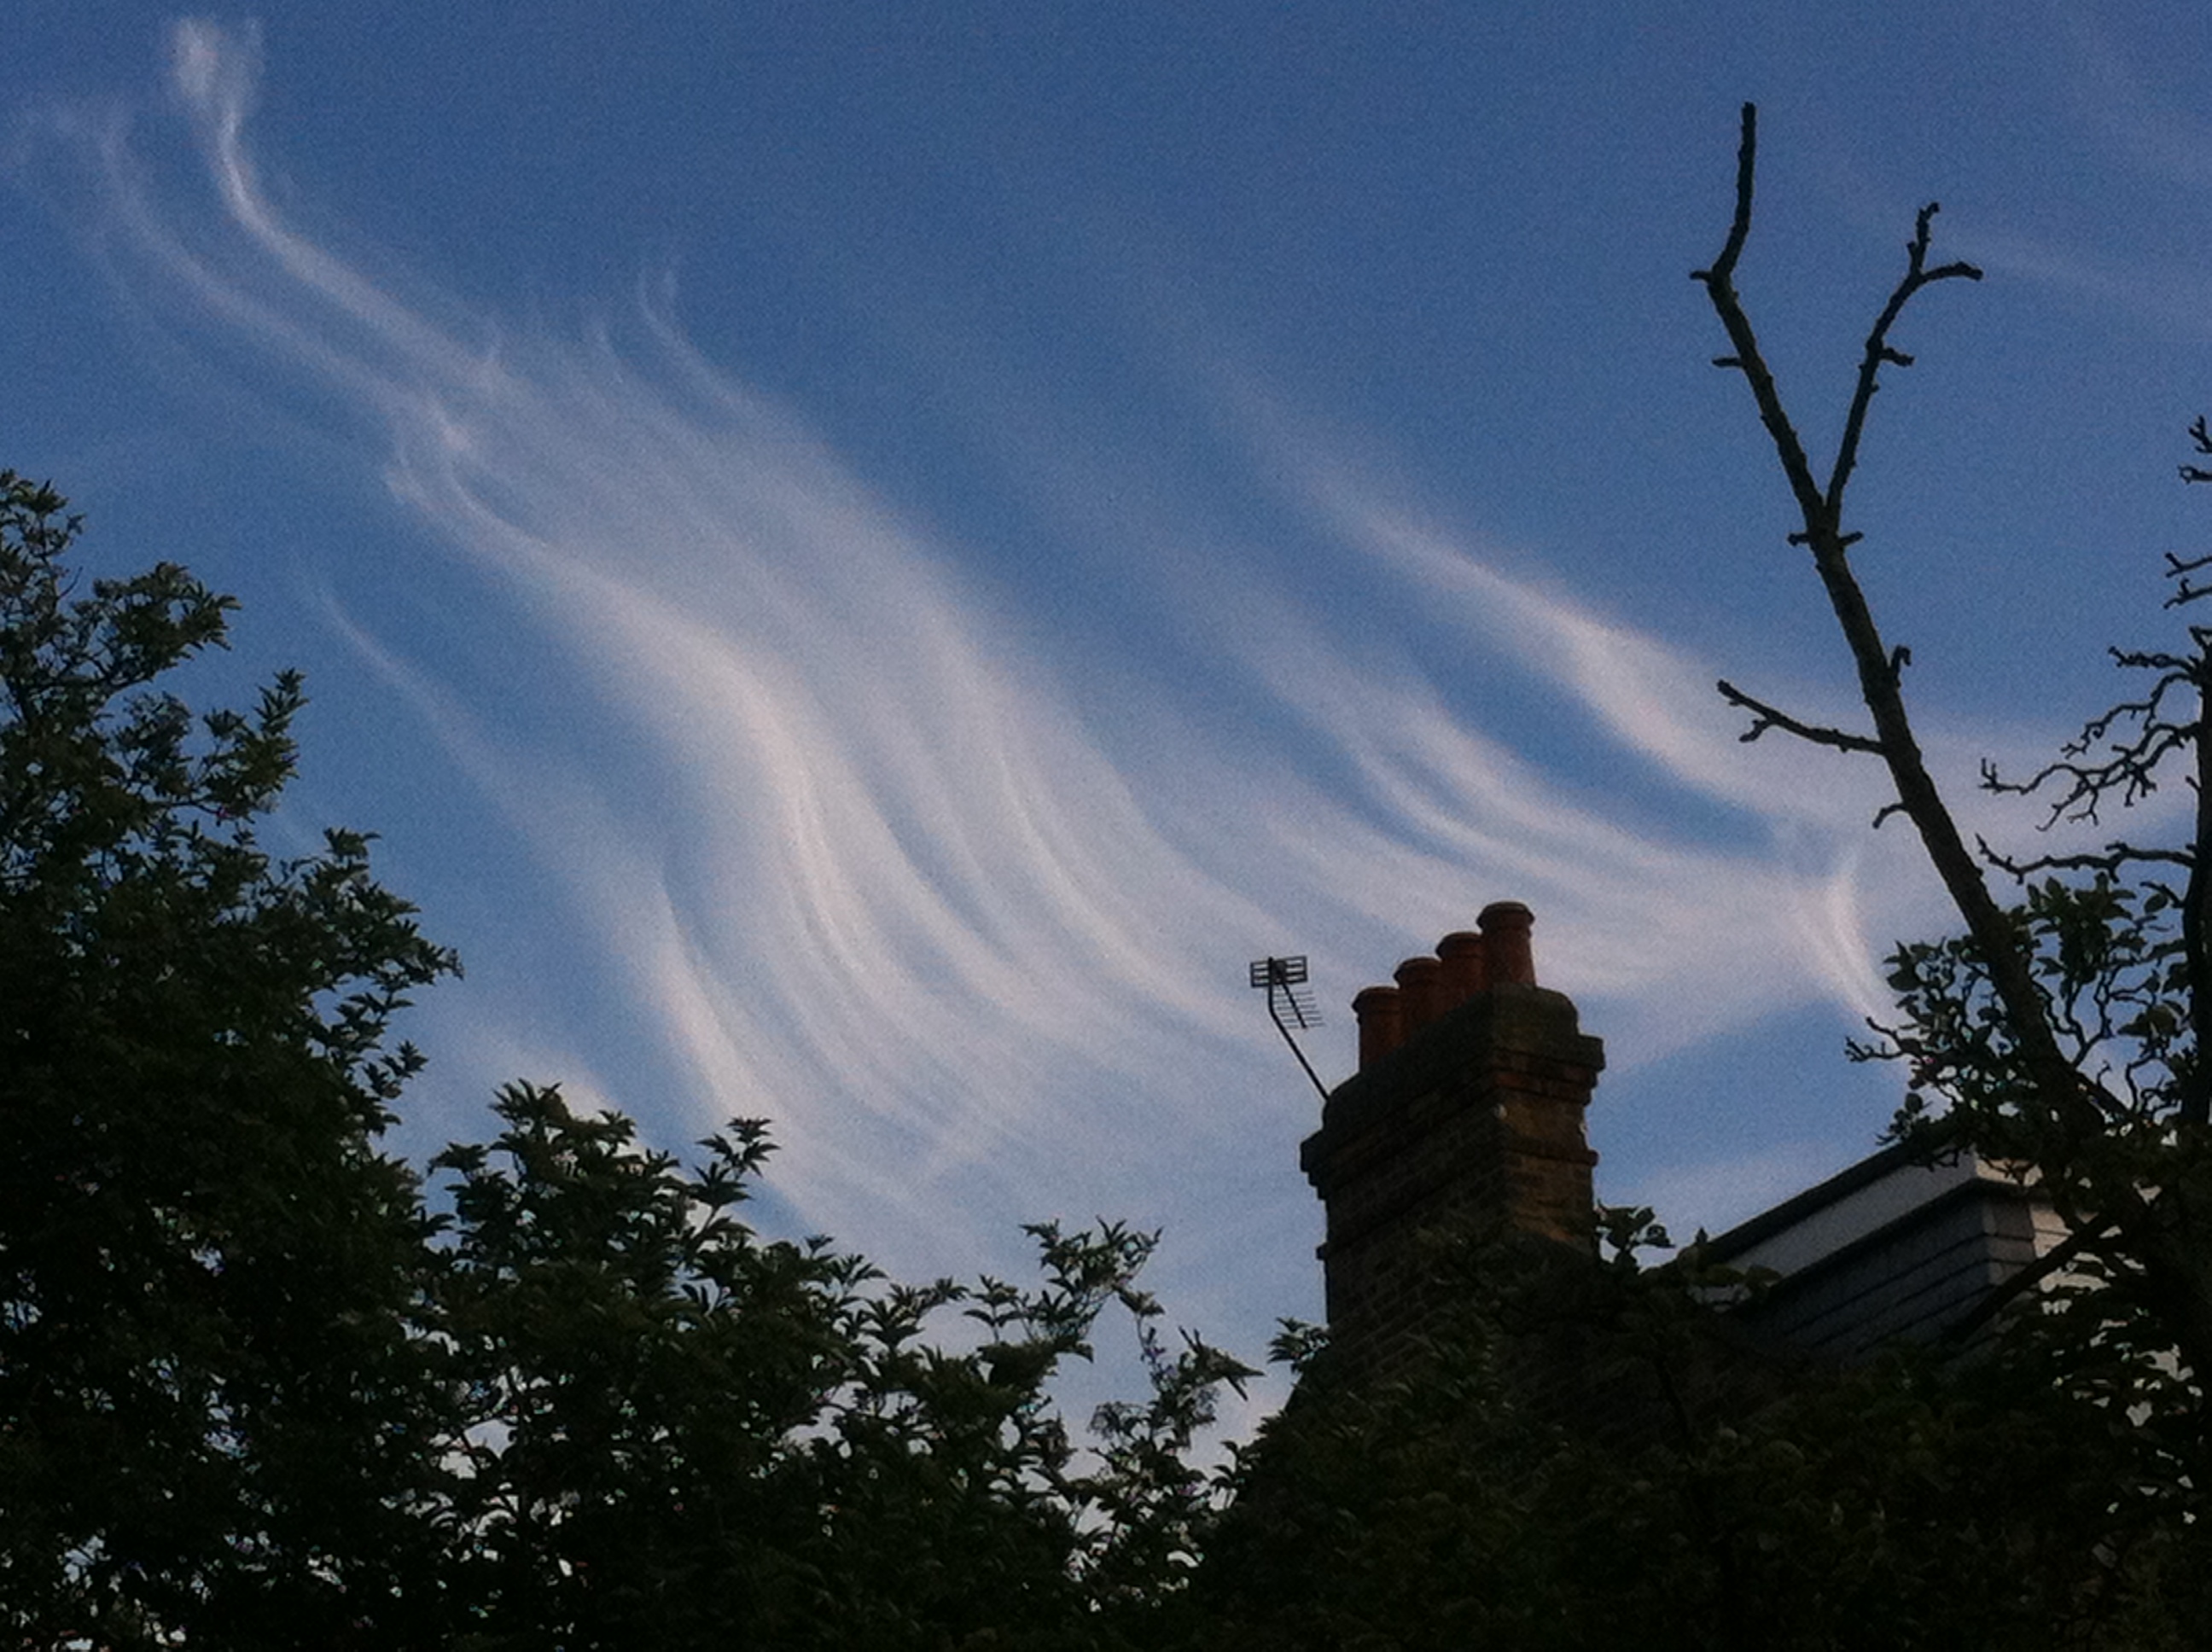
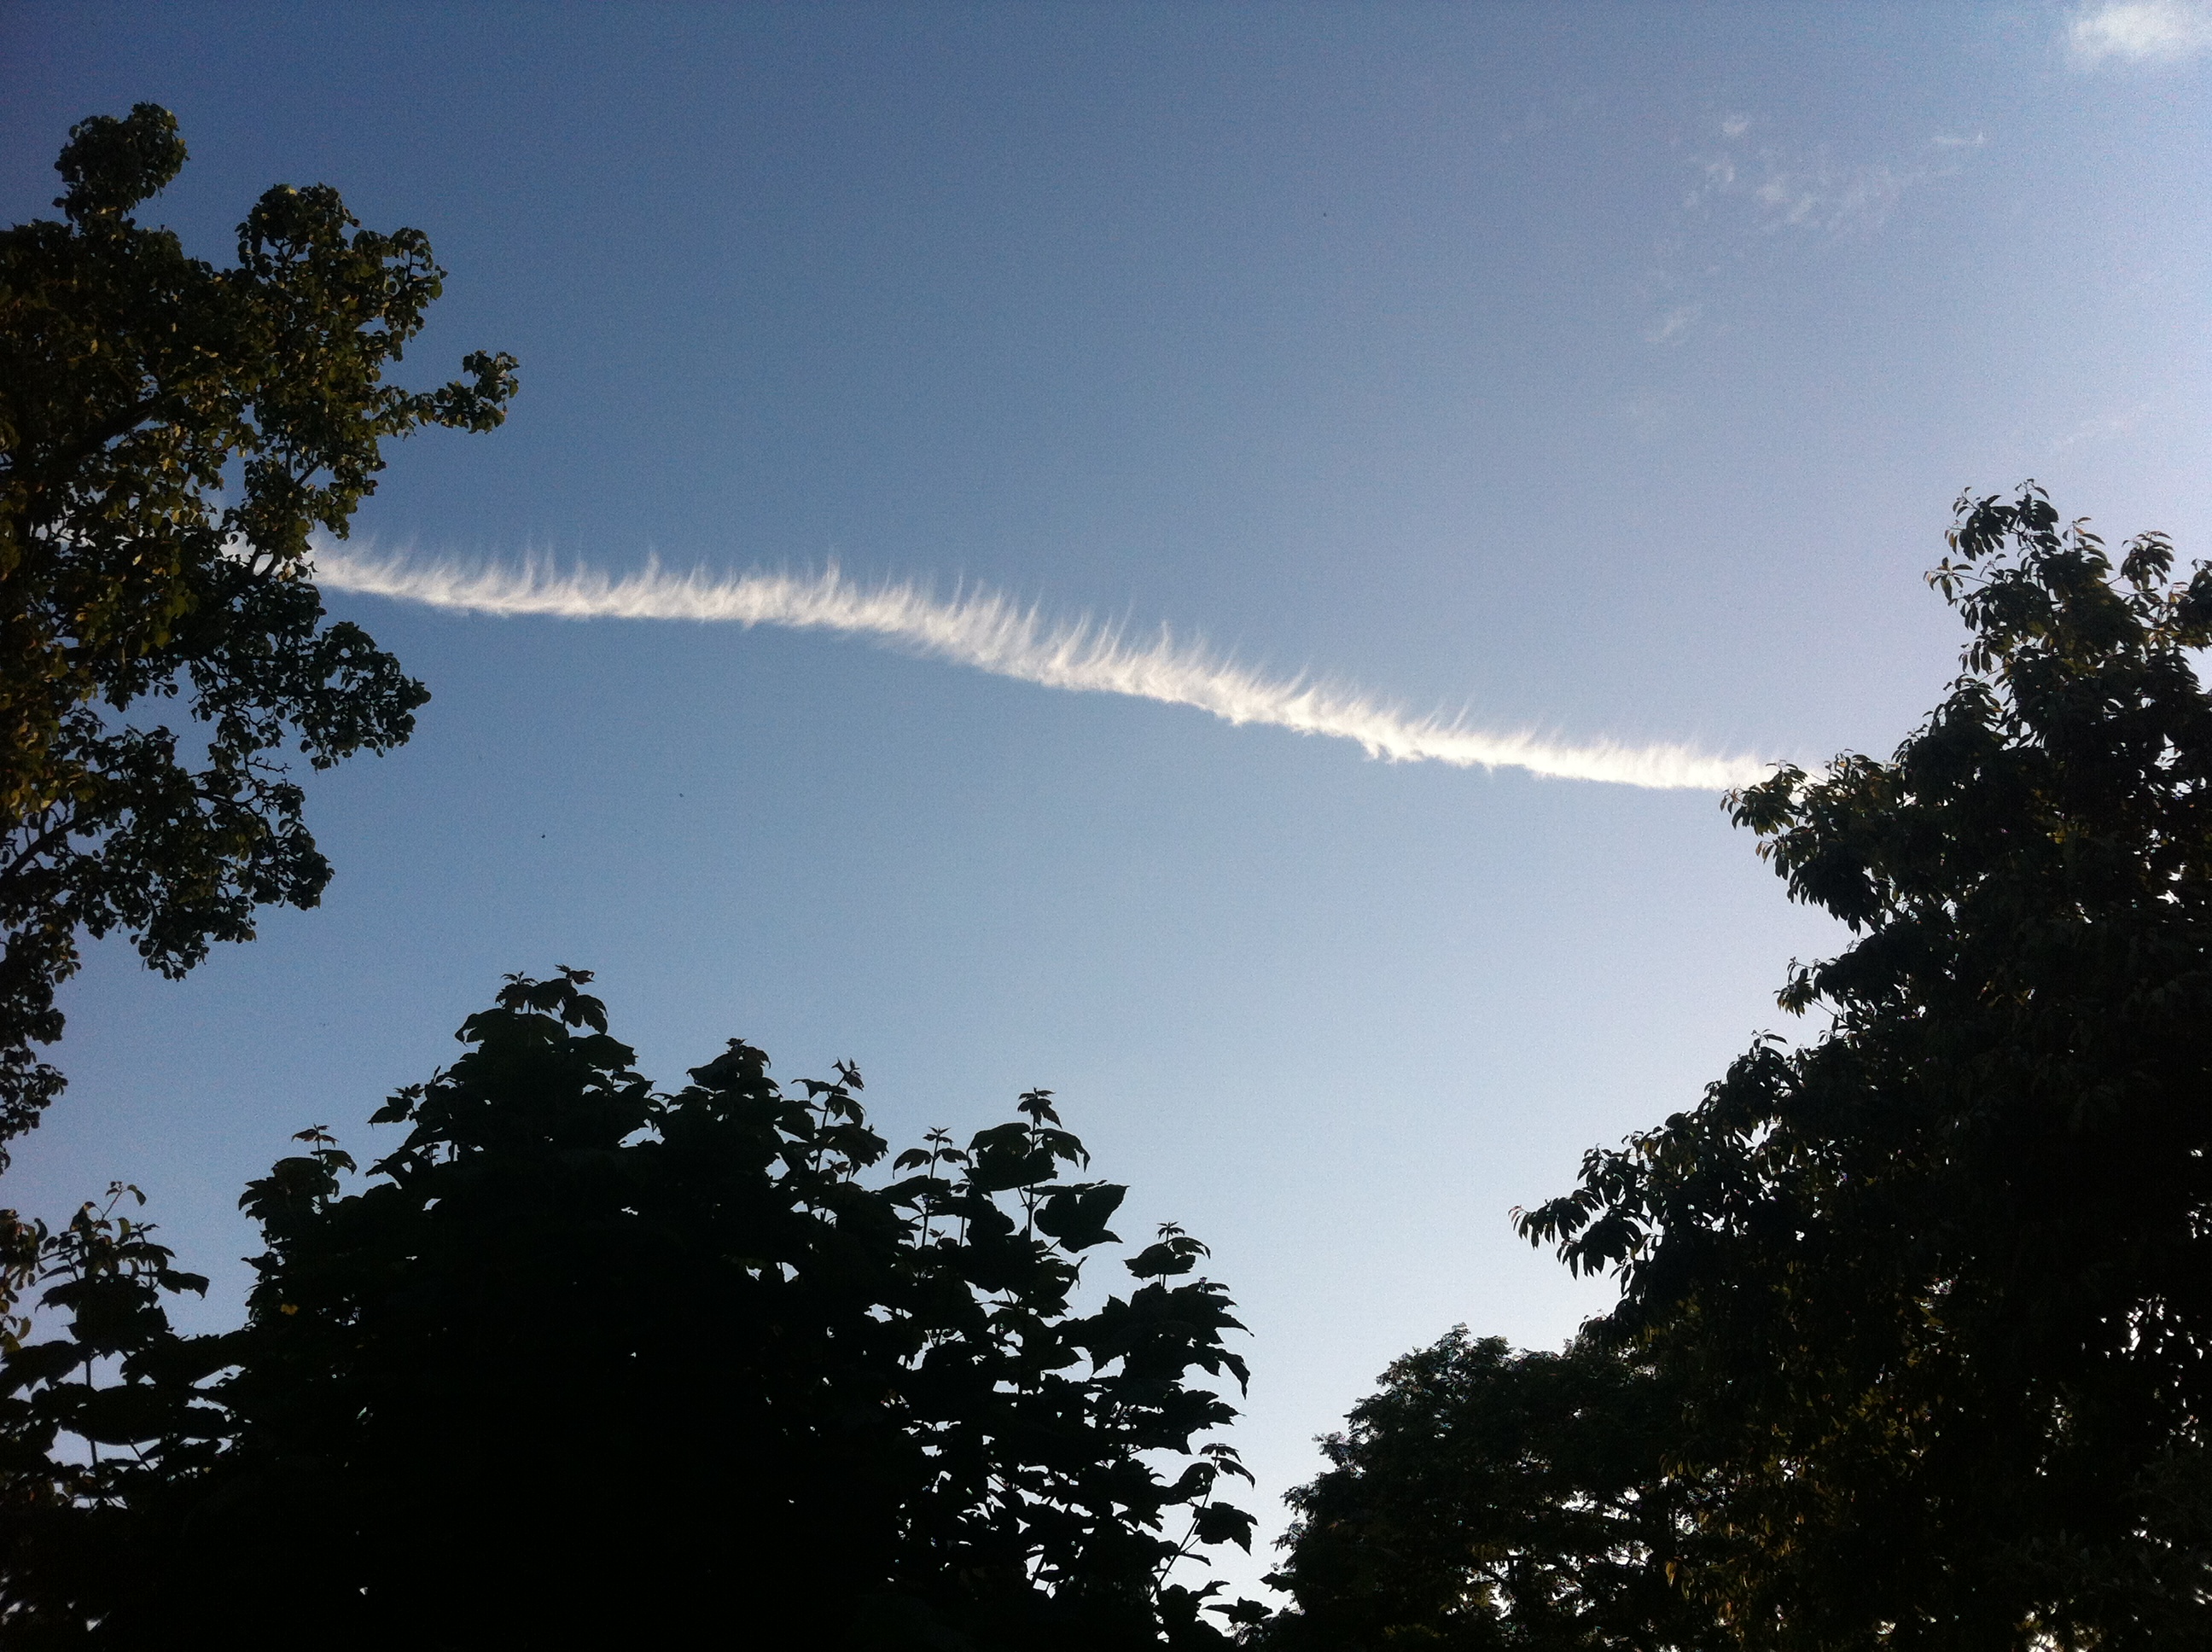
Yet another occasion of impressive cloud formation during June included this example of late evening cirrus. The formation, seen at ground level, seemed similar to a display of the AuroraCircumhorizontal arc over Aldersbrook
It was the summer when the ‘sea’ came to Redbridge. A record-breaking 59-hour deluge in the middle of June 1903 left vast swaths of the borough inundated. But this was no thundery downpour. All across London and the South East record rainfall rates and totals were set, many of which still stand well over a century later.
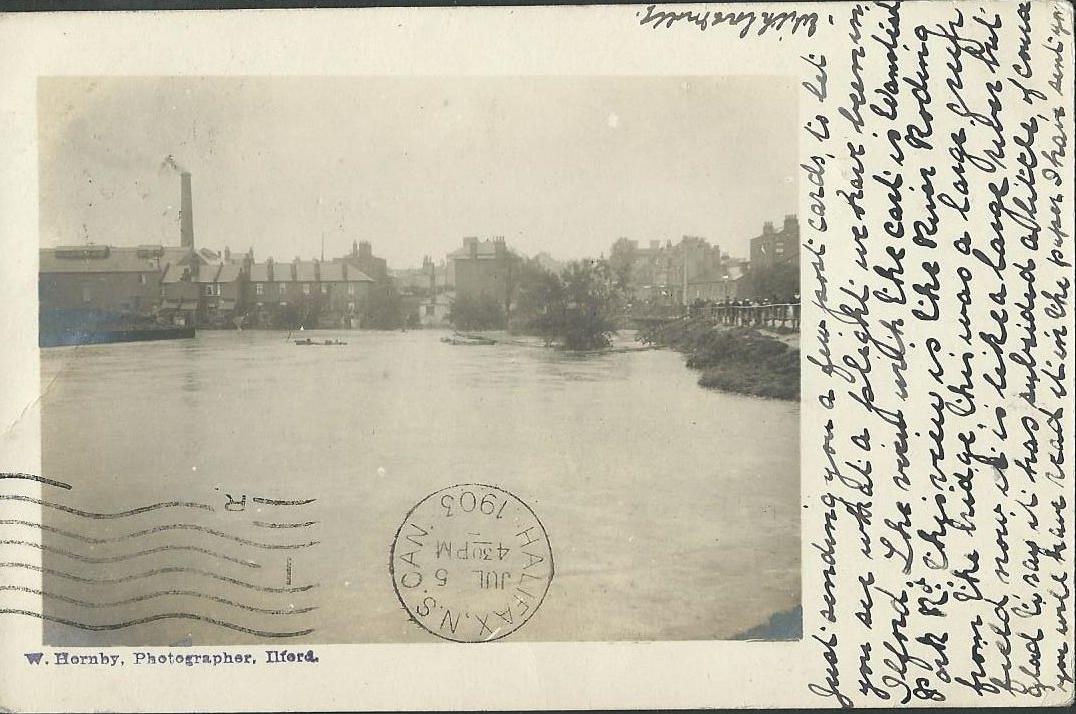
The author of this postcard wrote the following: “Just sending you a few postcards to let you see what a plight we have been in Ilford. This view is the River Roding from the bridge. This was a large green field now it is like a large river but glad to say it has subsided a little of course. You will have read it in the papers I have sent you.”Images of the flooding were captured by Watson Hornby, an amateur photographer and artist, who traded at 7 Cranbrook Road, Ilford. This terrace of houses in Wanstead Park Road, which backs on to the River Roding, were also flooded out. The postcard was written on July 1st, 1903
According to one local historian the fields between Wanstead Park and Ilford – as far as Uphall Road – were like an open sea and the railway track at Seven Kings resembled a shallow river.
After a dry start to the month June quickly went downhill with notable falls of rain during the second week. The main deluge arrived around noon on Saturday, June 13, and lasted until near midnight on the 15th.
The rain was caused by a depression that moved slowly across southern England, becoming stationary over the English Channel close to the Isle of Wight for 24 hours before moving north-east. It introduced a very cool NE’ly airflow – the temperature on the 14th and 15th failed to climb above 11C and on the 19th a high of just 9.2C was recorded as yet more rain fell.
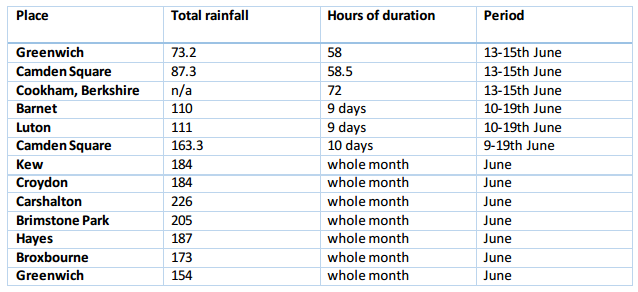
Across the London area there were five days within the period 10th to 19th June when over 25mm of rain was measured in many places. The deluge added to what became the wettest summer month on record. At the Royal Observatory, Greenwich, just over 154mm fell, three times the amount of what normally falls in June in this area. Further west, Kew Observatory recorded 184mm.
The June 1903 flood at Empress Avenue at the junction of Wanstead Park Road
The 1903 rains produced an unprecedented summer flood on the Thames. At Teddington 7335 million gallons (33,374 million litres) of water flowed over the weir on June 21st. Elsewhere the Lea Valley was one vast lake, especially around Enfield, with the Royal Gunpowder Factory inundated.
The Friday, June 19th edition of the Essex County Chronicle abounds with other tales of woe from the floods…
Barking and District: In the large area of low-lying ground between Lea Bridge, Ilford, Barking, and East Ham, houses stood in a great inland sea, which was washing over the garden fences and lapping at the lower windows. Upstairs the occupants could be seen moving about or gazing hopelessly out at the dreary waste of black waters. Boats from Barking Creek were rowing about with supplies of milk and bread, and those who wished were taken away. All along the Barking Road from East Ham scenes almost identical were witnessed, but, happily with the end of the rain, the water did not retain its level long. Past Barking and on to Rainham the roads on Tuesday were quite impassable, much of the heavy traffic which goes through Rainham towards Barking having to turn back.
The floodwaters between Wanstead Park and Ilford were described as a vast inland sea
Woodford and Wanstead: The inhabitants of Claybury Asylum and Woodford Bridge were cut off by 3ft of water from Woodford. The whole of the Roding Valley was in a deplorable state; sheds, trees and stock that was once alive floating in all directions. Wanstead was divided from Ilford by a great lake, but happily the total of loss in property was here very small.
Lea Bridge: The Leyton marshes were covered by one great sheet of water, Lea Bridge Road itself being quite 2ft under. Boats were to be seen plying among the tramcars.
Epping: The valleys were well-nigh impassable, especially at Thornwood and parts of Theydon Bois.
Romford: The floods reached to Romford High Street, and made the thoroughfare impassable for pedestrians. The crisis caused a heated exchange among members at a meeting of the Urban Council on Monday evening where it was agreed to allow the free use of the town fire engine for pumping water from ratepayers’ premises, provided that those who required its services paid for the labour. Cllr J. Bassett thought the residents should make their own arrangements for getting rid of the water. Cllr J.R Holliday replied: “You don’t live near the river. I should like to stick you in the middle of it. I think it is the duty of the council to protect property.”
Laindon: Here the height of the deluge was experienced between seven and eight o’clock on Sunday evening. The rain descended in apparent ropes of water, causing consternation, flooding houses, choking drains and water-troughing, cutting deep channels in roads, washing up plants and new potatoes. On Monday the water was between 3 and 4ft feet deep at Noak Hill and other bridges.
Woodford: An exciting scene took place at Woodford Bridge, where a steam circus, with its owners, was in the most precarious position. Men and women were submerged up to their armpits while extricating the caravans.
Away from the South East the weather was much dryer. Felixstowe and Yarmouth newspapers reported that Sunday had seen “delightfully sunny weather, with cool north-easterly breezes”. Lincoln, meanwhile, recorded less than an inch of rain for the whole month!
Could these rains happen again? Meteorologically, given the same synoptic set-up, it is possible. In terms of the June monthly total of rain we came close in 1997 when 133mm fell – though this was much more evenly spread throughout the month. And thanks to massive investment in local river systems since the 1950s the flooding nightmares brought by the Lea and Roding rivers should stay firmly in the past.
*You can see the full stats from Greenwich for June 1903 by clicking this link.
Considering we had no thunder to speak of and the threatened thunderstorms failed to materialise in this region we still saw some amazing skies at the weekend. Testament to the fact that the weather is never boring…
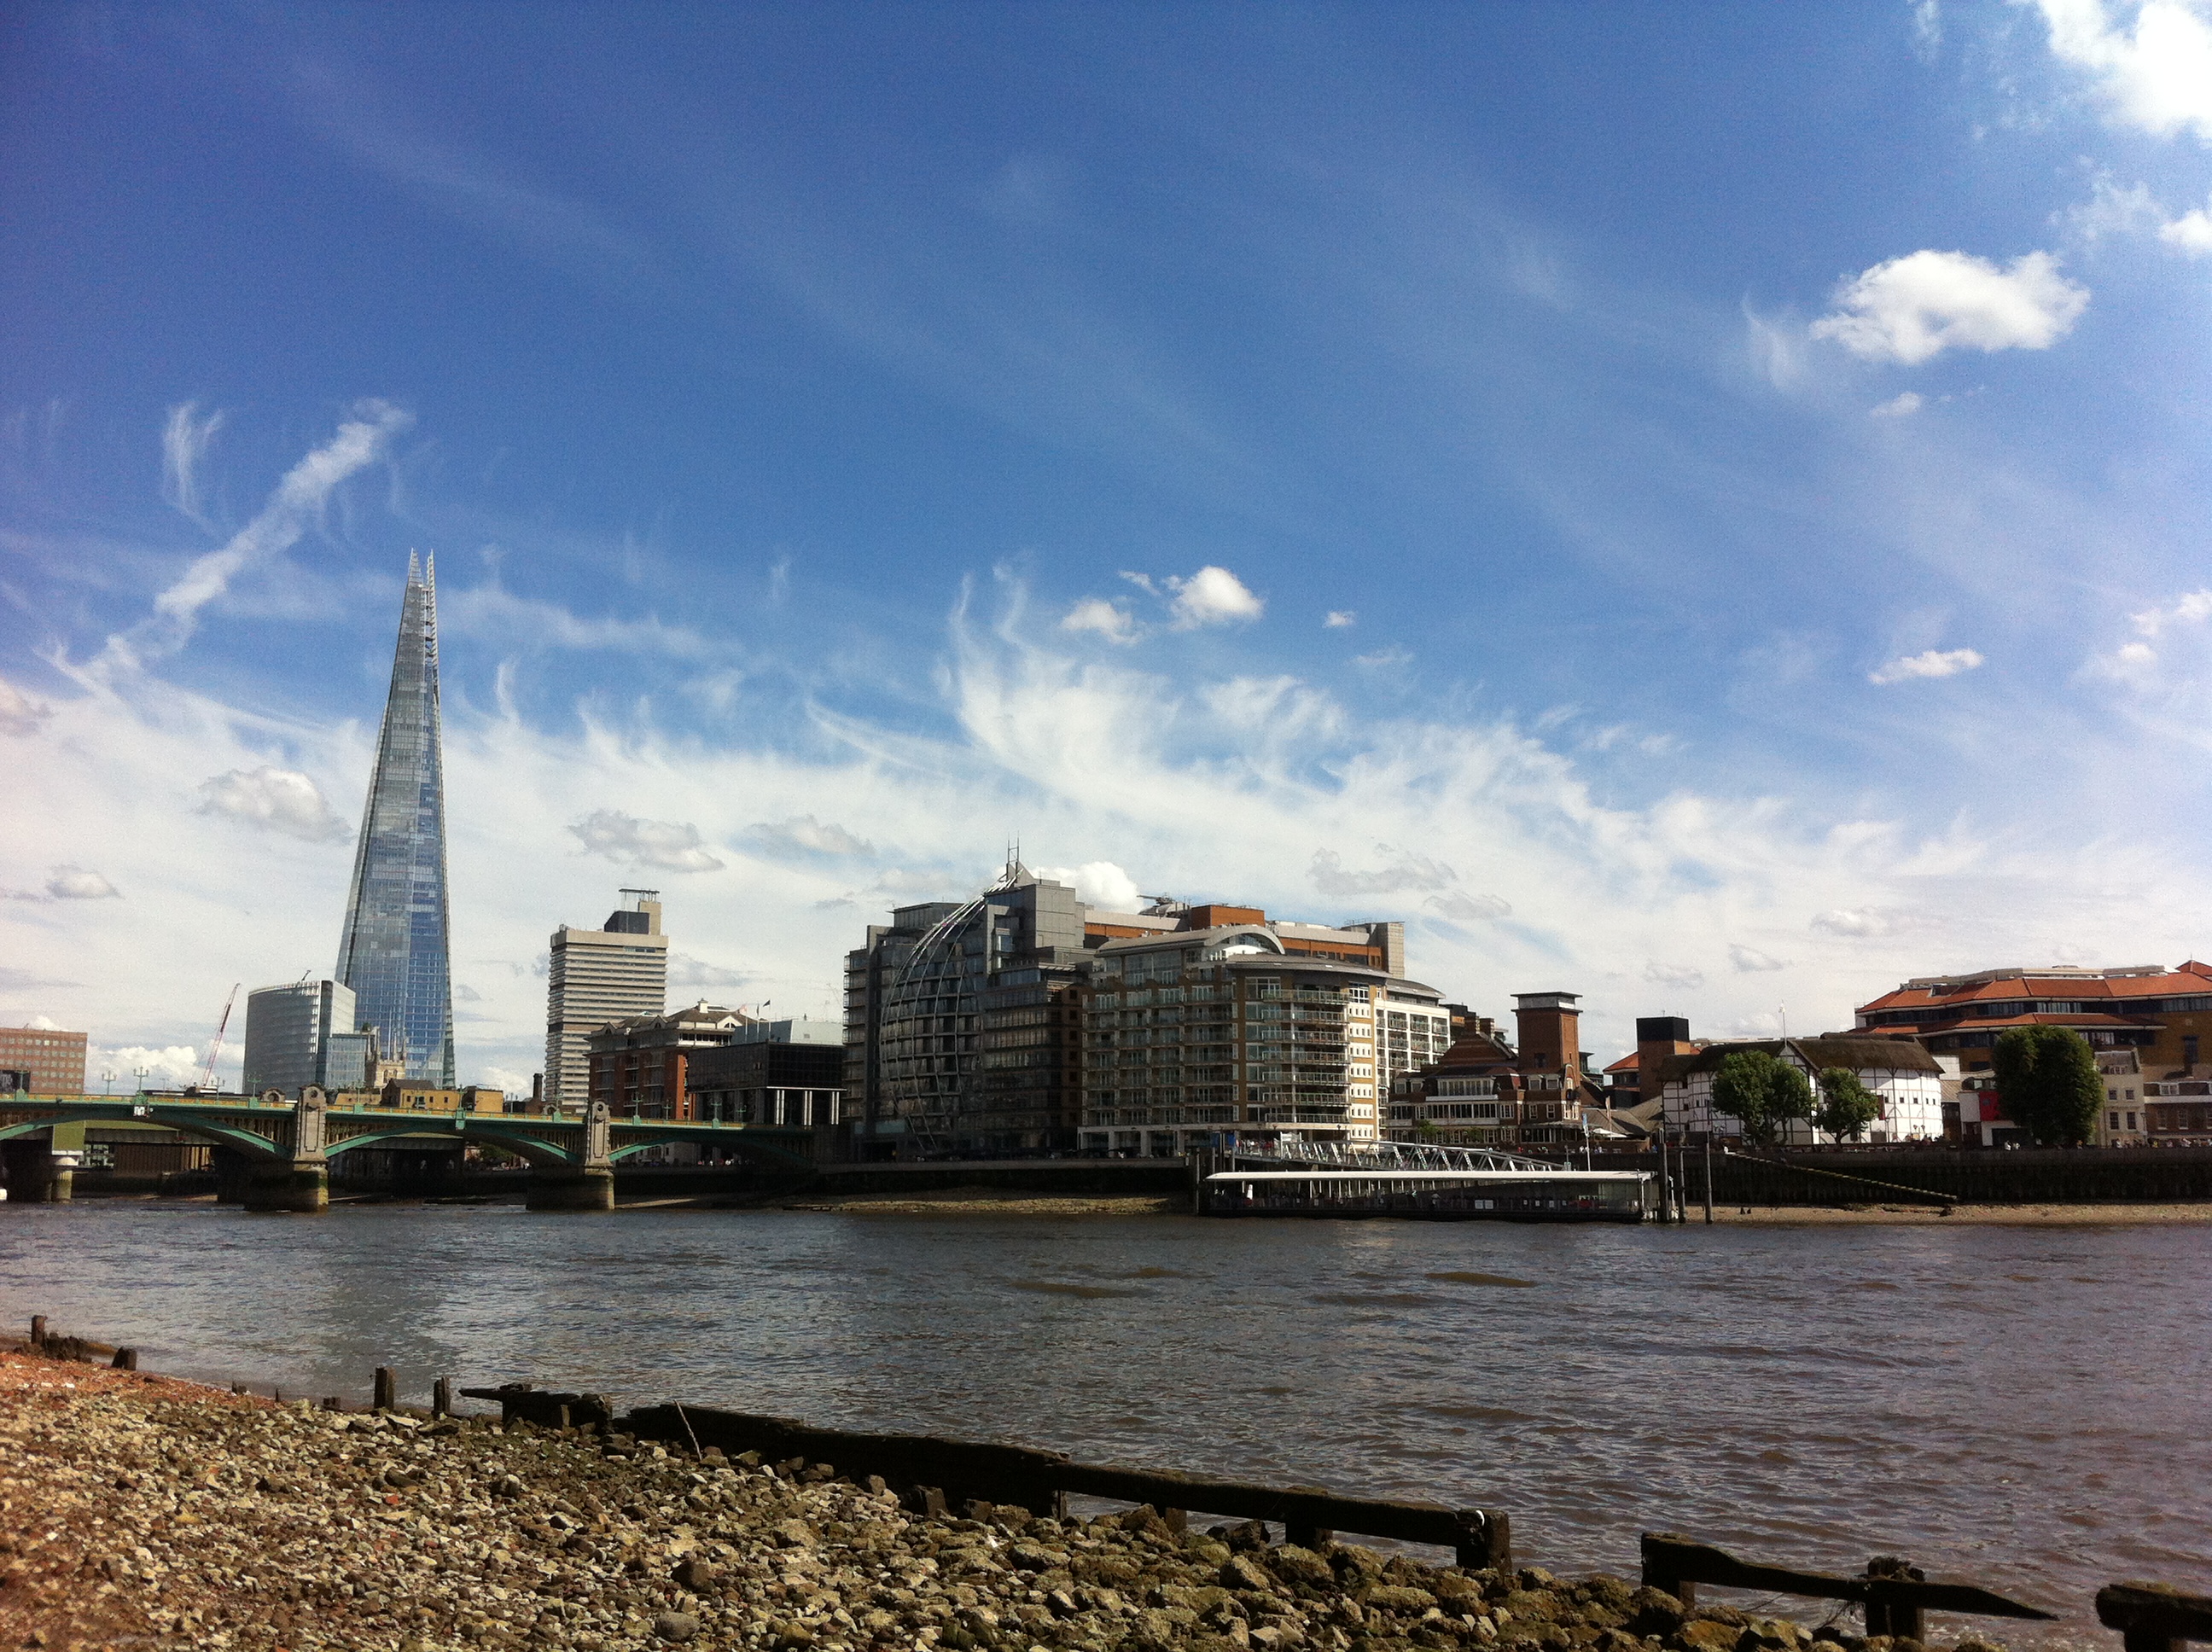
I took this yesterday evening. Windless, still and humid at ground level it was fascinating to look skyward and see the multi-level cloud continue to build into strange shapes, illuminated from below by the setting sun. A wonderful weekend for cloudspotting.Wanstead Flats looking westLittle Fluffy Clouds over Wanstead Flats. The contrast of the deep blue, white clouds and green grass never fails to disappoint as we approach the SolsticeA walk along the foreshore on the north bank of the Thames revealed this vista. The Shard looks very other worldly and looks like I’ve Photoshopped it in. Love it or hate it, the thing is there for good now…
Over the years significant weather events have, at least in my subconscience, at times signalled that something ‘big’ is about to happen – just one example being the Great Storm in October 1987 that was followed days later by the Black Monday stock market crash.
So an event that happened 100 years ago this month, to some, probably also brought a feeling of impending doom as the political situation in Europe became ever more fraught.
Account of the thunderstorm reported in The Times
A series of severe thunderstorms that broke out just after midday over south-west London on June 14, 1914, left people dead and a trail of destruction across areas south of the Thames. Fierce lightning, torrential rain, severe flooding and hail ‘the size of walnuts’ accompanied the storms. Six people were killed by lightning on Wandsworth Common and four others were injured. As with many thunderstorms the heaviest rain, 94mm in 3 hours at Richmond Park, was focused over a small area. South Kensington, just over 5 miles away, recorded just 6mm! I don’t have the figures for Wanstead but judging by the map published in the 1914 edition of British Rainfall it probable recorded even less than South Kensington.
Some reports by observers.
Dulwich: Violent hailstorms. Many hailstones were like acid tablets about one inch long, half an inch broad and over a quarter of an inch thick. A minute or two after these had fallen, a mist rose to a height of about 4ft above the ground.
Lewisham: A storm began at 12.24pm and came right overhead from the east with terrific flashes of lightning and loud thunder. At 12.31pm, rain fell with extraordinary fury; within 9 minutes 0.5 inches had fallen. The second storm came up just after 1pm, the lightning being even more severe. At 1.30pm, St Mark’s Church, and the Holy Cross were struck. A tree in Hither Green cemetery over 30ft high was splintered and two houses were struck at Catford. Another thunderstorm came up at 2.25pm with torrents of rain and hail as large as haricot beans fell for 5 minutes.
Rainfall in the London area – June 14, 1914 – shown in the publication British Rainfall
Richmond Park: Very severe storm passed over the house; an oak fence was struck by lightning in two places. Rainfall measurements were as follows: 1.80 inches in 45 minutes, 2.70 inches in 90 minutes, 3.2 inches in 2 hours, 3.60 inches in 2.5 hours, 3.70 inches in 2.75 hours.
Wimbledon Downs: There was a curious scene close to Kingston station, where the water was about 4ft feet deep at five o’clock and motor cars and omnibuses had to make a wide detour. The storm was especially severe in Wimbledon district, where, owing to the bursting of an overtaxed sewer, the District Railway line was submerged. At Tooting Junction station was a foot deep on the platform.
Judging by the 1881-1910 average 1914 was a warm year: the mean temperature of 10.7C was a full degree warmer than average. It was also 15 per cent wetter than average and the sun hours were nearly 108% of average. Of course by today’s standards (the 1981-2010 average) 1914 looks relatively cool as the average annual temperature has risen 1C in the past hundred years.
The weather on this day must have been synonimous with the deteriorating political situation in Europe: two weeks later Franz Ferdinand, Archduke of Austria, and his wife Sophie were assassinated in Sarajevo by a young Serbian nationalist Gavrilo Princip , the casus belli of the First World War.
What is fascinating is that a similar thunderstorm that left seven dead in Valentines Park, Ilford, 75 years ago this August, also happened about two weeks before Prime Minister Neville Chamberlain announced on September 3, 1939, that Britain was at war with Germany.
Ask a dozen people what they think is a heatwave in this country and you’ll probably get 12 different answers.
The view across to St Paul’s from Bankside at low tide.
The UK press is always keen to tell us that a ‘heatwave is on the way’ – even if it is March and the heatwave in question brings temperatures no greater than the high teens Celsius.
Although in the UK there is no official definition of a heatwave the World Meteorological Organization description is “when the daily maximum temperature on more than five consecutive days exceeds the average maximum temperature by 5 °C, the normal period being 1961-1990”. In other words that March heatwave would see the thermometer peak higher than 15.3C five days in a row. Pleasant enough – but no big deal.
The Met Office, working with the Department of Health, provides a ‘Heat-Health Watch System’ for England which is triggered when a threshold temperature in the South East is 31 °C by day and 16 °C overnight for at least two consecutive days.
I have vague memories of the weeks of sunshine in 1976 but the hot spells that stick in my mind the most are August 1990, when the UK temperature record was set in Cheltenham, Gloucestershire, and August 2003 when an 8-day hot spell saw the all-time UK temperature record broken when 38.5C was reached at Brogdale, near Faversham, Kent.
Last July, when compared with the previous summers, saw some of the best summer weather since 2006. But where does last year compare with the good summers of 2003, 1995, 1990 and 1976? I decided to have a look back at the daily records for this area which stretch back to 1959.
I have drawn up a list of all days back to 1959 that have an average mean daily temperature of 23.5C or higher. This shows that there has been 93 such days. However, to qualify for the Met Office’s Heat-Health Watch System – ie two days like this in a row the list narrows. To make my job easier, I have narrowed the list further to 3 consecutive days where the mean has been 23.5C or higher. Though I loathe really hot weather in my experience I can put up with it for a couple of days. It is only when it gets to the third day of hot, sleepless nights that it starts becoming unbearable.
In terms of intensity and hours of sunshine, 2003 comes out on top. Though many people will argue that 1976 is more impressive -that summer, which comes in second, only produced two spells that satisfy my criteria. The first heatwave saw temperatures soar above 31C for six consecutive days from June 23. The start of the second, on July 3, saw Bjorn Borg win the first of five Wimbledon mens’ titles as he prevailed over Ilie Nastase in 35C heat.
The summer of 1995, which saw my driest-ever August with just 0.7mm of rainfall all month, comes in 3rd, with six days of mean temperatures of 23.5C or higher.
Polo advert for the heatwave that coincided with the Queen Mother’s birthday in 1990
Looking at the data another way, ranking the average total daily mean temperature of each spell, sees 2003 again come out 1st, with August 1990 and July 1983, 2nd and 3rd. Looking back through history it is not really surprising that 2003 comes out on top. While it was hot in London the heatwave across the Channel contributed to the death of over 70,000 people throughout Europe, France being the most affected.
This weekend promises to be very warm and sunny but it will pale into insignificance compared with the hot spells of the past. The mean temperature on Saturday and Sunday is unlikely to exceed 17C.
At the beginning of May I had a look at the March and April stats to try to decipher what the coming summer would be like. The results still suggest that summer will be a mixed bag weather-wise with only brief hot spells interspersed with humid thundery breakdowns and cool, cloudy and showery regimes.
The third warmest March-April period since 1799 possibly prompted some weather ‘experts’ to claim that we’re heading for a hot summer. But converse to what the Daily Express told us in April I cannot see any signs of a ‘hottest summer ever’. And it should be remembered that this rag also warned us that the past winter would see ‘100 days of snow’. In the event I think 100 days of rain was probably more true, and I would like to point out at this juncture that my own winter forecast was hopelessly out, along with many others.
To reach my conclusion on this summer I have used pattern matching of meteorological data for March, April and May stretching back to 1799. The mild and dry weather of March and April has been tempered by the wet May. The mean for the spring season was 11.7C with 116.4mm of rain and 473 hours of sunshine. If you take into account all years that were within +/- 10 per cent of these figures you get the following table.
When considering the data I first extracted the number of similar years by rainfall. Of these I then discounted any that were not within + / 10 per cent of the spring 2014 mean temperature.
The ‘best fit’ years were revealed as 1811, 1828, 1871, 1882, 1912, 1945, 1959 and 1989. Using sun hours similarities this could be narrowed further to 1912, 1945, 1959 and 1989, however it should be noted that I don’t have sun hours data prior to 1881!
Or, expressed in probabilities, I concluded the following:
Summer probabilities
So from the above you could deduce that the next three months will be average to rather cool, with average to slightly below average rainfall. Sunshine below average.
Trying to predict details over the next 3 months is impossible, but looking at the ‘best fit’ years mentioned above a warm spell happened without fail between the dates June 18th – June 22nd. Other dates to bear in mind for possible fine spells are July 5th, July 12th-15th, July 22nd, August 4th and August 20th.
* Taking into account the fact that temperatures in London are up to 1C warmer than they were 100 years ago I have added 1C to mean temperatures before 1915.
** Obviously, in the event of a series of direct hits from thunderstorms, my rainfall estimate could be hopelessly short – a symptom of abundant solar energy at this time of year which creates a ‘noisy’ atmosphere compared with winter.
*** The 1981-2010 average mean for summer in this region is 17.6C, with 144.9mm of rain and 564 hours of sunshine















You must be logged in to post a comment.