
More than three weeks have now past since the polar vortex split on January 1st.
London’s weather has turned colder and there’s even been a (small) fall of snow but the negative anomalies recorded so far are less than those experienced during the ‘Beast from the East‘ events last March.
In the graph below I have plotted the mean anomalies since the day of the PV split against the mean anomalies recorded from the day of the PV split in February 2018.
The effect this year is much less pronouced so far: over the last 24 days the average mean anomaly has been -0.7C, compared with -2.1C last February/ March.

The NOAA anomaly map for the week of January 13th-19th shows much of NW Europe has experienced a positive anomaly with any serious cold restricted to Norway and Sweden and Greece.
It has been mentioned that the variables with this SSW are very similar to 2004. Using the anomalies generated after the 2004 event resulted in the graphic below.

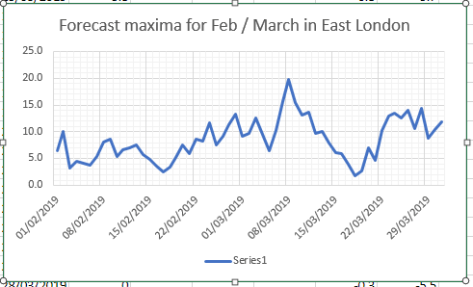
Taking it at face value would suggest that two more snow events could be possible at the beginning and middle of February – a cold but not severe pattern currently reflected in the models – but forget any repeat of last year’s Beast from the East.


You must be logged in to post a comment.