Ask a dozen people what they think is a heatwave in this country and you’ll probably get 12 different answers.
The view across to St Paul’s from Bankside at low tide.
The UK press is always keen to tell us that a ‘heatwave is on the way’ – even if it is March and the heatwave in question brings temperatures no greater than the high teens Celsius.
Although in the UK there is no official definition of a heatwave the World Meteorological Organization description is “when the daily maximum temperature on more than five consecutive days exceeds the average maximum temperature by 5 °C, the normal period being 1961-1990”. In other words that March heatwave would see the thermometer peak higher than 15.3C five days in a row. Pleasant enough – but no big deal.
The Met Office, working with the Department of Health, provides a ‘Heat-Health Watch System’ for England which is triggered when a threshold temperature in the South East is 31 °C by day and 16 °C overnight for at least two consecutive days.
I have vague memories of the weeks of sunshine in 1976 but the hot spells that stick in my mind the most are August 1990, when the UK temperature record was set in Cheltenham, Gloucestershire, and August 2003 when an 8-day hot spell saw the all-time UK temperature record broken when 38.5C was reached at Brogdale, near Faversham, Kent.
Last July, when compared with the previous summers, saw some of the best summer weather since 2006. But where does last year compare with the good summers of 2003, 1995, 1990 and 1976? I decided to have a look back at the daily records for this area which stretch back to 1959.
I have drawn up a list of all days back to 1959 that have an average mean daily temperature of 23.5C or higher. This shows that there has been 93 such days. However, to qualify for the Met Office’s Heat-Health Watch System – ie two days like this in a row the list narrows. To make my job easier, I have narrowed the list further to 3 consecutive days where the mean has been 23.5C or higher. Though I loathe really hot weather in my experience I can put up with it for a couple of days. It is only when it gets to the third day of hot, sleepless nights that it starts becoming unbearable.
In terms of intensity and hours of sunshine, 2003 comes out on top. Though many people will argue that 1976 is more impressive -that summer, which comes in second, only produced two spells that satisfy my criteria. The first heatwave saw temperatures soar above 31C for six consecutive days from June 23. The start of the second, on July 3, saw Bjorn Borg win the first of five Wimbledon mens’ titles as he prevailed over Ilie Nastase in 35C heat.
The summer of 1995, which saw my driest-ever August with just 0.7mm of rainfall all month, comes in 3rd, with six days of mean temperatures of 23.5C or higher.
Polo advert for the heatwave that coincided with the Queen Mother’s birthday in 1990
Looking at the data another way, ranking the average total daily mean temperature of each spell, sees 2003 again come out 1st, with August 1990 and July 1983, 2nd and 3rd. Looking back through history it is not really surprising that 2003 comes out on top. While it was hot in London the heatwave across the Channel contributed to the death of over 70,000 people throughout Europe, France being the most affected.
This weekend promises to be very warm and sunny but it will pale into insignificance compared with the hot spells of the past. The mean temperature on Saturday and Sunday is unlikely to exceed 17C.
Floods in Somerset have, up to now, seemed far removed from our own back yard. But with thousands of homes by the upper parts of the River Thames now at risk of flooding I wondered how safe we were from our own rivers.
A look back through the reference books show the geography of the Roding and Lea Valleys has made the area prone to inundations for hundreds of years.
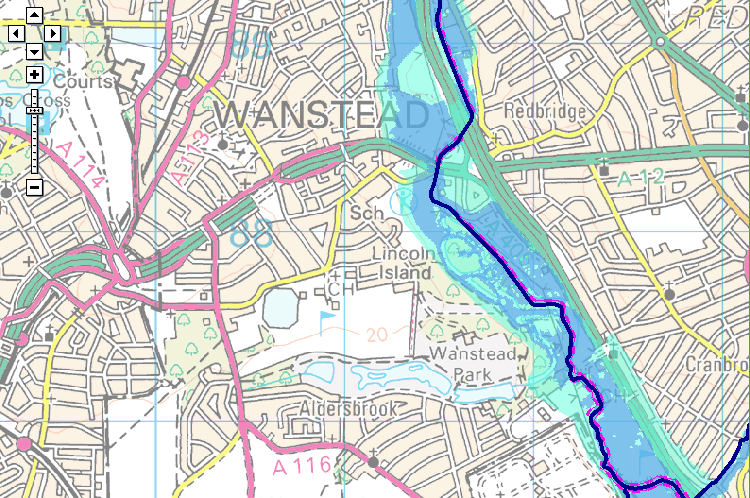
The Environment Agency’s Flood Map for Planning shows the flood zone risk of the area. And endorses Howard’s account that the river Lea was ‘a mile wide’ at its peak
In January 1809 the lower River Lea burst its banks in several places following a deluge that dumped two inches of rain in the space of 24 hours. The rain abruptly ended a snowy cold spell that had begun over a month before in the middle of December. From Luke Howard’s readings it is likely that up to half a metre of snow had fallen in the previous weeks in the upper parts of the surrounding countryside with only slight thawing. With the frozen ground unable to absorb any of the rapidly melting snow and rainfall the amount of water flowing downstream must have been immense. Howard takes up the story…
“The River Lea continued rising the whole of the 26th… The various channels by which it intersects this part of the country were united in one current above a mile in width which flowed with great impetuosity and did much damage.”
Howard, his chemical factory located on the banks of the river Lea close to what is now Bow flyover, wrote at length about the event, his account replacing the usual brief notes about daily weather in his book The Climate of London.
He talks of embanked pasture land being “filled to the depth of eight or nine feet” and people driven to their upper rooms relieved by boats plying under the windows.
The Environment Agency’s Flood Plan map of the Thames illustrates Howard’s comment that “the Thames was so full during this time that no tide was perceptible”
“The Thames was so full during this time that no tide was perceptible.” It took until February 23rd for things to return to normal.
Miraculously no lives were lost in the flood and cattle “by great exertions” were saved by being kept in their stalls. Howard, saying that the flood could have been far worse, believed a neap tide, strong westerly winds urging water down the Thames and mild weather helped avert a tragedy.
Howard’s statistics of the previous months show that the second half of 1808 were wetter than average – though not especially so. And nothing like the rainfall we have had this winter. From December 1st until February 8th Howard recorded 130mm of rain, which is about 100mm less than what I have recorded this winter.
This fact alone shows just how much the nature of the river has changed in the last 200-odd years thanks to spending on flood defences.
Work to improve the defences was prompted 67 years ago when similar catastrophic flooding came with the thaw that ended the severe winter of 1947, one of the coldest winters in recorded history and an episode remarkably similar to what Howard recorded in 1809.
Flood risk areas around the River Roding close to Wanstead are much smaller than the equivalent area in Lea Valley
The Lea Valley, along with many parts of the country, saw some of its worst flooding in a generation. The river burst its banks at several points bringing misery to surrounding communities. Valleys turned into lakes in 40 counties and East Anglia’s fens were a sandbagged inland sea. More than 100,000 properties were damaged and, then as now, heroic battles were fought by the military to keep water-pumping plants and power stations dry.
The sense of crisis was felt worldwide. Canada sent food parcels to stricken villages in Suffolk; the prime minister of Ontario even offered to help dish them out.
A marker of that flood, together with a history of flood defences, can be found here. There is also British Pathe footage of another flood between 1910 and 1919 here .
The River Lea Flood Relief Channel, that flows between Ware, Herts, and Stratford, took almost three decades to complete. The channel incorporates existing watercourses, lakes and new channels. Since it was completed in 1976, there have been no major flood events in the Lea Valley, although there have been three occasions when the river system was full virtually to its capacity: in 1987, 1993 and 2000. Since its completion, the level of protection afforded by the structure has declined, so that in some areas it offers 2 per cent protection, and in some, only 5 per cent protection. The Environment Agency published a strategic environmental assessment in 2008, which looked at ways to maintain the flood defences in the Lea Valley.
The water table appears to have come to the surface on Wanstead Flats
It remains to be seen whether we will see any flooding in Redbridge – a further 40mm of rain is forecast to fall up to Saturday morning. As well as the problem of rain there is also the issue of the water table which in the past week has risen to the surface in places. Inland lakes forming on Wanstead Flats have seen the cancellation of football fixtures and a couple of people I’ve spoken to say standing water has started to appear in their cellars
It is all too easy to blame the Environment Agency for the current flooding in Somerset and elsewhere but the meticulous planning by its forerunners brought, at least to date, an end to the widespread flooding problem in the Lea Valley.
As the government struggles to find a solution to the current problems with flooding it would do well to look to the grand schemes of the past and forget about any planned cuts to flood defences.
With flooding in the Somerset Levels dominating the headlines it is easy to get carried away with media hysteria that we are in unprecedented times in terms of rainfall. But as with so many media stories these days you don’t have to look far back in meteorological records to find that we’ve been here before.
The jetstream has been virtually ever present over the UK this winter, driving depression after depression over our isles
Although I base this blog on local figures – two series of stats going back to 1881 and 1959 – it is notable that this particular microclimate has actually been dryer than neighbouring areas, including east Essex where the rain crossing this area often peters out. With such power in the jet stream, however, bands of rain have been pushing right through this winter. Surrey has also been notably wetter, with orographic uplift only partly responsible for the increased wetness. Anyone driving around the M25 will have noticed the flooded fields at the side of the motorway.
It has been mentioned that this winter has been the most cyclonic in recent memory, but you only have to go back to the winter of 2000-01 to find a more cyclonic winter, though that season saw fewer severe gales.
Since the beginning of the meteorological winter on December 1st Wanstead has recorded 235.6mm of rain to February 6th. Considering the 1959 series that’s 7% wetter than the winter of 1989/90 – though this winter is actually 0.9C colder than that season 24 years ago.
Looking at the bigger picture, and with 22 days to go, this winter is currently 7th wettest in the series going back to 1881 – quite a way behind 1915 which saw 343.7mm recorded. Looking at the GFS model out to 9 days, however, there is much more rain to come.
The season so far, in terms of temperature and rainfall, has been notable in that autumn did not really offer any hints as to how winter would unfold. At the beginning of December I would have put the probability of a winter such as we have had so far at 10%. Should the rain continue to fall while the temperature stays mild the probability would fall to 1% – a truly exceptional winter in the same league as 1962/63 – but at the other end of the scale.
After my less than impressive stab at a winter forecast I am a bit loathe to make any more predictions. Trying to predict the weather more than a few days ahead with any detail is impossible. And seasonal forecasting is fraught with difficulty. However, precedent suggests we could be in for a warm and settled March. Indeed, if this year is anything like what followed in 1990 we could be in for a very nice summer. But then again we might not. As Mark Twain said: ‘Climate is what we expect; weather is what we get’.
For anyone who likes cold weather it has been a dreadful winter so far with no snow falling or lying in this part of Britain.
An inversion during the first half of December saw the edges of ponds in Wanstead Park begin to ice up
A very mobile synoptic regime has seen numerous vigorous depressions blowing in off the Atlantic bringing flooding misery for many as swollen rivers burst their banks.
The predominantly maritime air over us has meant that even air frosts have been few and far between.
Since December 1st, Wanstead has recorded just 7 air frosts – half the number of last year. The coldest night was just -2.9C , warmer than the -6.9C recorded by this point last January.
The current mean temperature this winter to January 14th is 6.6C with rainfall 133mm – statistics that are remarkably similar to the winter of 1985/86 (mean 6.8C rainfall 130mm). That December and January was followed by a very cold February – the 4th coldest in a series stretching back to 1881.
However, before any coldies reading this get excited it should be noted that this season is also remarkably similar to winter 1989/90 (mean 6.8C, rainfall 128mm), which was followed by more stormy weather, including the Burns’ Day Storm, and the warmest February on record in this region.
Further scrutiny of stats for the Wanstead area reveal other years were similar. Using my method for finding patterns stretching back over 50 years to forecast this winter I picked out years that were +/- 10% of the mean. From these I then weeded out the seasons where the rain was +/- 10% of the 2013/14 rainfall total. This gave a list of five other winters with similar temperature and rainfall. Leaving aside 1985/86 and 1989/90 the other winters weren’t anything special with ‘snow lying’ days below the median for this area of six.
As I write this there are tentative signs on the weather models that a Scandinavian high may begin to form next week, introducing colder air from the east – exactly what we need to precipitate snow. However, they are just tentative signs and the cold air may never reach this far west anyway. Bear in mind also just how strong the influence from the Atlantic has been so far this winter. The Met Office have said the storms have been the worst in 20 years – which takes us back to the year in the above table of 1993/94. The only snow lying in that DJF season occurred in a short cold snap around February 15th – though, admittedly, an impressive fall of snow happened the previous November.
So, in summary, the probability at this point of at least one fall of snow before the end of February could be put at 75%. No snow: 25%. Abundant snow: 25%.
Damaging gusts associated with the depression on December 23rd felled this tree by the war memorial in Wanstead High Street
While compiling the figures I found that for my winter forecast to be correct would need a second half to winter exactly the same as 1985/86.
Some comparisons have been made between this winter and the balmy winter of 1988/89 – though that winter, the second warmest in the 1960-2014 series up to this halfway point, was a full degree warmer than this season and much drier, with only 30.9mm falling in over 6 weeks.
The culprit of the dry weather of that season 24 years ago was the influence of a very strong European high pressure which ‘blocked’ weather fronts from reaching this part of the UK, sending a conveyor belt of depressions skirting over Scotland bringing incessant rain instead of snow to Cairngorm resorts.
The nature of the weather this time round has been very different. Though December started with a strong anticyclone over Europe fronts associated with very deep depressions off the Atlantic have made inroads deep into the continent.
A classic Genoa low brought over 2 metres of snow above about 1,000m on Christmas day to resorts on the south side of the Alps. The nature of the airflow subsequent to that, however has brought some very high temperatures for the year.
Scottish and continental European winter sports enthusiasts will remember the season of 1988/89 well for all the wrong reasons, with little snow falling before March. I can vividly remember some amazingly cheap skiing holidays advertised on Teletext in January 1990. One deal was a week to Andorra for £19, including flights, transfers and half board in a 3-star hotel. A few of the lads in my A-level economics class took full advantage – only to return with tales about snowless mountains, sprained knees and wrecked skis, though it’s not clear how much of an influence the duty-free booze had.
Although many resorts were already investing in artificial snowmaking it was this season that quickened the pace of investment in snow cannons.
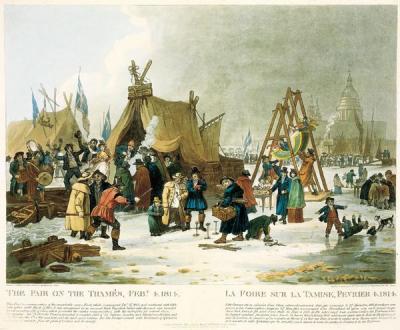
The Frost Fair of 1814 on the River Thames in London. Painting by Luke Clenell, entitled The Fair on the Thames, February 4th 1814
It is 200 years ago this month that London enjoyed its last frost fair.
Weeks of hard frost from the day after Boxing Day was enough to freeze the river between the old London Bridge and Blackfriars, enabling dozens of opportunist London traders to set up stalls and booths selling souvenirs, drinks and food.
Unlicensed gambling, drinking and dancing was the order of the day for those brave enough to venture on to the ice. A sheep was roasted on the ice with the public charged to look at it, and charged again for a slice of “Lapland mutton”. At one point an elephant was led across the ice at Blackfriars.
The ice was however, not very stable. Boatmen deprived of an income charged visitors a penny to cross planks to get on to the ice. They were on hand to rescue two women who fell through, although a plumber carrying lead was not so lucky.
Though changes to the flow of the Thames has vastly reduced any chance of a frost fair being repeated I’ve often wondered what the day to day climate would have to be like to freeze the Thames as it did in 1814.
Luke Howard’s Climate of London provided a starting point. His pioneering measurements of the atmosphere taken outside his laboratory by the River Lea in Stratford, though not as accurate as today’s readings, provide an excellent insight into just how cold the season was.
This line chart shows that the winters of 1813/14 and 1962/63 bore some resemblance
I was surprised to find that the stats compare well with the winter of 1962/63 – the coldest winter in recent memory. Obviously Howard’s readings would not have been as accurate as today’s – his thermometers were initially suspended in a laurel bush to shield solar radiation – but they would still have been close.
I have converted his readings in Fahrenheit to Celsius and plotted them on a spreadsheet here. As well as records of temperature, wind, rain and moon phase Howard also included any notable weather events in his diaries from both home and abroad.
The winter of 1813/14 started mild. On December 16th he noted that “bees quit the hive in unusual numbers for the season”. During the following days up to Christmas Day wind and rain alternated with misty, occasionally frosty, mornings – probably not unlike some of the weather we experienced last month.
However, Boxing Day brought a big change: “Since the 26th we have had a succession of thick fogs with a calm air or at most a breeze from the NE. Yesterday the air cleared a little and today has been fine; a display of cirrus clouds with much red in the morning and evening sky, the peculiar smell of electricity has been perceptible of late when the air cleared up at sunset.” Howard goes on to report that there was an eruption of Mt Vesuvius in Italy.
The beginning of January saw the mists thicken into heavy freezing fogs: “The mists which have again prevailed for several days and which have rendered travelling dangerous.”
The view across to St Paul’s from Bankside at low tide. Images of what it looked like this month in 1814 can be seen on the Corporation of London’s website
In those days, with cloud identification in its infancy, Howard identified the fog as stratus and noted with wonder the formation of rime frost on everyday objects: “The air has been in effect loaded with particles of freezing water such as in a higher region would have produced snow. These attached themselves to all objects crystallizing in the most regular and beautiful manner. A blade of grass was thus converted into a pretty thick stalagmite some of the shrubs covered with spreading tufts of crystals looked as if they were in blossom while others more firmly incrusted might have passed for gigantic specimens of white coral.”
By January 5th a “deep snow brought by an easterly wind had reduced the whole scenery to the more ordinary appearances of our winter”. More snow followed on the 6th and piled into drifts on a strengthening NE’ly. The biting gusts presented Howard with yet another new winter phenomenon: snow rollers: “With the temperature at the surface 33 or 34F presented an amusing phenomenon which was pointed out by my children. Instead of driving loose before the wind it was collected occasionally into a ball which rolled on, increasing till its weight stopped it. Thousands of these were to be seen lying in the fields some of them several inches in diameter”.
On the 9th Howard describes a misty morning and a snowy landscape that had a “bluish tint”. The “blueness” of the air is possibly down to the sheer cold – it was -13.3C that morning. I’ve seen something similar, a bluish hue to the air, on very cold mornings in the Alps. Howard notes that the minimum on the surface of the snow that night, the coldest of that winter, was -14.4C.
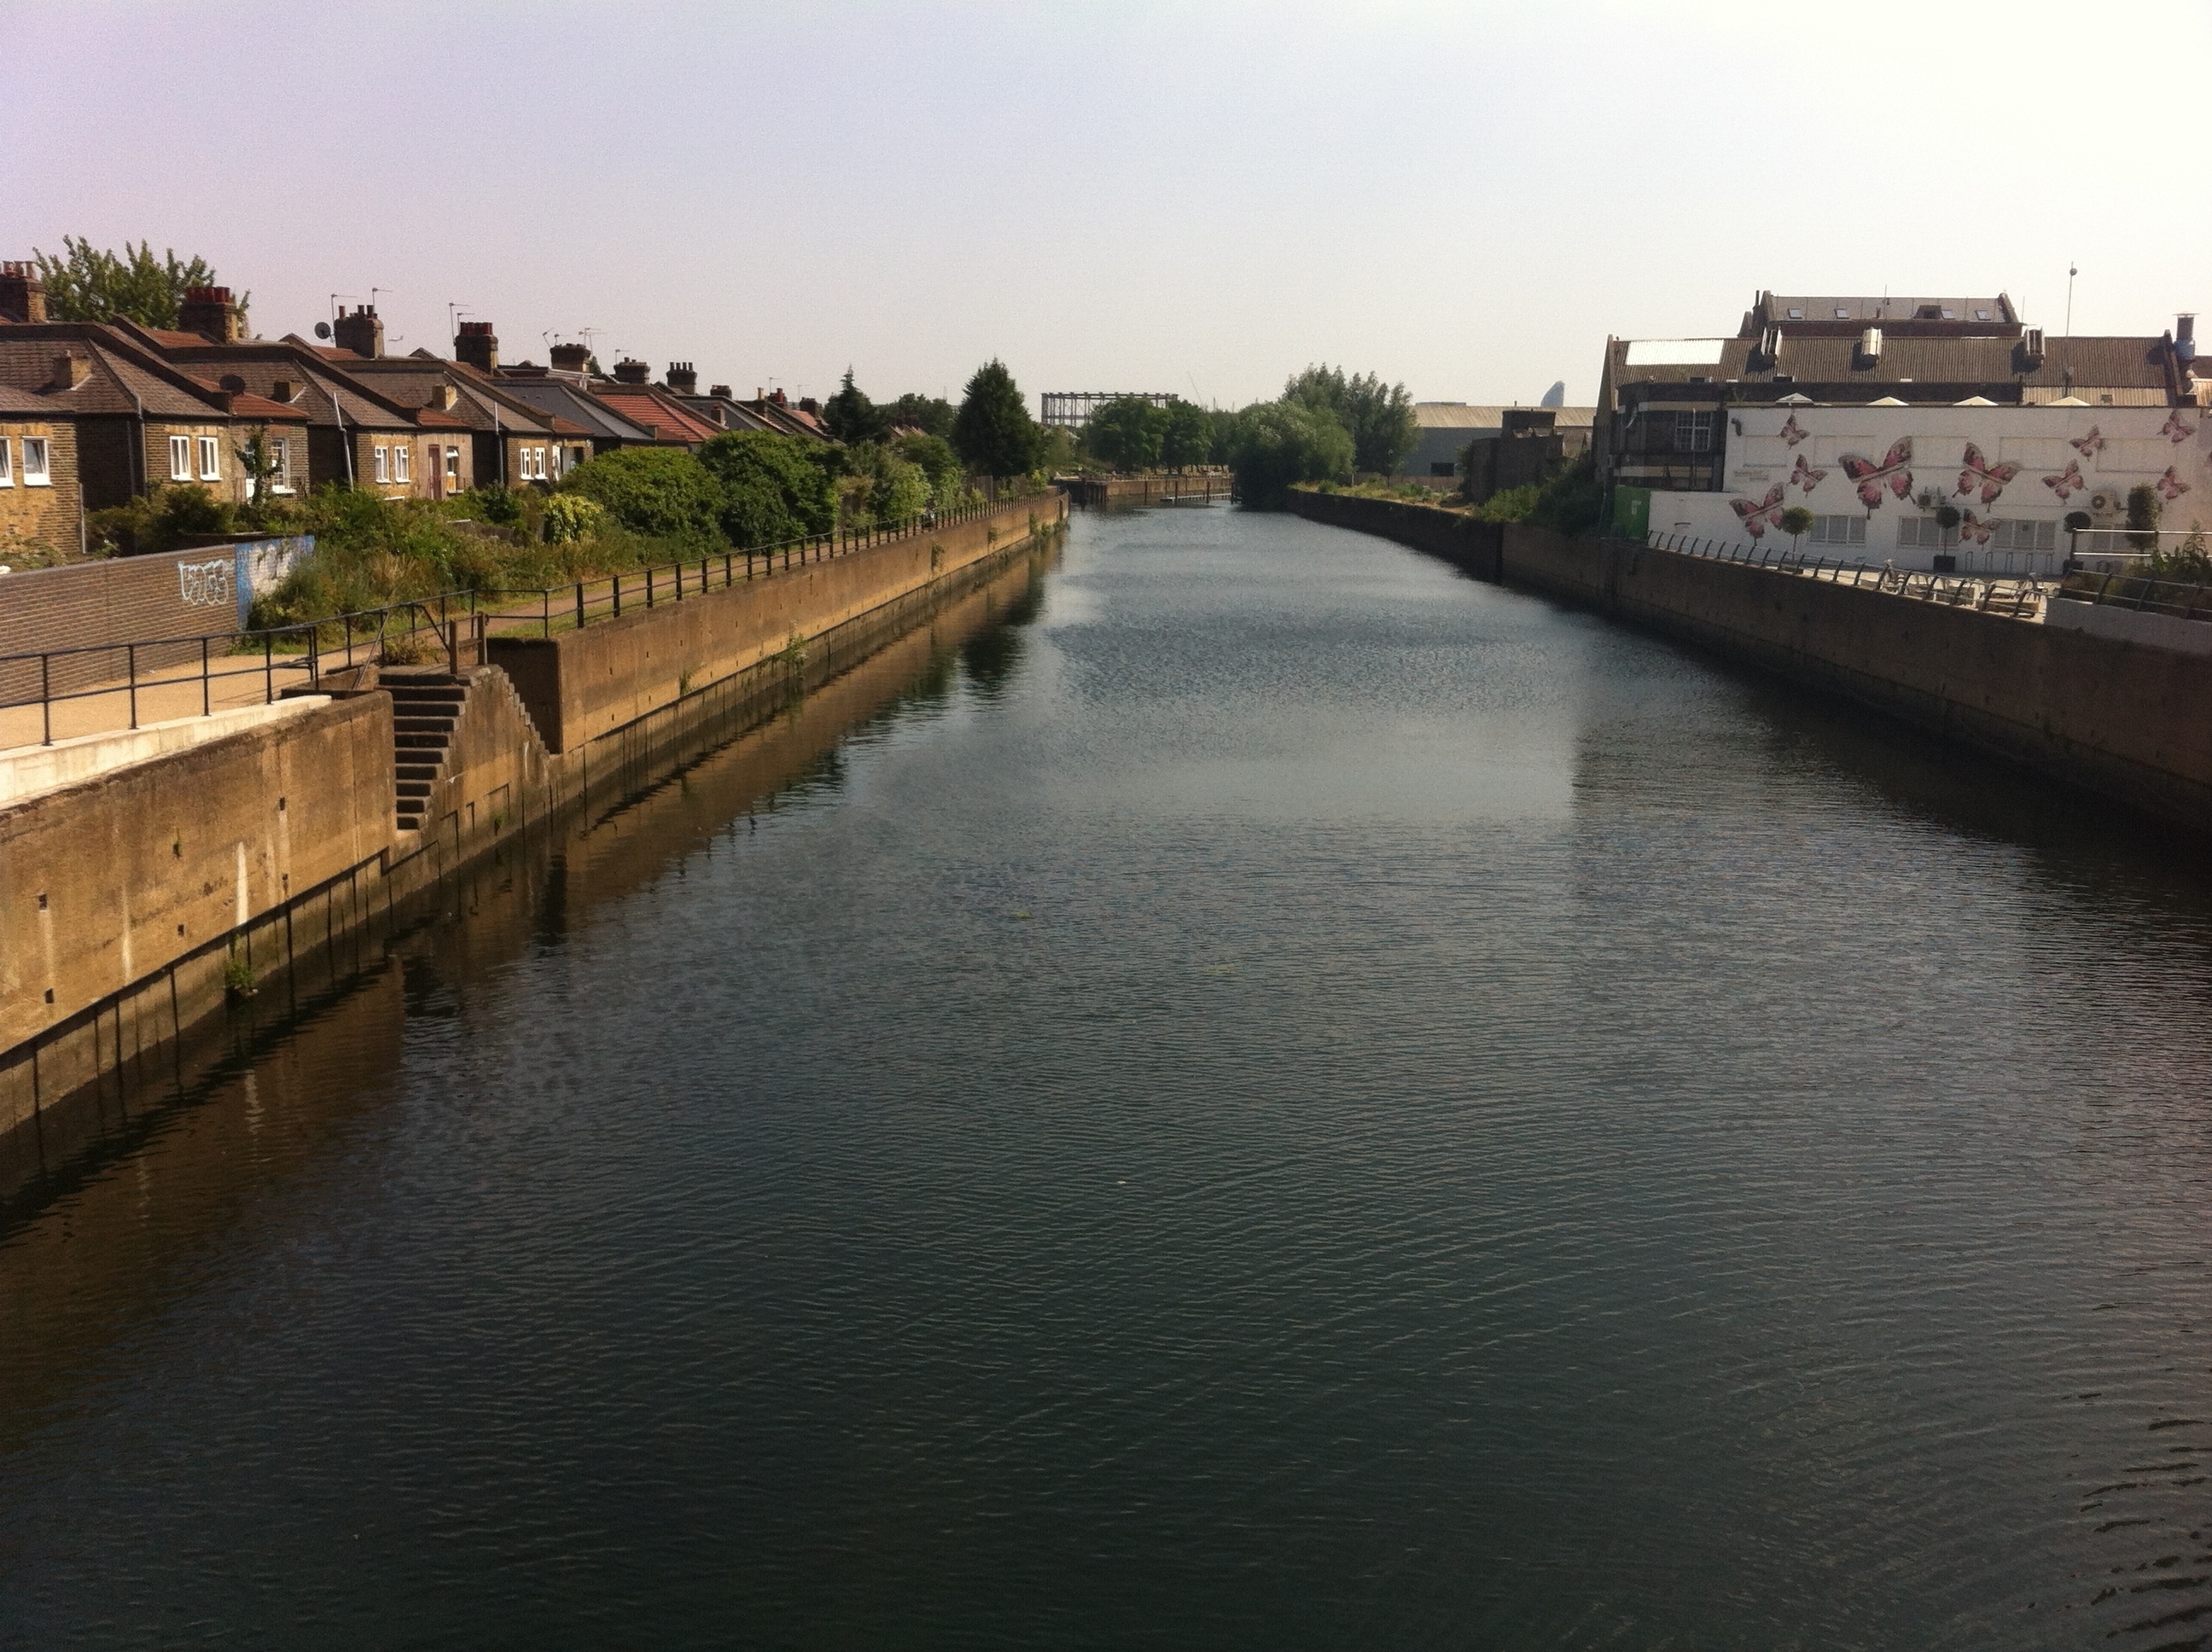
The River Lea close to where Luke Howard’s laboratory stood
On the 11th a “very red” sunrise was observed . By the 12th Howard describes the Arctic scene from his laboratory: “The River Lea is now firmly frozen and the Thames so much encumbered with ice that navigation is scarcely practicable.” Howard also notes on this date that the snow in upper parts of Hampshire and “on the Hind Head” had fallen to a depth of 15 feet in places.
A slight thaw was noted on the 16th from the warmth of the earth. More snow fell on the 18th and 19th. Snow on the 20th was accompanied by a strong NE’ly. On the morning of the 21st Howard noted drifts “many feet deep”.
The 22nd to the 25th saw more outbreaks of snow before the wind swung into the SW on the 26th with snow followed by rain – the cold spell was beginning to lose its grip. Howard notes on the 29th: As the barometer began to rise the wind came round by SW to NW and blew with great violence till near morning”. Classic freeze/thaw conditions followed over the next few days before the real thaw, and the end of the frost fair, arrived on February 5th. Howard notes: “Crimson sky at sunrise hollow wind snow and sleet. 6th A gale from SW with showers of rain at evening.”
The rest of February, and meteorological winter, appears fairly nondescript. Howard notes that on the 12th a gunpowder explosion resulting in a fire at the Custom House, 5 miles south, caused a “shower of fragments of burnt paper”. Sharp frosts and misty mornings prevailed to end of month, Howard noting the “clear orange twilights”, probably caused by the eruptions in Italy that formed a new crater on Vesuvius. Howard mentions a letter he received from Heligoland on February 21 which had also seen intense frost that was preceded by thick fogs and heavy falls of snow. The latter was 10 and 12 feet deep – the frost lasting six weeks.
Howard wrote his own account of the frost fair…
“The Thames Frozen Over
January 15: The masses of ice and snow had accumulated in such quantities at London Bridge on the upper side yesterday that it was utterly impossible for barges or boats to pass up. During the whole of this week that part of the Thames below Windsor Bridge called Mill River has been frozen over and has been crowded with persons skaiting.
February 3: The confidence of the public in the safety of the passage over the frozen surface of the Thames was yesterday increased. All the avenues from Cheapside to the different stairs on the banks of the river were distinguished by large chalked boards announcing A safe footway over the River to Bankside and in consequence thousands of individuals were induced to go and witness so novel a spectacle and many hundreds had what we cannot help terming the fool hardiness to venture on the fragile plain and walk not alone over but from London to Blackfriars Bridge. Several booths formed of blankets and sail cloths and ornamented with streamers and various signs were also erected in the very centre of the river where the visitors could be accommodated with various luxuries. In one of the booths the entertaining spectacle of a sheep roasting was exhibited
February 7: Friday several printers brought presses and pulled off various impressions which they sold for a trifle eg Printed to commemorate a remarkably severe frost which commenced December 27, 1813, accompanied by an unusual thick fog that continued eight days and was succeeded by a tremendous fall of snow which prevented all communication with the Northern and Western Roads for several days. The Thames presented a complete field of ice between London and Blackfriars Bridges on Monday the 31st of January, 1814. A Fair is this day February 4, 1814, held and the whole space between the two Bridges covered with spectators. This field of ice was indeed a very rugged one consisting of 1 masses of drift ice of all shapes and sizes covered with snow and cemented together by the freezing of the intermediate surface. The deceitfulness of the latter caused as is too common on such occasions the loss of some lives by drowning. The following passage announcing the opening of the river soon after is worthy of preservation on account of the spirit in which it is written.
February 11: We are happy to see the lately perturbed bosom of Father Thames resume its former serenity. The busy oar is now plied with its wonted alacrity and the sons of Commerce are pursuing their avocations with redoubled energy. Cheerfulness is seated on the brow of the industrious labourer those who were reduced to receive alms as paupers again taste the sweets of that comparative independence with which labour crowns the efforts of the industrious. What a fruitful source of congratulation does this prospect afford nor can the contemplative mind dwell on the subject without feeling gratitude to that beneficent Being who in a time of such calamity opened the hearts of the benevolent to administer from their abundance to the necessities of their poorer brethren and thus add cement to the bond by which all mankind are linked together. The mischief done on the river during the late frost is greater than can be remembered by the oldest man living. Among the craft alone it is calculated to amount to upwards of 10,000 independent of the damage sustained by the cables tackle & of the shipping.”
The mean temperature of 10.7C makes 2013 0.5C colder than the 1981-2010 average. And makes the year 46th warmest in the series going back to 1881.
Rainfall of 554.9mm is 92% of average for a year in this area, making it the 68th wettest in the series back to 1888. Some areas of the British Isles have been considerable wetter – this just reflects how variable rainfall can be.
Though the year appears fairly average it masks some notable events…
A couple of notable falls of snow were observed in January and February
January saw a couple of notable falls of snow, the first of which arrived on the 18th. By the morning of the 21st there was 13cm lying.
February saw a further snowy spell with 5cm falling on the 10th – but this only lasted a couple of days.
The mean temperature for March of 3.6C made it the coldest since 1892, the 3rd coldest in the series since 1881.
After a cool and dry spring and early summer July surprisingly turned out to be the warmest since 2006 – the mean temperature of 20.7C being the third warmest in the series going back to 1881. The warmest day of the year occurred on 22nd when 34C was recorded. This was followed by a very potent thunderstorm in the early hours of 23rd.
Autumn overlooking The Temple in Wanstead Park
An average August and September saw a couple of notable rainfall events with 32.8mm on 24/8 and 32.6mm on 13/9 being the the 27th and 28th highest 24hr totals in a series going back to 1961. In the August event Maldon in Essex saw in excess of 100mm leading to flooding. What made it more noticeable is that these events occurred during dry spells.
The end of October saw the St Jude storm blast through Wanstead. The strength of the gusts saw the demise of a few mature limes on Christchurch Green as well as trees in Wanstead Park.
The beginning of the month started with lots of calm, quiet weather with fog and night frosts. A high pressure inversion so not a proper ‘cold spell’
December was warmer than average with a mean temperature of 6.5C (0.9C above the 30-year average) – ranking it 33rd in the series since 1881. Rainfall of 81.9mm was 154% of average – ranking it 22nd in the series.
The month was 1C warmer than last December – with 84% of the rain that fell in December 2012.
Despite it ‘feeling’ like it has been the stormiest December for some years this month was not as windy as December 2012. To illustrate this the ‘wind run’ for this month (the number of revolutions of the anemometer) was 2408.7 miles. Last December was 2654.5 miles, in other words last December was 10% more windy.
Air frosts: 4
Ground frosts: 11
Thunder: 1
Small hail: 1
The rain on the evening of the 23rd was heaviest to the south and west of us – with 75mm in the Warlingham area of Surrey. Flooding and high winds caused hundreds of thousands of power outs in Sussex and Kent
Will it be a white Christmas this year? It’s the question most forecasters get asked year after year as the big day looms less than a month away.
The snow probably won’t arrive until after Christmas this year
It always fascinates me why Christmas and snow are so closely associated with each other when the odds, especially in London, are so stacked against it happening.
Perhaps it is the Christmas card scenes of Dickensian winters that get people yearning for the white stuff. Indeed, the image of snow covered cobbled streets can probably be blamed on Charles Dickens. The backdrop of A Christmas Carol, and a host of other books, were written when winters, and Yuletide, were generally much colder than they are now. Perhaps it was also the cold Decembers, which came during notably cold years as he was coming of age, that sowed the seed of his impressions of life in London. The Central England Temperature (CET) for December 1829 and 1830 were 1.4C and 1.8C respectively. To give you perspective the average mean temperature for the Wanstead region in December is 5.6C. Of course we had a taste of what a Dickensian December was like three years ago in 2010 when the average mean temperature was 1.5C. Though bear in mind the mean for 2010 was 10.5C – way above the 8.2C and 8.7C mean temps of 1829 and 1830!
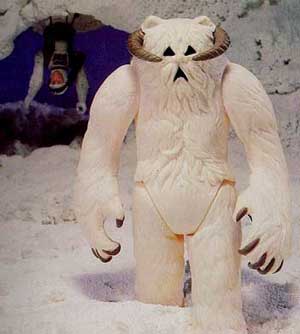
Christmas toys of yesteryear also took every opportunity to perpetuate the snow myth
But back to this Christmas… First of all, what do we mean by a white Christmas? The definition used most widely – notably by the bookies – is for a single snowflake, even if it lands in the midst of heavy rain, to be observed falling in the 24 hours of 25 December at a specified location recognised by the Met Office. Interestingly, the Met Office uses weather observations from Gravesend-Broadness, some 12 miles away, to show current conditions in Wanstead. A lot, however, could be said by us weather anoraks about the different microclimates between here and south of the Thames.
Technically, there has not been a white Christmas in Wanstead for over 30 years. In 2010, we could still see the Christmas card Victorian snow scene in small patches of our gardens, but these were leftovers of a previous dump, so it doesn’t count. Frustratingly, there has been snow on several Boxing Days in Wanstead (1995 and 1996) and in the weeks running up to Christmas, but not on Christmas day itself. The most typical Wanstead Christmas day weather is mild and dry, although it has rained on 12 of the last 33 Christmas days.
So why does it often snow either side of Christmas but not on the actual day? For Wanstead, Christmas is at the beginning of the period when it’s likely to snow. Looking at climate history, wintry weather is more likely between January and March than December.
On average, snow or sleet falls in the UK 5 days in December, compared with 7.6 days in January, 6.8 days in February and 6 days in March. White Christmases were more frequent in the 18th and 19th centuries, even more so before the change of calendar in 1752, which effectively brought Christmas back by 12 days. Climate change has also brought higher average temperatures over land and sea and this generally reduces the chances of a white Christmas.
For snow to fall we need moisture in the atmosphere. Snowflakes start their lives as ice crystals thousands of feet up, and when these tiny ice crystals collide they stick together in clouds to become snowflakes. If enough ice crystals stick together, they’ll become heavy enough to fall to the ground.
Precipitation falls as snow when the air temperature is below 2°C. It is a myth that it needs to be below zero to snow. In fact, in this country, the heaviest snowfalls tend to occur when the air temperature is between zero and 2°C. The falling snow does begin to melt as soon as the temperature rises above freezing, but as the melting process begins, the air around the snowflake is cooled. If the temperature is warmer than 2 °C then the snowflake will melt and fall as sleet rather than snow, and if it’s warmer still, it will be rain.
It sounds a simple combination, but getting precipitation on the days when there are temperatures low enough for snow are few and far between.
Christmas day in Wanstead, on the balance of probability and from previous patterns, is most likely to be a green and mostly cloudy but dry one. Some brightness is possible with temperature peaking at around 10°C. You can read my full methodology on why I think this may happen here.
Though my attempt to find the probability of a White Christmas effectively rules one out, there is still an outside chance that one could happen.
At this time of year the UK can effectively become a battleground between cold polar continental air to the north or east and moisture-laden mild tropical maritime air to the south and west. Where these air masses meet, snow is possible, but a lot depends on which air mass wins the battle. When battleground situations occur, in one location it can be snowing, but just 20 miles or so down the road it can be raining. This is because there is a fine line between the boundary of the warm and cold air.
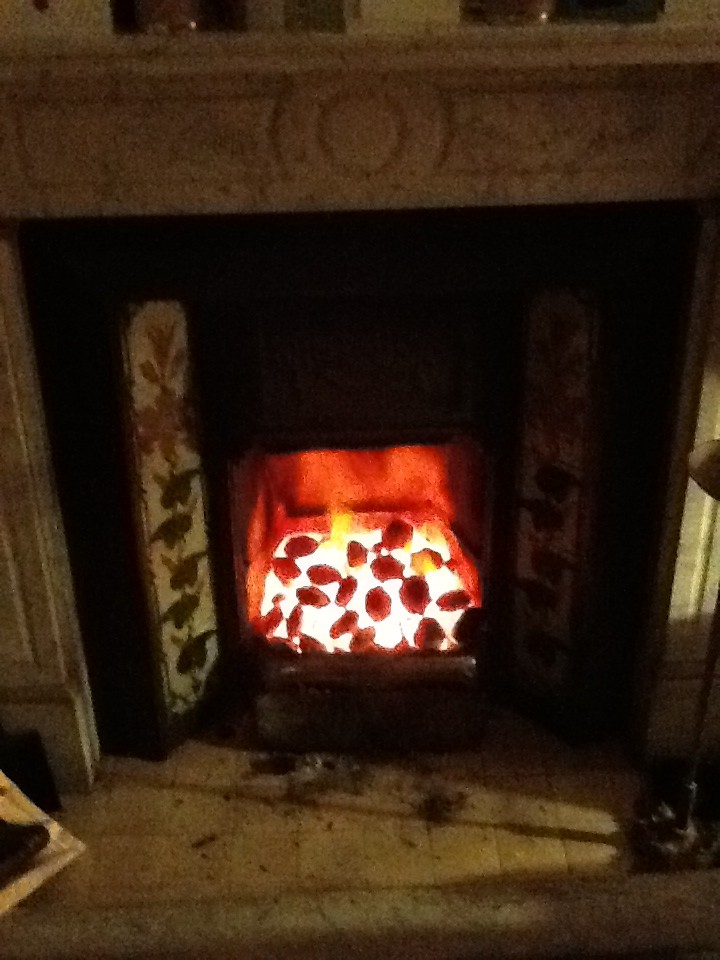
There’s nothing like an open coal fire. It’s even better when it is cold enough outside to have one
In years gone by, Wanstead and the surrounding area has often ended up in the cold air mass or the warm air mass. In these situations dry and mild or dry and cold weather is often the result. Of course, in a cold air mass situation there is always the chance of showery activity of the North Sea. The weather so far this winter has not been anything out of the ordinary, so I’m afraid there is nothing to suggest a white Christmas is likely.
If it does turn very cold on December 24, pray for clouds to appear and we could be in with a chance. But at the end of the day we still need that vital combination of temperature and moisture. Snow, like Christmas in that sense, requires some magic.
Much has been printed in the tabloids over the past month or so that we are in for a severe winter. Not a week goes by without the Daily Express splashing that the ‘Worst winter EVER is on the way’. Just this morning the same rag told us that three months of ‘exceptionally cold’ weather are due. On closer inspection the story elaborated the scene with quotes from James Madden of Exacta Weather, one of the ‘experts’ feeding these fantastical stories.
The Temple, Wanstead Park, always looks that much more stunning with a covering of snow
Quite how Mr Madden and other experts arrive at these forecasts is a bit of a mystery. The mystery has deepened further since I decided to crunch a few numbers and try to predict what is in store for the months ahead. Looking at data for this area stretching back over 130 years to 1881 I decided to calculate a seasonal average and arrived at a final figure using singularities – basically looking at the weather patterns we’ve had during October and November.
Many professionals would scoff at this method of pattern-matching, so I’ve incorporated a couple of other ‘now’ factors and taken on board current variables such as sea surface temperatures in the Atlantic and Pacific.
The figure I arrived at, taken as an average of the closest matching autumn periods, is a mean temperature of 4C with rainfall totalling 133mm over the months of December, January and February – that’s about a degree colder than average and 90% of average rainfall. The probability of a winter with a mean temperature of between 4C and 5C is 37% – the most likely outcome. With this in mind a winter in the form of 1986-87 is possible – though whether we would see the same extremes of temperature and snowfall that we experienced in January 1987 is open to question.
The Met Office, with all their computing power and expertise, seem to be hinting at something similar – ie slightly colder than normal. The opening couple of weeks to my forecast seem quite plausible, looking at tonight’s models. Look at the similarity in the synoptic charts for December 8th here.
Shoulder of Mutton pond, Wanstead Park
Over the last few years the snow lovers among us have been spoiled after a run of very mild winters during the late Nineties and early Noughties that prompted climate expert Dr David Viner to utter the immortal words that one day “children just aren’t going to know what snow is”. It was only a matter of a few years before the words from the senior research scientist at the University of East Anglia seemed a bit hollow.
Mark Twain, born this day in 1835 , once uttered the famous phrase: “Climate is what we expect; weather is what we get” – there is always a chance we could suddenly lurch back to milder winters. This winter could spring a surprise, be it very cold or very mild. But judging what’s happened over the last 130-odd years – a 1962/63 or a balmy 1989/90 look very unlikely.
* Forecasting models use probability on any given outcome. Millions of observations are fed into the Met Office database (and other countries’ weather agencies) every day. Supercomputers then crunch through this data to give probable outcomes. With the volatility of the atmosphere it is not surprising that certainty of any outcome often falls away rapidly. Forecasting has improved greatly in the last 20 years – though anything the models churn out beyond three to five days should be handled with caution. Long range models can give *some* idea of general trends for the months ahead – but changing just one variable can vastly alter an outcome at the end of the run.
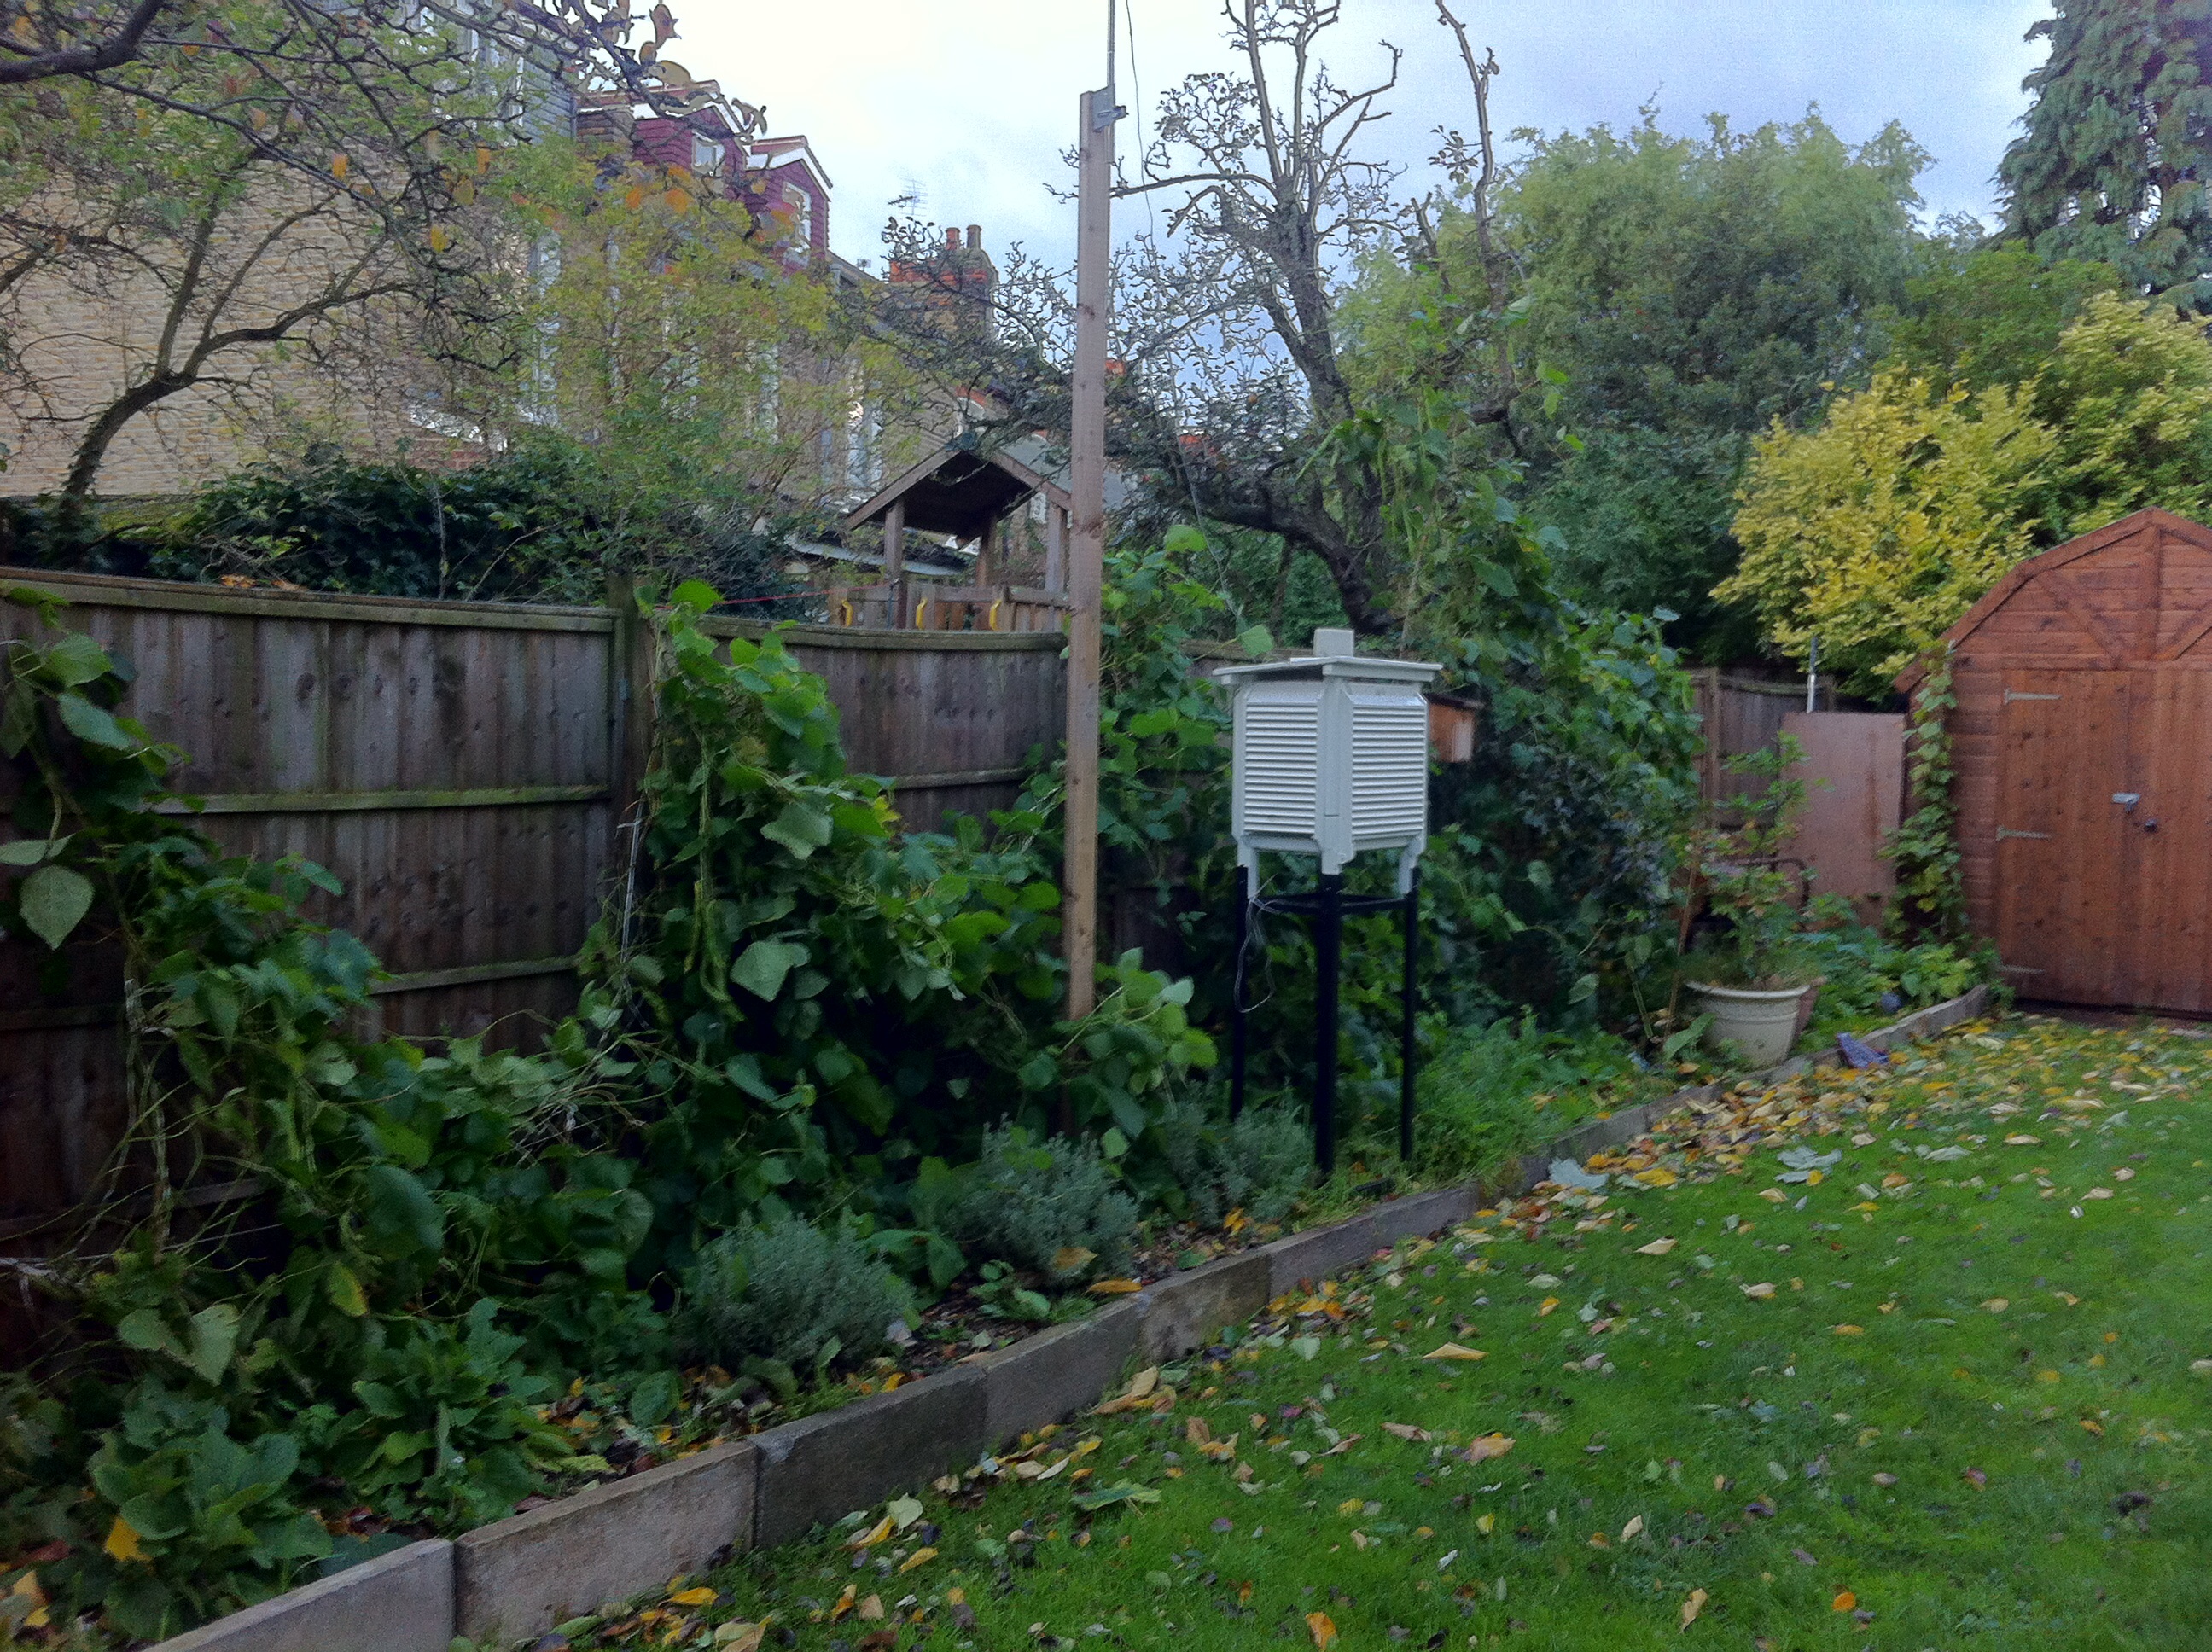
* *Over the past few months I have been collating data for the area around Wanstead. This data is freely available from the excellent Met Office library and is emailed via Excel spreadsheet. Rainfall stats include a near-complete daily archive, stretching from 1961 to 2003, from City of London Cemetery . Sadly the rainfall station, along with many others, ceased to supply the Met Office after cuts were made shortly after the turn of century. Prior to 1961 I have used monthly figures taken at the Greenwich Royal Observatory stretching back to 1881. Though this is 6 miles away the difference in temperature between the two areas would be miniscule compared with rainfall data and so can be used. I use my own stats for the period after 2003.
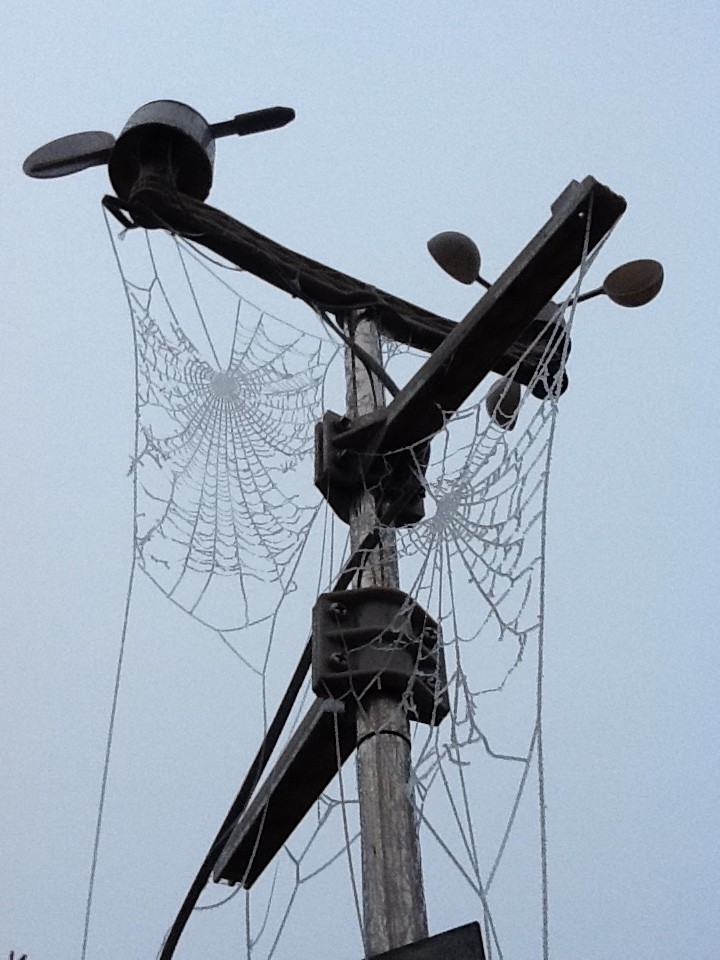
The Wanstead Weather live Twitter feed is one year old today. That’s over 8,700 tweets of hourly weather updates. In that time there’s been 59 air frosts, 632mm of rain, 165 rain days, 27 days with snow falling, 13 days with snow lying – a total of 14cm falling.
Highest max was 34C on July 22nd, lowest min was -7C on January 16th. A windrun of 25,741 miles shows that the anemometer has turned enough revolutions to have circumnavigated the globe, albeit at an average speed of 2.9mph.


 Last July, when compared with the previous summers, saw some of the best summer weather since 2006. But where does last year compare with the good summers of 2003, 1995, 1990 and 1976? I decided to have a look back at the daily records for this area which stretch back to 1959.


You must be logged in to post a comment.