A blog that tries to make sense of how the UK's national climate translates into local weather for Wanstead and the surrounding regions of east London and west Essex.
Check out my twitter feed @wanstead_meteo for local weather forecasts, stats, records and phenomena for the east London areas of Wanstead, Aldersbrook, Leytonstone and Stratford. And anything else weather
On a Saturday closest to full moon in July thousands of cyclists congregate in London Fields and ride 200km through the night to Dunwich on the coast of Suffolk.
Weather stats for London during the Dunwich Dynamo
Modestly described by the organisers as a “gentle bike ride to the beach, through soft country on good roads” the hours of darkness present a huge challenge for participants.
Michael Barry, the retired Canadian professional road racing cyclist, rated the challenge 5/10, harder than the 280 mile London to Paris ride which he ranked only 2/10.
Taking place in summer you would expect long hours of moonlight to be a welcome assist for these brave souls who peddle hours through the night to reach their goal. A look at the synoptic charts and statistics of each ride, however, reveals weather that is often a long way from being summery.
Looking in detail there appears to be very little chance of the ride coinciding with a heatwave. In 1999, 2003, 2004 and 2014 riders left the capital during days where the mercury reached above 80F (26.7C) – though this represents only 17% of starts. Temperatures around 70F (21.1C) are much more common.
Over 40% of the rides have seen over 1mm of rain on the opening day, this falls to 17% on the second day – a dry end to the marathon challenge is perhaps to be expected.
Patrick Field, of the London School of Cycling, said that 2007, the wettest start day to a Dynamo, was “gloriously wet”.
Perhaps what this blog also reveals is that UK weather at full moon, even in high summer, is notoriously unpredictable. Luke Howard , the father of meteorology, tried for 50 years to
prove a link between the weather and phases of the moon, but died still mystified at the ripe old age of 91.
Low pressure centred along the south coast brought a ‘gloriously wet’ Dynamo in 2007.
A movie of all synoptic charts highlights just how unsettled this time of year can be found here.
* The author is planning to take part in this year’s event to raise money for Cancer Research.
** Full stats for the weather in London during the Dunwich Dynamo back to 1992 can be found here: https://onedrive.live.com/redir?resid=A148835276FAFDEE!2561&authkey=!AEMmoeUZRVSq7uU&ithint=file%2cxlsx
With the meteorological winter over the first month of spring saw the weather return to its modern type: cooler than average just when most people are looking for warmth.
The squall of March 26th ran the length of England
The mean temperature of 6.7C was 1C cooler than average, the coldest March for three years and the first month more than 1C below average since last September.
The wet end to the month tipped the rainfall statistic well above average: 60.3mm is 148% of average for this area. It was the wettest March for eight years, notable because of a 14-day dry spell during the middle part of the month.
Sunshine was just above average. Over 116 hours were recorded, 107% of what we can expect to see during an average March.
The wettest day occurred on the 27th with 14.4mm, rain associated with blustery weather fronts from Storm Katie.
Air frosts: 7, Ground frosts: 14
So what has April got in store weatherwise? April is often a month when we can see huge swings in the weather from day to day as the natural warming of the atmosphere competes with the decaying coldness of northern latitudes.
The squall of March 26th ran the length of England
This often results in big showers and vast temperature differences not only day to day but between night and day too. All of the above is going to be on offer over the coming few weeks if the model output on the 1st is correct. A warmer phase will begin the month as winds switch southerly, drawing warmth from Spain. However, with low pressure close big showers and outbreaks of rain should be expected. Then as the low switches to the NE of the UK the door opens next week for colder NW winds with further rain or showers and chillier air. A lot of output strengthens this northern sourced air through the second week and with low pressure never looking likely to be far from the UK we will be looking at lots of showers and spells of rain.
Beyond the grasp of the models my long range outlook method suggests the April mean will be average or just below at 60% probability. Rather cold comes in at 20% while cold has a probability of 20%. There appears no chance of something mild.
The squall of March 26th ran the length of England
A wetter than average month looks most likely at 40% probability. Sunshine probably about average.
So to sum up: Mean: 9.2C, rainfall 57mm, sunshine 149 hours.
My March outlook for temperature was good. I predicted a mean of 5.9C (outcome: 6.7C). Rainfall was way off: 31.6mm (outcome: 60.3mm). Sunshine also out: 68 hours(outcome: 116 hours).
Here follows the full weather diary for March. To view full stats follow this link:http://1drv.ms/1kiTuzv
1st: Drizzly start turned to steady rain at 10am – this lasting past lunchtime but drying up to leave a cloudy afternoon. Very sharp squall blew threw at 2am with brief intense rainfall.
2nd: Bright start but soon turned very blustery and showery. Brighter after 3pm but cold as dew point fell away.
3rd: Sunny, cold start. Cloud bubbling up late morning.
4th: Sunny, gin clear start. Cloud bubbled up through the day. Clearing in the evening to leave a very cold early hours. Light rain moving in at obs time.
5th: Cloudy start with small area of rain around 10pm. Brief brightness at noon before more light rain moved in. Clearance again at 3.30pm. Small hail <5mm at 5pm. Clear spells overnight.
The squall of March 26th ran the length of England
6th: Sunny, cold start. Coud bubbling up late morning.
7th: Sunny, cold start with light winds. Variable cloud but feeling cold, especially so overnight.
8th: Cloudy, calm and cold start.
9th: Very light drizzle am before briefly brightening up. Heavier rain pushed in between noon and 2pm. More rain at intermittent periods into the evening.
10th: Cloudy until 2pm. Cleared at dusk to leave a frosty, cold night with thick fog patches on Centre Road.
11th: Sunny start with early mist clearing. Variable cloud through the day. Clear spells up to midnight but then tending to cloud over.
12th: Cloudy start tending to brighten up though sunshine remained mostly wintry.
13th: Cloudy start quickly cleared to leave sunny morning. Pleasant until a keen N’ly wind set in.
14th: Bright start with cloud quickly breaking, cold wind.
15th: Cloudy and dull start. Mostly cloudy through the day.
16th: Bright start but cloud filling in by 10am. Mostly cloudy all day
17th: Sunny and clear until 11am – patchy cirrus thereafter.
18th: Cloudy, cool start – the cloud lasting past 12 noon.
19th: Cloudy start – very brief drizzle. Brief brightness just before 10am then cloudy.
20th: Cloudy start brief sunshine at 10am-ish before cloud spilled across. Another clearance at 11am before cloud returned for afternoon.
21st: Cloudy until brief sunny spells at 10.30am. Much milder for a time before a mostly cloudy afternoon.
22nd: Mostly sunny all day with just a few cumulus.
23rd: Cloudy all day
24th: Cloudy, chilly start. Rain spread in by 1pm and turned heavier in the evening, clearing around 3am to showers. Sunny dawn.
25th: Sunny start with just patchy cumulus
26th: Cloudy with intermittent light drizzle. Very heavy squall at 6pm brought 5C fall in temperature.
27th: Sunny start but with some very dark clouds around. Squally winds and showers thereafter at 11.30 and 2.30pm.
28th: Cloud and rain to start and very windy due to Storm Katie, becoming fine by mid afternoon though heavy showers moved in.
29th: Bright start with cumulus dotting the sky. Cloud thickened up during the day with heavy showers in the evening.
30th: Sunny start with fair weather cumulus doting sky – this lasting all day.
31st Sunny, misty start
With the arrival of spring the people of Wanstead and the surrounding region must have thought that the terror of bombs raining down was at an end. Just one raid in February that damaged a few houses was in sharp contrast to the devastation wrought by the Luftwaffe since September.
Synoptic chart for March 19th 1941
But further horror lay in wait in March when four members of the Civil Defence Services, two of them young lads, would lose their lives while heroically carrying out their civic duties.
March continued the theme of the wet, miserable and dull winter. The early part of the month was unsettled with heavy rain at times. On the 6th, over 13mm fell. During the second week it became dry with sunny periods. There were some frosty nights and lingering fog. On the 12th, the maximum temperature was only 5°C. Temperatures slowly rose during the third week.
The morning of the 19th dawned cold and frosty. Patchy fog soon lifted under the warm spring sun – it was the second day running the region was bathed in over five hours of sunshine.
The fog soon returned after dusk but plummeting temperatures were no excuse for the wardens at Post 41 ‘F’ District to undertake their nightly duties from their Aldersbrook Tennis Club headquarters. This area of south Wanstead received a real battering from the early days of the Blitz, earning the nicknames “The Battle Field” or “Hell Fire Corner”.
The following impression of that night is written by one who was at the scene:
“The wail of the siren opposite the Post announced at 8.15pm the arrival of the raiders. The Post personnel saw a startling sight. The Flats were a sea of flame. Thousands of incendiaries were burning on the open space. The guns roared. It was obvious that the enemy was making a concerted and determined attack. Bomb flashes stabbed the blackout. Planes droned overhead. The batteries on the Flats joined those further away in putting up a terrific barrage.
At 8.50pm, three high explosive bombs fell in Lake House Road, damaging a number of houses and partly demolishing Nos 14 and 31. A few casualties resulted, one being a man who was trapped in the doorway of No. 14. Wardens heaved on the obstruction to release him. Gas escaping in the same house caused a fire. This was quickly dealt with and the flames smothered. A nearby barrage balloon had burst into flames, illuminating the scene with glaring brilliance and revealing the widespread damage.
At 9.20pm this first incident appeared closed, and services were awaiting the result of a final search and check-up before being dismissed. Then a parachute mine landed. It exploded a few yards from Aldersbrook corner on the Leytonstone side. A house in Lake House Road, already badly damaged, tottered to destruction. Number 11 caught fire and was destroyed. Loss of life would have been heavy but for the fact that most of the inhabitants had by now taken refuge in the Aldersbrook public shelter, and those who remained were in their dugouts.
The attack died down. Wardens returned to their posts – but the number for 41 was sadly lacking. The two boys’ bicycles stood in their usual place. ‘Busy somewhere’ said the chief. But the absent ones did not return, and a search was made. They were found – in the mortuary, three of them. It was known that two others had been taken to hospital. Warden Barnett was one of these. He died next morning of his injuries.
Just before the mine exploded, the messengers had been giving assistance in one of the less badly-damaged houses. Broome, although officially not on duty, had rushed out to lend a hand. Warden Hutton was endeavouring to turn off the gas at No 14 when the mine fell.
So the four from Post 41 died doing their duty on the Home Front. The two boys, pals in the service, sleep in one grave in Old Wanstead churchyard. The two men lie close by, in Ilford Cemetery.
A few days later their comrades stood silently at attention as the funeral cortege halted outside the Post. A Union Jack covered each of the four coffins.
The four members of the Civil Defence Services who gave their lives were: Thomas Hutton, 44, a warden, of Blake Hall Crescent, Wanstead; William Barnett, 36, a warden, of Belgrave Road, Wanstead; Roy Broome, 17, a messenger, of Lake House Road, Wanstead; and Herbert Stower, 18, a messenger, of Clavering Road, Wanstead.
Winston Churchill’s letter to his constituents
As spring wore on the weather remained mostly miserable though raid incidents lessened and petered out in May. Wanstead and Woodford had its last bombs of the period on May 10th.
In total 129 people lost their lives and 194 were injured during the campaign. This figure would nearly double when the next phase of the bombing, using V1 flying bombs and V2 rockets, would begin three years later in June 1944.
It is hard to imagine how people coped with the constant barrage of bombs during the Blitz. What seems to get lost in articles and historical texts I’ve read is just how grim the weather was at the time – remember this was a time before central heating. Not only were bedrooms freezing cold people must have laid there wondering if they were going to see morning.
It seems to be a human condition that when we are faced with adversity we just find a way of ‘getting on with it’ as best we can.
A new suburb the “size of Windsor” is being planned for Barking Riverside, the site of the old Barking Power station, according to a report in the Financial Times.
The Barking Riverside site is sandwiched between two sewage works and a power station
Some 10,800 homes are being planned for the 179-hectare site by the housing association London & Quadrant in association with the Greater London Authority. The report states that £70m will be invested in extending the London Overground rail line to the site. But no mention is made on how much will be invested in flood defences.
Nor does it say that the site is sandwiched between sewage works on either side of the river and a power station and the Ford Motor works to the east.
It is part of the Mayor of London’s ambition for a City in the East that also makes no mention of how much money will be invested in flood defences to make these new estates safe.
This 200,000 home masterplan for East London should be music to the ears of anyone struggling to find a place to live in our overcrowded capital.
But unless planners are willing to spend billions on new flood defences it is possible that these new homes will be particularly at risk of flooding should rainfall levels increase with climate change.
The Environment Agency’s Flood Plan map of the Thames illustrates Howard’s comment that “the Thames was so full during this time that no tide was perceptible”
Many of the developments mooted in London Mayor Boris Johnson’s plan for a City in the East are situated on flood plain, according to the Environment Agency.
On reading through the blueprint flood risk isn’t mentioned once.
A report in the Financial Times, citing the plan, says there is much more potential than previously thought to increase housebuilding in east London, the capital’s planning chief estimates. Sites earmarked include the Lea Valley and areas along the Thames beyond Canary Wharf.
‘Thames Riverside’, the term for an area along the north side of the Thames including Barking and Beckton, could host 27,000 homes, while areas on the opposite side of the river could hold 22,000, according to the report. There could be 52,000 more homes in Lea Valley, 30,000 on the Isle of Dogs and 15,000 in Woolwich.
Sir Edward Lister, deputy mayor for policy and planning, believes the capital’s authorities had learned from their experience with the Nine Elms regeneration area, where a statement of intent had galvanised developers.
“We just have to commit and then the developers can move in,” adding that there were “vast” amounts of underused post-industrial sites along the river in east London.
The housing plans also include commercial and industrial buildings, giving potential to create 280,000 jobs, as well as supporting infrastructure such as schools and hospitals. Transport improvements, such as Crossrail and a new London Overground line, would make the developments ‘desirable’. But costs would be dwarfed by any flood defence improvements.
Previously the Environment Agency has outlined a range of options for the future of the Thames Estuary flood defences. None are particularly cheap.
As a minimum, the EA estimates that the cost of maintaining the defences until 2035 will be around £1.5 billion, with an additional £1.8 billion needed to repair and upgrade the defences until 2050. Particular bits of marshland could also be set aside to store tide waters.
The River Lea close to where Luke Howard’s laboratory stood
More ambitiously, the government could fund a new barrier in either Tilbury in Essex or Long Reach in Kent. Such a barrier would be designed to resist the highest surge tides identified by the Met Office’s analysis of how conditions will change this century. The EA estimates a new barrier could cost as much as £7 billion, though that figure could go up if conditions change significantly as the climate changes.
The Agency also say the existing barrier could be converted to include locks, which could open and close more flexibly and extend the life of the defences. The EA report says a decision on a new barrier will have to be made by 2050.
It may turn out that there’s a more pressing reason to spend. The EA says 50 is the maximum number of times the barrier should close each year, and beyond that, the barrier could start to fail.
How high is the likelihood of flooding in this part of London? A look back through history shows the geography of the Lea Valley has made the area prone to inundations for hundreds of years.
The Environment Agency’s Flood Map for Planning shows the flood zone risk of the area. And endorses Howard’s account that the river Lea was ‘a mile wide’ at its peak
In January 1809 the lower River Lea burst its banks in several places following a deluge that dumped two inches of rain in the space of 24 hours. The rain abruptly ended a snowy cold spell that had begun over a month before in the middle of December. From Luke Howard’sreadings it is likely that up to half a metre of snow had fallen in the previous weeks in the upper parts of the surrounding countryside with only slight thawing. With the frozen ground unable to absorb any of the rapidly melting snow and rainfall the amount of water flowing downstream must have been immense. Howard takes up the story…
“The River Lea continued rising the whole of the 26th… The various channels by which it intersects this part of the country were united in one current above a mile in width which flowed with great impetuosity and did much damage.”
Howard, his chemical factory located on the banks of the river Lea close to what is now Bow flyover, wrote at length about the event, his account replacing the usual brief notes about daily weather in his book The Climate of London.
He talks of embanked pasture land being “filled to the depth of eight or nine feet” and people driven to their upper rooms relieved by boats plying under the windows.
“The Thames was so full during this time that no tide was perceptible.” It took until February 23rd for things to return to normal.
Miraculously no lives were lost in the flood and cattle “by great exertions” were saved by being kept in their stalls. Howard, saying that the flood could have been far worse, believed a neap tide, strong westerly winds urging water down the Thames and mild weather helped avert a tragedy.
Howard’s statistics of the previous months show that the second half of 1808 were wetter than average – though not especially so. And nothing like the rainfall this area recorded during the winter of 2013/14. From December 1st until February 8th 1809 Howard recorded 130mm of rain, which is about 100mm less than what was recorded during 2013/14.
This fact alone shows just how much the nature of the river has changed in the last 200-odd years thanks to spending on flood defences.
Work to improve the defences was prompted 67 years ago when similar catastrophic flooding came with the thaw that ended the severe winter of 1947, one of the coldest winters in history and an episode remarkably similar to what Howard recorded in 1809.
The Lea Valley, along with many parts of the country, saw some of its worst flooding in a generation. The river burst its banks at several points bringing misery to surrounding communities. Valleys turned into lakes in 40 counties and East Anglia’s fens were a sandbagged inland sea. More than 100,000 properties were damaged and, then as now, heroic battles were fought by the military to keep water-pumping plants and power stations dry.
A marker of that flood, together with a history of flood defences, can be found here. There is also British Pathe footage of another flood between 1910 and 1919 here .
Spillers Millennium Mill was repainted 25 years ago especially for the concert. It now provides the backdrop for the London Triathlon across from the ExCeL centre
The River Lea Flood Relief Channel, that flows between Ware, Herts, and Stratford, took almost three decades to complete. The channel incorporates existing watercourses, lakes and new channels. Since it was completed in 1976, there have been no major flood events in the Lea Valley, although there have been three occasions when the river system was full virtually to its capacity: in 1987, 1993 and 2000. Since its completion, the level of protection afforded by the structure has declined, so that in some areas it offers 2 per cent protection, and in some, only 5 per cent protection. The EA published a strategic environmental assessment in 2008, which looked at ways to maintain the flood defences in the Lea Valley.
In summing up its ambitions for a new development the Greater London Authority says it is trying to “overturn the historic perception of the east being seen as apart from London, rather than as a part of London”.
Jim Ward, a director of research at property consultancy Savills, said the challenge was “building something that makes people want to live and work there”, he said. “You need to build more than homes, you need to build a place.”
Boris’s record of late has not been good: an estuary airport to replace Heathrow has been dismissed as pie in the sky while his promise for a 24-hour Tube was made without first consulting unions that it was possible.
London’s safety from flooding is an altogether different proposition, both for old and new developments. Boris really needs to get London’s flood defences right before any brick is laid on these desperately-needed new developments.
Before I’m accused of going all Daily Express the following is based on winter statistics for the London area and other variables rather than the latest expert hopecast.
Even before looking at the data in depth the chart below shows that a warmer than average summer is more likely after a mild winter. The winter just gone was the third mildest in a record going back to 1797.
There are some real corkers in that list, including 1995 when this area recorded the driest August on record. Other notable summers included 1990 – England in the semi-finals of the World Cup and another notably fine August: the then hottest UK temperature was set that year when a maximum of 37.1C was recorded at Cheltenham – a record that lasted until 2003. The year 1989 also stands out with a notably sunny summer.
So far, so good. But what about rainfall? Some 145mm of rain fell this winter – pretty much on the nose average for this region. Combining warm winters with similarly average rainfall gives the following list.
Though some years have disappeared there are still some decent summers, and notably sunny too. The year 1975 stands out as does the sunniest summer on record, 1911! Both were also very dry summers.
Altough the teleconnection with El Nino is tentative in our part of the world the winter seemed to follow the pattern of most positive ENSO episodes, so it is worth having a look to see where the data goes. The latest forecast by NOAA suggests:
A transition to ENSO-neutral is likely during late Northern Hemisphere spring or early summer 2016, with a possible transition to La Niña conditions during the fall.*
If the forecast goes to plan the second ‘rainfall list’ would narrow further:
Viewed by graph reveals that ENSO values of all the years decreased over the course of the year. Series 1 is 1998, series 2 is 1983 etc.
In conclusion, the results would suggest that there is a 66% chance of a decent summer with below average rainfall and above average sunshine. In terms of details June 1st is still a very long off in meteorological terms – so whether it includes any heatwaves that would put it my premier league of hot spells is anyone’s guess at this range.
If it’s anything like 1959, 1975, 1983 or 1998, however, I think most folk will be happy.
*The above contradicts some forecasts which suggest a continuation of the general pattern that persisted during the winter: warm SSTs in the Atlantic / warm water south of the Grand Banks were largely responsible for the cyclonic westerly type of weather that caused the mild weather. In summer this would cause changeable weather rather than long spells of settled weather.
The winter of 2015/16 was skewed by a ridiculously mild December which brought the natural calendar forward three months.
A persistent flow of air from the Azores caused the unseasonable warmth in December, skewing the overall temperature for the season
Daffodils and other spring bulbs which normally come out in early March in this part of the UK were in full bloom at the end of December. Spring blossom was also very early with many may trees out in early February.
The mean temperature for the season finished 7.38C, that’s 1.9C above average. It was the third warmest winter in my series going back to 1797, behind 1989 / 90 and 1974 / 75.
Rainfall was almost precisely average: 144.8mm fell, within half a millimetre of what normally falls. Sunshine was just under average: 162.8 hrs is just over 5 hours short of what we’d normally expect during December, January and February.
The warmest day of the winter occurred on December 19th with 16.3C recorded, the second warmest December day in my daily record going back to 1959 – the record fell short by just 0.1C.
Snowfall, like the previous two winters, was very scarce
The coldest night of the winter coincided with the coldest mean temperature on January 19th. A low of -5.7C was the lowest value recorded in Wanstead for three years.
The wettest day of the winter occurred on January 10th when 11.6mm, a very unremarkable amount for winter and in complete contrast to the deluge that affected NW England and NE Scotland. There were 51 rain days (where 0.2mm or less fell) and 37 wet days (where 1mm of rain falls over a 24hr period).
Although sunshine was around average there were 24 sunless days.
Snow, like the previous two winters, was very scarce: just one day of snow falling and lying occurred on January 17th, though you had to be up early to see it.
So, all in all, not bad. The Daily Express and others should take note. This is what they printed last November… I’ll leave it up to the reader which forecast was more useful…
Though it was devoid of snowfall February 2016 was average for temperature and sunshine and on the dry side.
On the 15th cold northerly winds brought sharp showers to the coast. A big swell was seen at Broadstairs allowing for some good surfing conditions
Some sharp frosts made for a couple of stunningly sunny days, “ski resort weather” the kind of days that were absent during the first half of winter after the super mild December.
Rainfall of 35.1mm was 90% of average – the driest February for three years. Mean temperature for the month was 5.4C, 0.1C above the 1981-2010 mean.
Sunshine was just above average. Over 79 hours were recorded, 108% of what we can expect to see during an average February.
The wettest day occurred on the 7th with 11.6mm.
Air frosts: 10
Ground frosts: 16
A rare Channel low but conditions weren’t cold enough for snow
So what has March got in store weatherwise? The late winter synoptic pattern could see the first snowfall above 1cm over the coming days and next week though amounts are likely to be small and temporary and restricted to night hours.
The pattern bringing this messy wintry mix is low pressure moving SE across the UK between now and the weekend each band bringing progressively colder air across the UK. Much of the precipitation will be showery although Friday looks more interesting as a secondary moving south brings cold N or NE winds. Models suggest next week will see high pressure from the west displacing this cold N. The timescale is very uncertain and it may be toward the second half of next week before the general theme of dry and settled conditions prevail. Frosts at night remain likely and daytime temperatures remain close to or a little below normal.
Overall the first half of March does not look like it will offer much in the way of spring weather.
My long range forecasting method suggests the most likely scenarios to be rather cold or cold, though both are only at 33% probability. Something average or below works out at 83% probability. The only mild indicator is for something rather mild at 16% probability.
On the 15th cold northerly winds brought sharp showers to the coast. A big swell was seen at Broadstairs allowing for some good surfing conditions
A dryer than average month looks most likely at 66% probability. Something wetter than average works out at 34% probability.
Very dull conditions look most likely at 83% probability.
So to sum up: Mean: 5.9C, rainfall 31.6mm, sunshine 68 hours.
Taking all of the above into account perhaps the most likely scenario will be that the month will be predominantly anticyclonic with lots of gloom during the day and night frosts, varying in intensity.
So to sum up: Mean: 5.9C, rainfall 32mm, sunshine 67 hours.
My February outlook for temperature was good. I predicted a mean of 5.9C (outcome: 5.4C) with 31.6mm of rain (outcome: 35.1mm). Sunshine 68 hours (outcome: 79.5hrs)
Here follows the full weather diary for February. To view full stats follow this link:http://1drv.ms/1kiTuzv
1st: Cloudy, breezy start. Sunshine PM with nacreous clouds reported on east coast. Cold in a brisk wind.
2nd Cloud gave way to sunny spells around 11am – then feeling cold in a brisk wind.
3rd Cloudy and cold start then mostly cloudy with a cold wind.
4th Bright though mostly cloudy start. Cloudy through the day with odd spot of drizzle through the night. Area of very light rain gave about 0.1mm before 9am.
5th Cloudy with light drizzle up to 11am then briefly bright before more drizzle arrived.
6th Cloudy to start with odd burst of drizzle. Very windy and feeling chilly in wind. Rain arriving after 8pm.
7th Sunny start though cloud bubbling up after 11am and feeling cold in wind as dew point fell away. A very heavy, violent squall swept through at 2245z then blustery through the night.
8th Sunny start quickly gave way to squally showers which were mostly light. Strong winds into the afternoon with squally but light showers. Chilly overnight.
9th Cloudy and cold start, briefly clearing before noon before clouding over again.
10th Cloudy start though with some weak brightness lunchtime.
11th Mostly sunny all day and calm – warmth of the sun can now be felt. Just a few cirrocumulus. Stunning.
12th Bright start but cloud thickening. Day felt cold though as DP fell away.
13th Cloudy start with drizzle at obs time. Cold wind through to lunchtime and intermittent drizzle.
14th Bright, cold start with cloud increasing through the morning.
15th Bright, cold start with lots of wispy cirro-cumulus around. . 16th Stunningly sunny and frosty start. Just patchy cirrus through the day.
17th Cloudy through the day until 5.30pm when drizzle then rain set in.
18th Initially cloudy but then quickly brightened up. Sunny spells through the afternoon.
19th Sunny, clear and frosty start. Cloud began to build mid morning becoming overcast by noon. Light rain spread in about 4pm. Milder.
20th Bright start but cloud and wind quickly built. Light at times moderate rain fell through the afternoon – a thoroughly miserable day.
21st Dull, dry day up to 1pm. Very mild. Staying cloudy overnight with rain arriving at 5am, most falling until 7.30am.
22rd Drizzly start turned to a dull, overcast day
23th Cloudy with clearance at 11.30am. More cloud appeared to leave sunny spells. Much advection but cleared to leave frosty night.
24th Sunny, clear and frosty start. Lots of sunshine but quickly turned cold after dark with early frost. Cloud then wind lifted temperature though.
25th Bright start but quickly clouded over to become cold. Clearance in evening allowed temperature to fall quickly but cloud moved in and breeze picked up to prevent a sharp fall.
26th Cloudy, cold start. Brightening up to sunny spells by 1pm. Too much cloud overnight for a frost.
27th Bright start but became cloudy through the day with a cold easterly wind.
28th Cloudy start but some brightness around noon
29th Cloudy start but soon brightened up with long sunny spells before clouding in again early afternoon.
Over the past few days there has been a lot of speculation on the possibility of a sudden stratospheric warming event happening. These events can contribute to unseasonably cold snaps in winter though exactly where their effects happen on the globe is impossible to forecast at small scale resolution.
In short it looks like the eastern US is most likely to see any severe cold weather from this episode – what seems to happen a lot in recent winters in the UK.
Far from being an expert on this there was a very good posting on the usenet forum uk.sci.weather by Stephen Davenport.
“A temporary wind reversal is likely in the upper stratosphere; for example, see ECMWF at http://www.geo.fu-berlin.de/en/met/ag/strat/produkte/winterdiagnostics/, and have a look at the off-the-chart EPV (although not so much poleward). However, I do not see this as a major SSW (by definition) and everything points to a recovering but weaker circumpolar vortex mid-month onwards.
“That opens the door to Arctic air pouring far southwards, and there’ll be snow chances at least as far south as the Tennessee Valley. Incidentally there is a risk of another Nor’easter around Feb 9th-10th.
“Downstream a mid-Atlantic ridge could build rather strongly from the subtropical high towards Greenland with slowed zonal flow but most likely surface low pressure developments eastern Atlantic / near the British Isles.
“If the long wave pattern shifts a little eastwards then the increased meridionality *could* see LP progression pull in temporary subsequent N-NW flows for the UK – a more likely route to short-lived cold shots than via any high latitude blocking in the medium range.
“I think that elsewhere people have got hung up on the stratospheric warming and, as so often, drawn excitable conclusions. Cold impacts are more likely for the eastern U.S. than Europe with a displaced rather than a split vortex; and the circumpolar vortex was so strong first half of winter it was always going to take a lot to break it down fully. And sure enough, as noted there should be a recovery after this “attack”. You can see the vortex distortion and latterly the beginnings of recovery in this rather nice animation of 10hPa potential vorticity:
“GFS has occasionally pulled out a split vortex at various levels during the past week but doesn’t now.
“That’s not to say that a possible further warming (early final warming?) wouldn’t bring colder chances from the end of February into March.
“I was surprised to read recently that a well-known online forecaster had predicted significantly cold/blocked conditions for Europe in January via a major SSW. A bit premature, that.”
The coldest night in three years was recorded last month together with the first lying snow in January since 2013 – though you had to be up early on Sunday 17th to see it.
Snowfall on the 17th was just over 1cm deep at High Beech. In Wanstead it was just a thin covering that was gone by midday
For anyone looking for ‘traditional’ winter weather it was pretty desperate stuff and seems a continuation of the mild winters of the past three years.
Apart from a mild final week much of the month was rather cold with a couple of sharp night frosts that affected many early daffodils that bloomed during the super mild December.
Rainfall of 65.8mm was 124% of average – very similar to last January’s total. Mean temperature for the month was 5.8C, 0.6C above the 1981-2010 mean. It felt far cooler, however, because the December mean was 5C above average.
Sunshine was just above average. Over 54 hours were recorded, 108% of what we can expect to see during an average January.
The wettest day occurred on the 10th with 11.6mm.
Air frosts: 6
Ground frosts: 18
So what has February got in store weatherwise? There is no sign of any longer term changes in the pattern of synoptics across the UK. All models continue to suggest a very volatile jet stream with resultant low pressure close to or across the UK for much of the first half of February.
The snow on the 17th fell during the early hours of the morning
This week westerly winds will remain strong with severe gales in the north in association with Storm Henry over the next 36 hours. The current mild and damp conditions in the south should be replaced with colder, showery air moving south later on Monday, lasting into Wednesday. On Thursday another large warm sector will move up across the UK from the SW returning mild and damp conditions.
At the weekend all models show low pressure areas taking a much more southerly route across the UK with gales and wet weather. While no cold weather looks likely there may be incidences of very heavy and thundery showers. Only GFS on Monday is showing any hint of more settled, colder weather at the end of the period.
Using my long range method February is looking average, very dry and dull.
A mean of about 5.9C, just over average, is the highest probability at 71%. Something ‘rather mild’ comes in at 29% probability.
Rainfall is looking low: 15mm represents something 38% of average.
Sunshine totals will be low and it could be a dull month, around 60 hours of sunshine, that’s just 82% of average.
My January outlook for temperature good. I predicted a mean of 5.2C (outcome: 5.8C) with 59mm of rain (outcome: 65.8mm).
Here follows the full weather diary for December. To view full stats follow this link:http://1drv.ms/1kiTuzv
1st: Bright after sunny, clear dawn before clouding over with light rain. Rain at midnight.
2nd: Cloudy start after early overnight rain. Rainy spells and blustery throughout the day.
3rd: Drizzle to start then damp before more rain moved in at 11.30am – this fell intermittently through the day and evening and was often heavy.
4th: Bright, damp start after overnight rain. Some light outbreaks up to 2pm.
5th: Sunny, clear and cold start with contrails dotting the sky. Clouding over later with rain after 6pm. Misty around midnight.
6th: Bright, very damp start. Mostly cloudy with rain in the evening and overnight.
7th: Dull start with outbreaks of rain spreading in, some heavy and very blustery. Drying up after lunchtime though feeling cold. Cool overnight with frost on cars with a very brief shower on school run.
8th: Bright start though light showers around. Gradually clouding over. Clearer spells overnight and cool.
9th: Bright start though with plenty of cloud around. Showers, some heavy with small hail at 8.30pm. Clear spells overnight.
10th: Bright start after overnight rain. Cloud gradually decreasing to leave it clear at noon. Cloud returned after dusk and thickened up around 9pm. Heavy rain from midnight.
11th: Cloudy, damp and cold start. Some breaks after noon then clear spells overnight and cold.
12th: Sunny, cold start. Clouding over at midday to leave cold-feeling afternoon and overnight – too much wind for a frost.
13th: Bright, cold start but turning mostly cloudy. Rain in the evening and on ride home.
14th: Rainy. cold start, then cloudy with sunny intervals. Cold air digging in from midday.
15th: Sunny all day with just a few cirrus. Took a while for frost to form properly.
16th: Sunny, frosty start with just a few cirrus. Variable cloud and evening in London felt freezing. Some drizzle, this turned heavier and by 4am thick flakes were falling to give a thin covering. Some 1cm at High Beach during a bike ride.
17th: Cloudy start. Thin covering of snow (<1cm) thawed by lunchtime. Cloud built into afternoon to leave chilly evening.
18th: Bright start but sunshine was weak so felt cold. Mostly clear into the evening allowed for an early frost. A classic radiative cooling night until the early hours, assisted by a very gentle low-level flow off the continent where there were some very low dew points. Between 2am and 6am there was some thin, high-level cloud that drifted across, which stopped the radiative cooling. Warmth from the ground then briefly lifted the temperature until, once more the cloud cleared after 6am and allowed the temperature to fall again to its minimum of -5C at 0809z. There was also a little mixing of the layers of air between 2 and 6 which would also have had a cooling effect. Had it not been for the cloud I’d suggest that the low could have fallen to -6.2C, which would have been the coldest since February 2012 when it fell to -9.2C over full snow cover.
19th: Sunny all day with occasional alto-cumulus drifting across. Another cold night, the coldest in 3 years.
20th: Bright start with lots of scattered cumulus. Sunnier early afternoon and less cold. Another frost quickly forming after dark.
21st: Frost lifting quickly then cloudy with limited brightness throughout the day.
22nd: Cloudy start with rain arriving at 9.05am. Bursts through the day until early afternoon. Some brief brightness in the late afternoon.
23rd: Sunny, cool start. Clouding over with rain in the evening. Very mild.
24th: Cloudy start after overnight rain. Mostly cloudy with odd spot of drizzle though bright.
25th: Sunny, clear start though cloud bubbled up at 11am to leave mostly cloudy afternoon. Clear spells overnight and chilly.
26th: Cloudy and increasingly gusty up to midday. Some rain in the evening.
27th: Cloudy, blustery start.
28th: Sunny all day with just a few clouds around noon.
29th: Cloudy and breezy with some drizzle in the wind early afternoon. Report of 101mph gust on Shetland from Storm Gertrude. Wind seemed to strengthen at midnight before rain arrived.
30th: Cloudy and damp start after overnight rain. Sky soon cleared to leave mostly sunny afternoon.
31st: Drizzle in morning as warm front moved in.
During the opening months frequent cold blasts brought much wintry weather. Cold weather at the end of January turned severe during the second week of February.
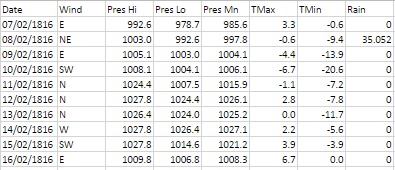
In the early hours of the 7th heavy snow, driven by gale-force north-easterly winds, brought some of the worst winter weather this area has ever seen. Some 35mm of precipitation is recorded on the 8th – this would normally give at least one foot of level snow that could obviously be whipped up into huge drifts.
Luke Howard described the scene in his diary entry saying the abundance of snow “loaded the trees to their tops and weighed down the smaller shrubs to the ground.”
The snow and polar continental air also produced perfect conditions for a textbook radiative cooling night within two days of the snowfall. The minimum recorded on the morning of the 10th: -20.6C has not, as far as I can tell, been repeated since.
To put that into perspective the lowest minimum of the severe winter of 1963 for this area was -12.2C recorded at Greenwich on January 21st. The coldest night I have personally recorded was -10.3C on January 12th 1987.
Howard, who would have taken readings at his laboratory in Stratford and home in Tottenham, remarked on the rare occurrence of the cold and said that the thermometer had remained below 0F (-17.8C) for a number of hours: “an occasion that happened less than five times within a century – the last appearing to be 19 years previous.”
Howard’s theory of the day was that such extremes didn’t occur during long continued frosts but rather at an interval of one winter after such a season. He mentions the frost of 1794-95, which lasted 44 days, immediately before which the thermometer fell to -2F. The following year a low temperature of -6.5F was recorded. The year 1816 followed the cold winter of 1813/14 – the same pattern, so Howard was prepared for the night of February 9th 1816.
Modern climatologists tend to discount these old records by arguing that standard conditions set by the World Meteorological Organisation were not met. However, Howard backs up his findings with a very thorough explanation of how he went about measuring the record low temperature that followed a freezing day where the maximum thermometer didn’t rise above -6.7C.
“Early in the evening on trying the experiment of placing a wet finger on the iron railing it was found to adhere immediately and strongly to the iron. I exposed several thermometers in different situations.
“At 8 pm, a quicksilver thermometer with the bulb supported a little above the snow stood at 0F. At 11pm a spirit thermometer in the same position indicated -4F, the former which had a pretty large bulb had not sunk below -3F. At 7.30am the 10th a quicksilver and a spirit thermometer hung overnight about 8ft above the ground indicated respectively -3F and were evidently rising.
“The thermometer near the surface of the snow had fallen to 5F and probably lower, but at the usual height from the ground of my standard thermometer the temperature was at no time below -5F. The exposure is north and very open.”
Howard goes on to describe the following day:
“From 8am the thermometer continued to rise steadily at noon a temperature of 25F was pleasant by contrast to the feeling and it was easy to keep warm in walking without an upper coat. Even at 0F, however, the first impression of the air on the skin was not disagreeable; the dryness and stillness greatly tending to prevent that sudden abstraction of heat which is felt in moist and quickly flowing air.
“Early in the afternoon the wind changed all at once to SW some large cirri which had appeared all day passed to cirrocumulus and cirrostratus with obscurity to the south. I now confidently expected rain as had happened in former instances but was deceived and the thaw took place with a dry air for the most part and with several interruptions by night.
As often happens with severe cold snaps Howard reported on the 17th that the snow “was mostly gone but very thick ice remains on ponds”; a period of just over a week.
The cold snap saw the mean temperature for February 1816 over three degrees colder than average at 0.8C.
Such extreme temperatures are rare in the capital though not unheard of. I know that there have been cases of sub -20C readings in, for example, the Rickmansworth frost hollow and Ian Currie’s Chipstead Valley, but I have never seen anything so low in east London. Could it be repeated again? Possibly, but like 1816, the synoptics would have to be absolutely perfect for it to happen.


 At 9.20pm this first incident appeared closed, and services were awaiting the result of a final search and check-up before being dismissed. Then a parachute mine landed. It exploded a few yards from Aldersbrook corner on the Leytonstone side. A house in Lake House Road, already badly damaged, tottered to destruction. Number 11 caught fire and was destroyed. Loss of life would have been heavy but for the fact that most of the inhabitants had by now taken refuge in the Aldersbrook public shelter, and those who remained were in their dugouts.


 Sunshine was just above average. Over 54 hours were recorded, 108% of what we can expect to see during an average January.


You must be logged in to post a comment.