All posts by wansteadmeteo

A blog that tries to make sense of how the UK's national climate translates into local weather for Wanstead and the surrounding regions of east London and west Essex. Check out my twitter feed @wanstead_meteo for local weather forecasts, stats, records and phenomena for the east London areas of Wanstead, Aldersbrook, Leytonstone and Stratford. And anything else weather

February 2016: average contrast

Though it was devoid of snowfall February 2016 was average for temperature and sunshine and on the dry side.

broadstairs
On the 15th cold northerly winds brought sharp showers to the coast. A big swell was seen at Broadstairs allowing for some good surfing conditions

Some sharp frosts made for a couple of stunningly sunny days, “ski resort weather” the kind of days that were absent during the first half of winter after the super mild December.

Rainfall of 35.1mm was 90% of average – the driest February for three years. Mean temperature for the month was 5.4C, 0.1C above the 1981-2010 mean.

Sunshine was just above average. Over 79 hours were recorded, 108% of what we can expect to see during an average February.

The wettest day occurred on the 7th with 11.6mm.

Air frosts: 10

Ground frosts: 16

low
A rare Channel low but conditions weren’t cold enough for snow

So what has March got in store weatherwise? The late winter synoptic pattern could see the first snowfall above 1cm over the coming days and next week though amounts are likely to be small and temporary and restricted to night hours.

The pattern bringing this messy wintry mix is low pressure moving SE across the UK between now and the weekend each band bringing progressively colder air across the UK. Much of the precipitation will be showery although Friday looks more interesting as a secondary moving south brings cold N or NE winds. Models suggest next week will see high pressure from the west displacing this cold N. The timescale is very uncertain and it may be toward the second half of next week before the general theme of dry and settled conditions prevail. Frosts at night remain likely and daytime temperatures remain close to or a little below normal.

Overall the first half of March does not look like it will offer much in the way of spring weather.

My long range forecasting method suggests the most likely scenarios to be rather cold or cold, though both are only at 33% probability. Something average or below works out at 83% probability. The only mild indicator is for something rather mild at 16% probability.

squall
On the 15th cold northerly winds brought sharp showers to the coast. A big swell was seen at Broadstairs allowing for some good surfing conditions

A dryer than average month looks most likely at 66% probability. Something wetter than average works out at 34% probability.

Very dull conditions look most likely at 83% probability.

So to sum up: Mean: 5.9C, rainfall 31.6mm, sunshine 68 hours.

Taking all of the above into account perhaps the most likely scenario will be that the month will be predominantly anticyclonic with lots of gloom during the day and night frosts, varying in intensity.

So to sum up: Mean: 5.9C, rainfall 32mm, sunshine 67 hours.

My February outlook for temperature was good. I predicted a mean of 5.9C (outcome: 5.4C) with 31.6mm of rain (outcome: 35.1mm). Sunshine 68 hours (outcome: 79.5hrs)

Here follows the full weather diary for February. To view full stats follow this link:http://1drv.ms/1kiTuzv

1st: Cloudy, breezy start. Sunshine PM with nacreous clouds reported on east coast. Cold in a brisk wind.
2nd Cloud gave way to sunny spells around 11am – then feeling cold in a brisk wind.
3rd Cloudy and cold start then mostly cloudy with a cold wind.
4th Bright though mostly cloudy start. Cloudy through the day with odd spot of drizzle through the night. Area of very light rain gave about 0.1mm before 9am.
5th Cloudy with light drizzle up to 11am then briefly bright before more drizzle arrived.
6th Cloudy to start with odd burst of drizzle. Very windy and feeling chilly in wind. Rain arriving after 8pm.
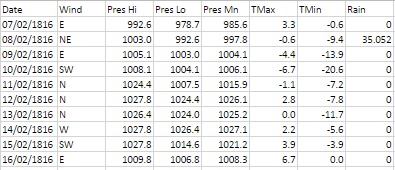
7th Sunny start though cloud bubbling up after 11am and feeling cold in wind as dew point fell away. A very heavy, violent squall swept through at 2245z then blustery through the night.
8th Sunny start quickly gave way to squally showers which were mostly light. Strong winds into the afternoon with squally but light showers. Chilly overnight.
9th Cloudy and cold start, briefly clearing before noon before clouding over again.
10th Cloudy start though with some weak brightness lunchtime.
11th Mostly sunny all day and calm – warmth of the sun can now be felt. Just a few cirrocumulus. Stunning.
12th Bright start but cloud thickening. Day felt cold though as DP fell away.
13th Cloudy start with drizzle at obs time. Cold wind through to lunchtime and intermittent drizzle.
14th Bright, cold start with cloud increasing through the morning.
15th Bright, cold start with lots of wispy cirro-cumulus around. .
16th Stunningly sunny and frosty start. Just patchy cirrus through the day.
17th Cloudy through the day until 5.30pm when drizzle then rain set in.
18th Initially cloudy but then quickly brightened up. Sunny spells through the afternoon.
19th Sunny, clear and frosty start. Cloud began to build mid morning becoming overcast by noon. Light rain spread in about 4pm. Milder.
20th Bright start but cloud and wind quickly built. Light at times moderate rain fell through the afternoon – a thoroughly miserable day.
21st Dull, dry day up to 1pm. Very mild. Staying cloudy overnight with rain arriving at 5am, most falling until 7.30am.
22rd Drizzly start turned to a dull, overcast day
23th Cloudy with clearance at 11.30am. More cloud appeared to leave sunny spells. Much advection but cleared to leave frosty night.
24th Sunny, clear and frosty start. Lots of sunshine but quickly turned cold after dark with early frost. Cloud then wind lifted temperature though.
25th Bright start but quickly clouded over to become cold. Clearance in evening allowed temperature to fall quickly but cloud moved in and breeze picked up to prevent a sharp fall.
26th Cloudy, cold start. Brightening up to sunny spells by 1pm. Too much cloud overnight for a frost.
27th Bright start but became cloudy through the day with a cold easterly wind.
28th Cloudy start but some brightness around noon
29th Cloudy start but soon brightened up with long sunny spells before clouding in again early afternoon.

‘SSW’ rumours and what it means for UK

Over the past few days there has been a lot of speculation on the possibility of a sudden stratospheric warming event happening. These events can contribute to unseasonably cold snaps in winter though exactly where their effects happen on the globe is impossible to forecast at small scale resolution. ssw

In short it looks like the eastern US is most likely to see any severe cold weather from this episode – what seems to happen a lot in recent winters in the UK.

Far from being an expert on this there was a very good posting on the usenet forum uk.sci.weather by Stephen Davenport.

“As far as the stratospheric warming is concerned, we’ve been keeping track of this for the last 1-2 weeks. Models have recently been consistent on this being a strong warming (10hPa 60-90 deg N zonal temperatures rising above 240K – see http://acdb-ext.gsfc.nasa.gov/Data_services/met/metdata/annual/merra/t60_90n_10_2015_merra.pdf).

“A temporary wind reversal is likely in the upper stratosphere; for example, see ECMWF at http://www.geo.fu-berlin.de/en/met/ag/strat/produkte/winterdiagnostics/, and have a look at the off-the-chart EPV (although not so much poleward). However, I do not see this as a major SSW (by definition) and everything points to a recovering but weaker circumpolar vortex mid-month onwards.

“Meanwhile, though, the vortex is being shunted off the pole by warming and big height rises firstly over Siberia then the Bering Sea, with exaggerated deformation which will see it extend far south across eastern North America and introduce cross-polar flow (which you can see here: http://www.tropicaltidbits.com/analysis/models/?model=gfs&region=nhem&pkg=Tz10&runtime=2016020412&fh=132&xpos=0&ypos=255).

“At 500hPa a very deep trough digs southwards east of the Mississippi as far as the Gulf of Mexico. GFS shows a -3 to -4 sigma anomaly over the Southeast with ECMWF similar but a little less deep: http://www.tropicaltidbits.com/analysis/models/?model=gfs&region=eus&pkg=z500a_sd&runtime=2016020412&fh=120&xpos=0&ypos=155

“That opens the door to Arctic air pouring far southwards, and there’ll be snow chances at least as far south as the Tennessee Valley. Incidentally there is a risk of another Nor’easter around Feb 9th-10th.

“Downstream a mid-Atlantic ridge could build rather strongly from the subtropical high towards Greenland with slowed zonal flow but most likely surface low pressure developments eastern Atlantic / near the British Isles.

“If the long wave pattern shifts a little eastwards then the increased meridionality *could* see LP progression pull in temporary subsequent N-NW flows for the UK – a more likely route to short-lived cold shots than via any high latitude blocking in the medium range.

“I think that elsewhere people have got hung up on the stratospheric warming and, as so often, drawn excitable conclusions. Cold impacts are more likely for the eastern U.S. than Europe with a displaced rather than a split vortex; and the circumpolar vortex was so strong first half of winter it was always going to take a lot to break it down fully. And sure enough, as noted there should be a recovery after this “attack”. You can see the vortex distortion and latterly the beginnings of recovery in this rather nice animation of 10hPa potential vorticity:

https://www.youtube.com/watch?v=a3Ddld-JL58&feature=youtu.be

“And here are some 3D representations:

https://www.youtube.com/watch?v=eumaRb-bH5k

“GFS has occasionally pulled out a split vortex at various levels during the past week but doesn’t now.

“That’s not to say that a possible further warming (early final warming?) wouldn’t bring colder chances from the end of February into March.

“I was surprised to read recently that a well-known online forecaster had predicted significantly cold/blocked conditions for Europe in January via a major SSW. A bit premature, that.”

January 2016: average and wet

The coldest night in three years was recorded last month together with the first lying snow in January since 2013 – though you had to be up early on Sunday 17th to see it.

epping snow
Snowfall on the 17th was just over 1cm deep at High Beech. In Wanstead it was just a thin covering that was gone by midday

For anyone looking for ‘traditional’ winter weather it was pretty desperate stuff and seems a continuation of the mild winters of the past three years.

Apart from a mild final week much of the month was rather cold with a couple of sharp night frosts that affected many early daffodils that bloomed during the super mild December.

Rainfall of 65.8mm was 124% of average – very similar to last January’s total. Mean temperature for the month was 5.8C, 0.6C above the 1981-2010 mean. It felt far cooler, however, because the December mean was 5C above average.

high beechSunshine was just above average. Over 54 hours were recorded, 108% of what we can expect to see during an average January.

The wettest day occurred on the 10th with 11.6mm.

Air frosts: 6

Ground frosts: 18

So what has February got in store weatherwise? There is no sign of any longer term changes in the pattern of synoptics across the UK. All models continue to suggest a very volatile jet stream with resultant low pressure close to or across the UK for much of the first half of February.

new street
The snow on the 17th fell during the early hours of the morning

This week westerly winds will remain strong with severe gales in the north in association with Storm Henry over the next 36 hours. The current mild and damp conditions in the south should be replaced with colder, showery air moving south later on Monday, lasting into Wednesday. On Thursday another large warm sector will move up across the UK from the SW returning mild and damp conditions.

At the weekend all models show low pressure areas taking a much more southerly route across the UK with gales and wet weather. While no cold weather looks likely there may be incidences of very heavy and thundery showers. Only GFS on Monday is showing any hint of more settled, colder weather at the end of the period.

Using my long range method February is looking average, very dry and dull.

A mean of about 5.9C, just over average, is the highest probability at 71%. Something ‘rather mild’ comes in at 29% probability.

Rainfall is looking low: 15mm represents something 38% of average.

Sunshine totals will be low and it could be a dull month, around 60 hours of sunshine, that’s just 82% of average.

My January outlook for temperature good. I predicted a mean of 5.2C (outcome: 5.8C) with 59mm of rain (outcome: 65.8mm).

Here follows the full weather diary for December. To view full stats follow this link:http://1drv.ms/1kiTuzv


1st: Bright after sunny, clear dawn before clouding over with light rain. Rain at midnight.
2nd: Cloudy start after early overnight rain. Rainy spells and blustery throughout the day.
3rd: Drizzle to start then damp before more rain moved in at 11.30am – this fell intermittently through the day and evening and was often heavy.
4th: Bright, damp start after overnight rain. Some light outbreaks up to 2pm.
5th: Sunny, clear and cold start with contrails dotting the sky. Clouding over later with rain after 6pm. Misty around midnight.
6th: Bright, very damp start. Mostly cloudy with rain in the evening and overnight.
7th: Dull start with outbreaks of rain spreading in, some heavy and very blustery. Drying up after lunchtime though feeling cold. Cool overnight with frost on cars with a very brief shower on school run.
8th: Bright start though light showers around. Gradually clouding over. Clearer spells overnight and cool.
9th: Bright start though with plenty of cloud around. Showers, some heavy with small hail at 8.30pm. Clear spells overnight.
10th: Bright start after overnight rain. Cloud gradually decreasing to leave it clear at noon. Cloud returned after dusk and thickened up around 9pm. Heavy rain from midnight.
11th: Cloudy, damp and cold start. Some breaks after noon then clear spells overnight and cold.
12th: Sunny, cold start. Clouding over at midday to leave cold-feeling afternoon and overnight – too much wind for a frost.
13th: Bright, cold start but turning mostly cloudy. Rain in the evening and on ride home.
14th: Rainy. cold start, then cloudy with sunny intervals. Cold air digging in from midday.
15th: Sunny all day with just a few cirrus. Took a while for frost to form properly.
16th: Sunny, frosty start with just a few cirrus. Variable cloud and evening in London felt freezing. Some drizzle, this turned heavier and by 4am thick flakes were falling to give a thin covering. Some 1cm at High Beach during a bike ride.
17th: Cloudy start. Thin covering of snow (<1cm) thawed by lunchtime. Cloud built into afternoon to leave chilly evening.
18th: Bright start but sunshine was weak so felt cold. Mostly clear into the evening allowed for an early frost. A classic radiative cooling night until the early hours, assisted by a very gentle low-level flow off the continent where there were some very low dew points. Between 2am and 6am there was some thin, high-level cloud that drifted across, which stopped the radiative cooling. Warmth from the ground then briefly lifted the temperature until, once more the cloud cleared after 6am and allowed the temperature to fall again to its minimum of -5C at 0809z. There was also a little mixing of the layers of air between 2 and 6 which would also have had a cooling effect. Had it not been for the cloud I’d suggest that the low could have fallen to -6.2C, which would have been the coldest since February 2012 when it fell to -9.2C over full snow cover.
19th: Sunny all day with occasional alto-cumulus drifting across. Another cold night, the coldest in 3 years.
20th: Bright start with lots of scattered cumulus. Sunnier early afternoon and less cold. Another frost quickly forming after dark.
21st: Frost lifting quickly then cloudy with limited brightness throughout the day.
22nd: Cloudy start with rain arriving at 9.05am. Bursts through the day until early afternoon. Some brief brightness in the late afternoon.
23rd: Sunny, cool start. Clouding over with rain in the evening. Very mild.
24th: Cloudy start after overnight rain. Mostly cloudy with odd spot of drizzle though bright.
25th: Sunny, clear start though cloud bubbled up at 11am to leave mostly cloudy afternoon. Clear spells overnight and chilly.
26th: Cloudy and increasingly gusty up to midday. Some rain in the evening.
27th: Cloudy, blustery start.
28th: Sunny all day with just a few clouds around noon.
29th: Cloudy and breezy with some drizzle in the wind early afternoon. Report of 101mph gust on Shetland from Storm Gertrude. Wind seemed to strengthen at midnight before rain arrived.
30th: Cloudy and damp start after overnight rain. Sky soon cleared to leave mostly sunny afternoon.
31st: Drizzle in morning as warm front moved in.

The night temps fell to -20C in east London

The ‘Year Without a Summer’ of 1816 brought many extremes of weather as well as a cold, wet and depressing summer.

Stats taken by Luke Howard during the February 1816 cold snap
Stats taken by Luke Howard during Feb cold snap

During the opening months frequent cold blasts brought much wintry weather. Cold weather at the end of January turned severe during the second week of February.

In the early hours of the 7th heavy snow, driven by gale-force north-easterly winds, brought some of the worst winter weather this area has ever seen. Some 35mm of precipitation is recorded on the 8th – this would normally give at least one foot of level snow that could obviously be whipped up into huge drifts.

Luke Howard described the scene in his diary entry saying the abundance of snow “loaded the trees to their tops and weighed down the smaller shrubs to the ground.”

The snow and polar continental air also produced perfect conditions for a textbook radiative cooling night within two days of the snowfall. The minimum recorded on the morning of the 10th: -20.6C has not, as far as I can tell, been repeated since.

annualTo put that into perspective the lowest minimum of the severe winter of 1963 for this area was -12.2C recorded at Greenwich on January 21st. The coldest night I have personally recorded was -10.3C on January 12th 1987.

Howard, who would have taken readings at his laboratory in Stratford and home in Tottenham, remarked on the rare occurrence of the cold and said that the thermometer had remained below 0F (-17.8C) for a number of hours: “an occasion that happened less than five times within a century – the last appearing to be 19 years previous.”

Howard’s theory of the day was that such extremes didn’t occur during long continued frosts but rather at an interval of one winter after such a season. He mentions the frost of 1794-95, which lasted 44 days, immediately before which the thermometer fell to -2F. The following year a low temperature of -6.5F was recorded. The year 1816 followed the cold winter of 1813/14 – the same pattern, so Howard was prepared for the night of February 9th 1816.

luke-howardModern climatologists tend to discount these old records by arguing that standard conditions set by the World Meteorological Organisation were not met. However, Howard backs up his findings with a very thorough explanation of how he went about measuring the record low temperature that followed a freezing day where the maximum thermometer didn’t rise above -6.7C.

“Early in the evening on trying the experiment of placing a wet finger on the iron railing it was found to adhere immediately and strongly to the iron. I exposed several thermometers in different situations.

“At 8 pm, a quicksilver thermometer with the bulb supported a little above the snow stood at 0F. At 11pm a spirit thermometer in the same position indicated -4F, the former which had a pretty large bulb had not sunk below -3F. At 7.30am the 10th a quicksilver and a spirit thermometer hung overnight about 8ft above the ground indicated respectively -3F and were evidently rising.

“The thermometer near the surface of the snow had fallen to 5F and probably lower, but at the usual height from the ground of my standard thermometer the temperature was at no time below -5F. The exposure is north and very open.”

Howard goes on to describe the following day:

“From 8am the thermometer continued to rise steadily at noon a temperature of 25F was pleasant by contrast to the feeling and it was easy to keep warm in walking without an upper coat. Even at 0F, however, the first impression of the air on the skin was not disagreeable; the dryness and stillness greatly tending to prevent that sudden abstraction of heat which is felt in moist and quickly flowing air.

“Early in the afternoon the wind changed all at once to SW some large cirri which had appeared all day passed to cirrocumulus and cirrostratus with obscurity to the south. I now confidently expected rain as had happened in former instances but was deceived and the thaw took place with a dry air for the most part and with several interruptions by night.

As often happens with severe cold snaps Howard reported on the 17th that the snow “was mostly gone but very thick ice remains on ponds”; a period of just over a week.

The cold snap saw the mean temperature for February 1816 over three degrees colder than average at 0.8C.

Such extreme temperatures are rare in the capital though not unheard of. I know that there have been cases of sub -20C readings in, for example, the Rickmansworth frost hollow and Ian Currie’s Chipstead Valley, but I have never seen anything so low in east London. Could it be repeated again? Possibly, but like 1816, the synoptics would have to be absolutely perfect for it to happen.

minima


Luke Howard’s old house needs saving

To many who walk down Bruce Grove, Tottenham, number 7 probably just looks like yet another old Georgian building under threat from development.

7 bruce grove
Number 7 & 8 Bruce Grove, Tottenham

Yet, if you look closely, the blue plaque says that the Grade II listed building was once the home of Luke Howard, ‘namer of clouds’.

The once grand Georgian villa was given permission to be developed over two years ago yet the developer has so far failed to begin the conversion. The building has since fallen into an alarming state of disrepair.

petetion
The petition is targeting 2,000 signatures

A petition has been set up to pressure the developer to take action before the fabric of the facade is lost forever.

Howard’s system of naming clouds is still in use today and his studies of the capital’s climate, using observations made at Tottenham and his former home in Plaistow, contributed immensely to our understanding of the urban heat island effect.

londonist article
The blue plaque was unveiled in April 2002 at a ceremony attended by the BBC Weather presenter Michael Fish and Luke Howard’s descendants

His diary entries, including accoubnts on inundations from the River Lea,  are also important in terms of our understanding on how severe weather in the early 19th century impacted London. He also had an influence on how Constable went about capturing the mood of a painting through careful cloud study

In terms of significance, Number 7 Bruce Grove is up there with 62, Camden Square, NW1, where George Symons pioneered the scientific study of rainfall, setting up the British Rainfall Organisation.

chesterton
Chesterton House, Balaam Street, Plaistow, was the home of Luke Howard in the early 1800s before he moved with his family to Bruce Grove in 1813.         Top pic: LB Newham

Too much of old London has already been lost. By reminding Redwing Estates of the importance of this small corner of Tottenham we might just help stop Howard’s former home going the same way as his Plaistow abode that was demolished to make way for an ambulance depot decades ago.

You can sign the petition at: https://you.38degrees.org.uk/petitions/save-7-bruce-grove-tottenham


Wanstead weather: 2015 review

This year finished as the ninth warmest year on record – some 0.5C cooler than 2014.monthly anomalies

Every month of 2015, apart from September, November and December, was roughly average – the means being within +/-0.7 every month, bringing the mean temperature to 11.9C, 0.7C above the 1981-2010 average.

Rainfall was less remarkable with the year being dryer than average. The total of 553mm puts it as the 162nd wettest since 1797.

It was also a very slightly duller than average year with 1,433 hours of sunshine recorded. That’s 97 per cent of average, the 77th dullest since 1881 – the least amount of sunshine for 11 years.

weather stats for 2015

For a review of each month, click January, February, March, April, May, June, July, August, September, October, November, December.

To view full stats follow this link:http://1drv.ms/1kiTuzv


December 2015: Exceptionally mild

December 2015 was a ridiculously warm month, the mildest on record in my local series going back to 1797.Top 10 warmest Dec means

The mean temperature of 10.9C is 5.3C above the average for the first winter month and breaks the previous record set in 1974 by an increadible 2.2C.

Indeed the month was warmer than what was a very mild November and was air frost free.

sahara
A persistent flow of air from the Azores was responsible for the unseasonal warmth

Sunshine was below average: 34.6hrs (86% of average) was the lowest total recorded since 2010, another December that was as exceptionally cold as this month was mild.

Rainfall was more run-of-the-mill: 44mm fell during the month: that’s 83% of average.

The warmest day occurred on the 19th with 16.3C recorded, the second warmest December day in my daily record going back to 1959 – the record fell short by just 0.1C.

warmest xmas daysOther daily records were broken including for daily mean temperature: 14.3C on Boxing Day smashed the previous record set on December 4th 1985 by 0.4C. This day also saw the highest daily minimum for December recorded: 13.5C. It was also the warmest Christmas Day on record in a series going back beyond 1852.

decrainThe lowest temperature occurred on the 8th when the mercury fell to 2.4C.

The wettest day was on the 3oth when 5.9mm of rain fell. There were only three completely dry days during the month. Thanks to the synoptic situation this area thankfully escaped the awful flooding which affected the north of England and Scotland.

december mean 1797-2015
There is quite a marked upward trend in the December mean since 1797

What has January got in store weatherwise? The models today (January 1st) suggest that low pressure will continue to pile into the UK from the west on quite southerly latitudes over the next week with some colder air infiltrating into the east and north of the UK from Europe with rain at times for our area. From that point on most output suggests largely unsettled weather continuing until the end of the two week period though there is a hint that high pressure may try to edge up from the SW or west later with less wind and rain but still mild.

Because of the exceptionally mild December there are virtually no figures I can work with to try to estimate January – but I’ll have a crack anyway, using figures that were at least 1C above the 1981-2010 December average.

A mean of about 5.2C with 59mm of rain, both around average. The highest probability is for average temps at 33% probability. Interestingly something ‘very cold’ comes in at the same probability. Rather mild and rather cold come in at 16% probability. I emphasise that even at such low probability my confidence is even lower.

My December outlook for temperature was way off – there was no chance shown of anything ‘very mild’.

Here follows the full weather diary for November. To view full stats follow this link:http://1drv.ms/1kiTuzv

1st: A few spots of rain after deluge overnight then cloudy.
2nd: Cloudy to start, some sun mid morning before it clouded over with two spots of rain. Mild overnight.
3rd: Cloudy start with little brightness all day. Rain moving in at 7.15pm and intermittent into the evening, clearing later with temp falling from midnight.
4th: Sunny, clear start, tending to cloud over at 11am with limited brightness.
5th Cloudy and windy all day – the wind peaking at 9pm but remaining fresh through the night.
6th: Cloudy and dull most of the day.
7th: Cloudy start with some light drizzle mid morning.
8th: Dull, drizzly start with steadier bursts. Heavy rain as front cleared through at 2pm. Evening and overnight much colder than of late.
9th: Sunny start, clouded over afternoon.
10th Cloudy start and through the day. Rain spreading in in the evening, clearing by midnight.
11th: Cloudy through the day until 2pm when a narrow band of rain passed through then dry and feeling cooler.
12th: Cloudy start with some drizzle around 10am.
13th: Cloudy and drizzly to start then just cloudy.
14th: Cloudy start with some brightness at noon. Cloudy into the afternoon with some drizzle overnight.
15th: Cloudy and dull. Rain later in the evening.
16th: Cloudy with two sunny intervals then cloudy with odd drizzle.
17th: Cloudy with odd brightness then rain at 5pm.
18th: Cloudy all day.
19th: Bright and breezy start.
20th: Dull start with heavy rain at 3.40pm. Then cloudy but clear by morning.
21st: Sunny start but quickly clouded over with rain.
22nd: Dull start with patchy drizzle up to 11.30am. More rain later with squall at 8pm.
23rd: Sunny start with cloud moving in then sunny spells.
24th: Sunny start quickly turned cloudy with heavy rain around noon, clearing to sunny spells.
25th: Cloudy start with light rain spreading in at 10.10am. Cloudy rest of afternoon with temperature climbing through the day for record warm Christmas day. Temp didn’t fall below 14C all night.
26th: Cloudy and warm all day. Temp fell to just 13.9C though the day then rose again to give the warmest December night on record, and also warmest December mean.
27th: Dull with brief burst of drizzle early then breezy and very mild. Clearer overnight and cooler than of late. Sunny start with pink clouds am.
28th: Sunny start with just a few cirrus. Mostly sunny through the day.
29th: Sunny start with brief heavy shower at 10.05am. Then sunny intervals.
30th Cloudy and breezy to start. Rain spreading in in the evening, stopping around midnight
31st: Sunny and clear to start but with cloud bubbling up from late morning. Brief rain after dark then dry and turning colder. Frost in early hours of 1st

The GFS countdown to Christmas Day

xmas2412
The op chart for Christmas Day on 24/12 shows the UK split between influence from a low to the north of Scotland and a European high giving a balmy SW’ly . Rain moves up from the SW during the day. Temps in London rising to 13C after a low of 4C. Best chance of anything wintry northern Scotland

The odds for snow on Christmas Day have been shortened for those that live in northern Scotland, reflecting the latest operational model runs that suggest the current mild regime will continue in the south.


The operational runs of the weather model GFS began to include Christmas Day in its forecast on December 9. Admittedly T+384 is la-la land in terms of trying to accurately predict what the weather will be like on the day but I thought it would be fun to see how the outcome changes over the next two weeks or so.

William Hill odds for snow on Christmas Day:
9th: London 5/1; Aberdeen 5/2; Edinburgh 3/1; Glasgow 3/1; Newcastle 4/1; Belfast 5/1;  Birmingham 6/1; Norwich Airport 7/1; Penzance 10/1
10th: unchanged. 11th: unchanged. 12th: unchanged. 13th: unchanged. 14th: unchanged. 15th: unchanged. 16th: London 8/1; Aberdeen 7/2; Edinburgh 4/1; Glasgow 4/1; Newcastle 5/1; Belfast 5/1;  Birmingham 7/1; Norwich Airport 10/1; Penzance 16/1.

22nd: London 12/1; Aberdeen 5/2; Edinburgh 7/2; Glasgow 7/4; Newcastle 5/1; Belfast 10/3;  Birmingham 10/1; Norwich Airport 10/1; Penzance 12/1.

23rd: London 18/1; Aberdeen 5/2; Edinburgh 7/2; Glasgow 7/4; Newcastle 5/1; Belfast 10/3;  Birmingham 10/1; Norwich Airport 10/1; Penzance 16/1.

My predicted outcome for London made at the beginning of December:  TMax: 7C  TMin: 1C Moderate westerly 60% chance of rain shower 1hr of sunshine

  • Please note that the outcome will change markedly from run to run, day to day. The best hint of what the weather will be like will be from T=240z (10 days) and, reliably, T+120z. If the pattern is zonal then detail can only start being pinned down at T+72z.|
xmas091206z
5C, variable winds with threat of rain approaching from south-west. Chance of wintry showers Liverpool northwards. Snow On Christmas Day 5/2 Aberdeen Airport 3/1 Edinburgh Airport 3/1 Glasgow Airport 4/1 Newcastle Airport 5/1 Belfast Int. Airport 5/1 Leeds Bradford Airport 5/1 Liverpool Airport 5/1 London Heathrow 6/1 Birmingham Airport 6/1 Dublin Airport 6/1 Manchester Airport 7/1 Bristol Airport 7/1 Cardiff Airport 7/1 Norwich Airport 10/1 Penzance RNAS Culdrose
xmas1012
The operational chart for Christmas Day on 10/12 shows ridging from the south allowing a brief spell of quiet weather. Temps in London a couple of degrees above freezing with frost at night. A flurry possible almost anywhere though east coast most likely.
xmas1112500mb
The op chart for Christmas Day on 11/12 shows a ridge bringing a brief spell of cold, quiet weather. Temps in London about 6C after a cold, possibly frosty start. Dry to start though increased risk of rain from the west later. Best chance for anything sleety probably Glasgow…
xmas1212
The op chart for Christmas Day on 12/12 shows the UK in a col. Rain a possibility almost anywhere but chiefly in the SW and south. Temps in London about 6C and a low of 3C. Best chance for anything wintry probably Aberdeen toward midnight…
xmas1312
The op chart for Christmas Day on 13/12 shows the UK in a returning N’ly regime. Heavy rain spreading in to SW and S. Temps in London about 12C and a low of 6C. Best chance for anything wintry in the far north
xmas1412
The op chart for Christmas Day on 14/12 shows the UK in a returning N’ly regime. Starting dry in the SE but rain spreading in later. Temps in London peaking at 13C after a low of 10C. Best chance for anything wintry in the far north
xmas1512
The op chart for Christmas Day on 15/12 shows the UK split between a returning N’ly regime and a large area of high pressure centred over Switzerland, advecting warm air from North Africa. Mostly dry across the UK with best chance of precipitation NW Scotland. Temps in London peaking at 10C after a low of 7C. No chance of anything wintry, anywhere
xmas1612
The op chart for Christmas Day on 16/12 shows the UK split between a returning N’ly regime and a large area of high pressure over central Europe, advecting warm air from North Africa. A band of rain lies across the UK though dry in the SE. Temps in London peaking at 13C after a low of 11C. No chance of anything wintry, anywhere
xmas1712
The op chart for Christmas Day on 17/12 shows most of the UK in a balmy SW’ly regime, controlled by a strong high pressure over central Europe. Air over the SE is all the way from the Sahara. Any precipitation confined to Scotland. Temps in London peaking at 11C after a low of 8C. No chance of anything wintry, anywhere
xmas1812
The op chart for Christmas Day on 18/12 shows the UK split between influence from a low centred over Iceland and a European high giving a balmy SW’ly . Air over the SE is from northern Spain. A band of rain heralds cooler air from the NW. Temps in London peaking at 11C and falling away during the day. Best chance of anything wintry Western Isles of Scotland
xmas1912
The op chart for Christmas Day on 19/12 shows the UK split between low centred off north of Scotland introducing a cooler NW’ly airstream while south just about hangs on to the European high. A band of rain clears SE early on 25th from the NW. Temps in London peaking at 10C and falling away during the day. Best chance of anything wintry high ground in N England and northern Scotland
xmas2012
The op chart for Christmas Day on 20/12 shows the UK split between influence from a low to the north of Scotland and and a European high giving a balmy SW’ly . Rain moves in from the west during the day. Temps in London rising to 12 after a low of 4C. Best chance of anything wintry northern Scotland
xmas2112
The op chart for Christmas Day on 21/12 shows the UK split between influence from a low to the north of Scotland and and a European high giving a balmy SW’ly . Rain moves in from the west during the day. Temps in London rising to 12 after a low of 4C. Best chance of anything wintry northern Scotland
xmas2212
The op chart for Christmas Day on 22/12 shows the UK split between influence from a low to the north of Scotland and a European high giving a balmy SW’ly . Rain moves up from the SW during the day. Temps in London rising to 13C after a low of 4C. Best chance of anything wintry northern Scotland
xmas2312
The op chart for Christmas Day on 23/12 shows the UK split between influence from a low to the north of Scotland and a European high giving a balmy SW’ly . Rain moves up from the SW during the day. Temps in London rising to 13C after a low of 4C. Best chance of anything wintry northern Scotland

This slideshow requires JavaScript.


Blitz bombs bring more terror to Woodford

The run up to Christmas 85 years ago saw yet more terror in the form of Luftwaffe bombs falling on an already shellshocked population in east London.

The final raid of the year, on the evening of December 8th, saw yet more tragedy befall the borough of Woodford.

Just after 7pm a high explosive bomb fell in St Albans Road, killing three people. And at 10.25pm a paramine was dropped on Wordsworth Avenue, South Woodford, killing 14 people and injuring 41.

It was the second deadliest day of the Blitz for the two boroughs which had already endured three months of bombing raids that had left 27 dead and over 100 injured.

The weather was fairly typical for early December, some winter sunshine with a high of 6C followed by a minimum of 2C. Really cold weather didn’t arrive until much later in the month.

Over a period of eight months around 450 bombs were dropped on the two boroughs, killing 129 people and injuring 194.

From autumn to spring in December 1806

When I was writing up my winter forecast I came across an analogue that was very similar to what happened during the period November 10th to December 31st.

mean 1806 v 2015
The period November 10th – December 31st in 1806 and 2015 show some striking similarities. It is also notable that mean during 2015 was 3C higher than 1806. Is this a question of synoptics or a warming world?


The results showed a close similarity between the two periods, November 10th – December 31st, though the mean in 2015 was some 3C warmer than 1806. Is this a question of synoptics or is this area now 3C warmer than it was just over 200 years ago?

Rainfall was also remarkably similar: 87.7mm fell from 10/10 – 31/12, just over 5mm more than 1806.

rain 1806 v 2015
The period November 10th – December 31st in 1806 and 2015 show some striking similarities. It is also notable that mean during 2015 was 3C higher than 1806. Is this a question of synoptics or a warming world?

Luke Howard, in his first volume of The Climate of London, describes a very warm December that followed on from a warm November that fooled flora and fauna into thinking spring had begun early.

Howard’s statistics are very high: a November mean of 9.5C while December was 7.2C. CET that November was 2.3C above average while December was 3.3C above average. Considering the England Wales Precipitation series a slightly wetter than average November was followed by a very wet December – over 250% the monthly average.

“The catkins of the filberts expanded prematurely. On December 25th a hedge sparrow’s nest was taken at Doveridge, Derbyshire, with four eggs and near Warwick a green linnet’s with two eggs. It is worthy of remark that the heat was the same on December 24th as on June 24th last – on both those days the thermometer being nearly 60F.”

Howard goes on to describe how the south-west wind had “reigned for weeks” – for most of November and December before finally giving way at the turn of the year.

“The south west wind which had so long reigned yielded just at the close of the year to the north and west . Some frost ensued which, however, had not the characters of permanence being neither ushered in by driven snows nor accompanied with a dry and serene atmosphere.”

The River Lea close to where Luke Howard's laboratory stood by wanstead_meteo
The period November 10th – December 31st in 1806 and 2015 show some striking similarities. It is also notable that mean during 2015 was 3C higher than 1806. Is this a question of synoptics or a warming world?

His description is not dissimilar from what is known as a “three-day toppler” cold spell where a dominant European high briefly gives way to cold air from the north-west or north, bringing often heavy snow to Scotland and the north but just a few cooler days in the south, before the cold feed is cut off as the high re-establishes itself.

Howard also describes how the warmth affected plants.

“The effects of the late high winter temperature on vegetation must have been obvious to everyone who has seen the country. To the very close of the year the grass continued to grow, the daisies to enamel the turf and many of the inmates of our gardens native and exotic to thrive and blossom. Even hyacinth bulbs left in the open beds shot up and flowered. Ten years ago winter came on six weeks earlier and with considerable severity.”

Words that echo what’s going on this month, particularly in the south-west where I’ve heard reports of roses still in bloom and affected by greenfly whiles daffodils look like they will be out in a couple of days.

January and February 1807 were, by the standards of that time, roughly average.