There’s been countless reports about amazing amounts of snow falling across the French, Swiss and Italian Alps to the point where some agencies have been proclaiming that it has been the best season for the white stuff in 30 years.
Extraordinary totals have fallen in some areas. Bourg-St-Maurice, the jumping off point for Savoie resorts including Les Arcs and Val d’Isere, has recorded over 400mm of precipitation over the past 30 days, equating to around 4m of snow at the resort summits.
In Switzerland, large amounts of snow in a short period caused chaos in Zermatt, stranding tourists after the area’s rail services suffered disruption.
Away from the north and west side of the Alps, however, snowfall, while good, has been less impressive the further south and east you look.
30-day precipitation totals reveal that Bourg St Maurice recorded 422mm while Obertauern in the east recorded 99mm.
It is a far cry from last year where some resorts on the southern side of the range were particularly dry. San Bernardino, during the last 30-days, has recorded 179mm of precipitation. During the same period last year just 14.6mm fell!
The outlook for the Alps continues to look unsettled with snow forecast to fall at resorts that are in deficit to the Valais and Savoie areas.
An article by the late meteorologist and broadcaster Philip Eden a number of years ago considered many of these patterns and found that, to varying degrees of reliability, they provided a guide to what the weather would be like at any given time of the year.
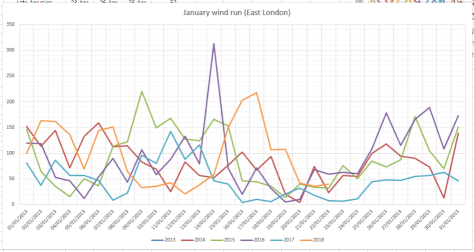
Considering climate change I wondered how much these patterns could still be relied on. Using my own pressure, rainfall and ‘wind run’ data (the total amount of daily wind) going back to the start of 2013 I had a look at the singularities for January and February
January patterns at the beginning, middle and end of the month appear to be the most reliable. However, it is only the ‘mid-Jan settled’ period that is most reliable.
The pressure trace most notably shows a general rise from the 17th, the date of last week’s windstorm, consistent with the mid-January settled singularity.Though this year’s ‘settled’ January spell saw rain the past 5 years have seen mostly dry weather.Very little wind has been recorded around January 20th for the past 5 years
The early Feb settled spell occurs with very low probability: just 56 per cent. And this year the pressure, according to the GFS model, plotted below by WXCharts.eu, is predicted to be around 1040mb by February 2!
This animation of the GFS model shows the idea of the Iceland low, which drives our SW’ly type weather, ‘taking a holiday’ to southern Iberia, possibly advecting any cold weather in the east to flood the UK
Looking at the results of the past 5 years it could be concluded that the patterns do still occur but because of the nature of the jet stream, which seems to meander far more readily than in the past, these stormy / quiet episodes are becoming shorter than they were in previous studies.
This weekend marks the halfway point through winter. Though December brought some snow January has been broadly average – really cold air has been absent with only one air frost recorded this month.
The cloudy, anticyclonic type weather is about to be replaced, however, with cold, polar maritime air this week set to flood down from the north-west.
Since December 1st, Wanstead has recorded 12 air frosts – about average. The coldest night was just -3.7C. The current mean temperature this winter to January 14th is 5.7C with rainfall 111mm – statistics that are remarkably similar to the winters of 2012/13 and 1990/91. Both those seasons were followed by cold late winters, February 1991 saw some of the deepest snow that I’ve ever seen in the south-east; the mean temp for that February finished 1.6C, the 14th coldest in the local series going back to 1797.
Using my method for finding patterns stretching back over 50 years to forecast this winter I picked out years that were +/- 10% of the 2017/18 total rainfall. From these I then weeded out the seasons where the average temperature was +/- 10% of the 2017/18 mean.
This gave a list of just two other winters with similar temperature and rainfall. Both winters had above average ‘snow lying’ days, the long terms average for this area being six.
Before any readers accuse me of going all Daily Express with the title of this blog I would emphasise that this piece doesn’t echo the latest long-term output from the models, which are in a state of flux, caused mostly by the evolution of the explosive cyclogenesis expected midweek. It is simply a reflection of what the local data is telling me.
A 100% guarantee of snow isn’t such a fantastical claim as, during the past 10 years, there is only one winter when no snow fell or was lying at 9am!
In terms of the rest of the winter, outside of the models, I would expect a couple more snowfall episodes, similar to the ones we had in January and February 2013. A repeat of February 1991, while not impossible, looks unlikely – there seems to be far too much energy coming from the Atlantic to allow the all important Scandinavian / Russian high to form and exert its influence far enough west for long-lasting cold and snow.
November normally marks the return of those autumn staples frost and fog and this December marks the 65th anniversary of the Great Smog.
Looking back through the archives the worst fogs tend to appear throughout these two months, set off by recurring weather patterns. The usual scenario, an anticyclone centred over Switzerland and Austria, leaves our part of the UK in a light SE’ly feed off the continent. Warm air aloft traps already poor quality air at ground level, the temperature inversion gradually leading to increasing levels of pollution.
During the Georgian Regency period fog occurs numerous times in Luke Howard’s Climate of London.
November 27th 1816 : “The atmosphere was so darkened yesterday morning in the vicinity of the metropolis by the thick fog combined with smoke that in some parts it appeared like a cloudy night. In the neighbourhood of Walworth and Camberwell it was so completely dark that some of the coachmen driving stages were obliged to get down and lead their horses with a lantern.” (Evening Mail)
December 31st 1817: “The fog of Wednesday (31st) seems to have been confined to the metropolis and the immediate vicinity. No further to the northward than the back of Euston Square the weather was clear and even bright. A gentleman who came to town from Enfield saw no fog till he approached London. Southward of London it extended as far as Clapham and it was rather thicker in some of the environs than in the metropolis itself. Upon an average 10ft was the distance at which objects became invisible out of doors. Within doors it was impossible to read without a candle.”
November 3rd 1820: “A very thick fog in the morning.”
And on the 18th: “An extremely thick fog which remained most of the morning. About 10am the coachmen on the road were unable to see the heads of their horses which in many instances were obliged to be led.”
In 1828 several days in November were noted for their fogginess, including 11th, 17th and 19th. The 12th had “extreme dense fog all day.”
“The fog of Wednesday (12th) has seldom been exceeded in opacity in the metropolis and its neighbourhood. It began to thicken very much about half past twelve o’clock from which time till near two the effect was most distressing making the eyes smart and almost suffocating those who were in the street, particularly asthmatic persons.
“In the city all the bankers and offices of different descriptions as well as the principal shops were obliged to have lights. To see with any distinctness further than across the street was impossible. All the narrow lanes beyond the perspective of a few yards were absolutely in a state of darkness and in the great thoroughfares the hallooing of coachmen and drivers to avoid each other seemingly issuing from the opaque mass in which they were enveloped was calculated to awaken all the caution of riders as well as of pedestrians who had to cross the streets.
“On the Thames as on land the tendency which fog has to enlarge distant objects was strikingly illustrated. The smallest vessels on their approach seemed magnified to thrice their usual dimensions. St Paul’s had a prodigious effect through the mist though neither that nor the Monument were visible above the height of the houses. This optical illusion is said to arise from the fog diminishing the brightness of objects and consequently suggesting a greater distance since while the visual angle remains the same the greater the distance the greater the real magnitude. It cleared off a little about a quarter past two but returned with all its density in the evening. (Public Ledger)
The following year 1829 saw a virtual repeat with wintry weather setting in at the end of the month. Fog was recorded on November2nd, 11th and 19th. On the20th the diary entry read: “hoar frost, foggy day and so thick at night as to prevent travelling,” before the weather turned colder on 24th: “a hoar frost, cloudy, a heavy fall of snow from 10pm through the night – 4 inches and upwards on the ground. 25th: a little more snow, thaw. 26th: thaw going on cloudy, very cold. 27th: very thick fog, drizzly.”
With coal being the primary source of heat and power for millions of Londoners the air during anticyclonic conditions would have been thick with acrid soot. The smell of coal in pea soupers, fogs caused by a mixture of soot, smoke and fog, is referred by a Mr Guppy in the letters page of The Times on December 5th 1837.
A London particular…
Not only was the darkness so great [in the morning] that the shops were all lighted up, but also every object in the streets, however near, was totally obscured from the view of the persons walking along. In Piccadilly the darkness was very great, and the confusion caused by the vehicles running against each other beyond description. About 9 o’clock the Hastings branch coach, which had just left the Old White Horse Cellar, while endeavouring to turn into St. James’s Street, ran into the shop window of Mr Hoby, the celebrated bootmaker, at the western corner, which it demolished with a fearful crash, breaking upwards of 40 squares of glass.
Fast forward 35 years, with the industrial revolution in full swing, a notable fog in December 1873 was described in The Medical Times and Gazetteas “one of the most disastrous this generation has known,” going on to point out that “to persons with cardiac and respiratory disease it has in numerous instances proved fatal.” Some 273 people died as a result of bronchitis caused by the coal-smoke saturated fog which enveloped the city for days.
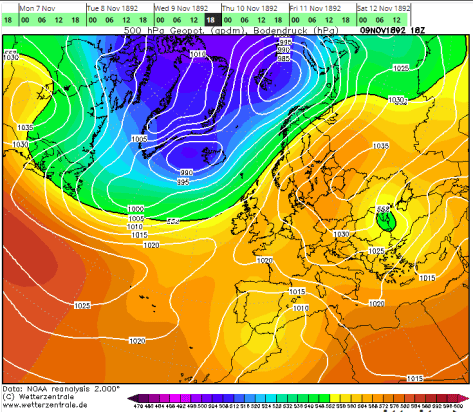
Reanalysis charts enable us to see how an anticyclone centred over Austria allowed ideal conditions for fog to form, the worst conditions probably being on November 9th 1873
With the population of London steadily increasing, together with ever higher demand for fossil fuels, the fogs grew steadily filthier. Throughout 1892, the letters pages of The Times were filled with complaints about the increasing number of fogs which slowed the metropolis to a crawl. Most were concerned with what could be done to either end the great scourge or to at least ameliorate the worst effects of the great seasonal nuisance.
By the autumn, the governor of the Gas Light and Coke Company was becoming tired of accusations that they were not supplying enough gas during fogs and pointed out that during a particularly foggy week in November, consumers used 60 million cubic feet of gas more than in the corresponding week a year earlier. Turning to the chief complainant, he suggested that his problem lay with his fittings “over which the company has no control” and went on to accuse him of “recklessly bring[ing] a baseless charge against this company.”
Conditions in November 1892 prompted many to write to The Times of London to complain about the ever increasing occurence of fog
And so it went on. But it would be another 60 years before the Great Smog, in December 1952 that led to at least 4,000 deaths and 100,000 being taken ill by the smog’s effects, finally brought about a wave of action that led to the Clean Air Act in 1956. The six days of the anticyclonic conditions are shown below.
How the Daily Express reported the ‘pea souper’ in 1952. Absolutely no need for any hype that plagues that paper’s weather stories today!
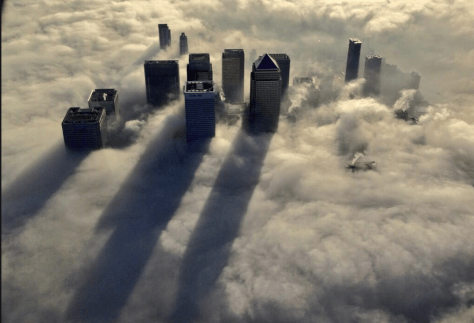
The anticyclones that caused these horrendous smogs still happen today. Since 2013 I have recorded 10 days of fog at 9am in the autumn / early winter seasons, including one in December 2013 that prompted the iconic image of Canary Wharf poking up through the gloom below.
Canary Wharf fog picture: Metropolitan Police helicopter takes stunning pictures of fogbound London from the sky | Metro News
Fog on November 1st 2015 was thick enough to see the annual firework display on Wanstead Flats cancelled.
With the advent of the Clean Air Act the often annual problem of smogs became a thing of the past though, over the past few years, pollution levels have been creeping up again. Campaign groups such as Clean Air in London seem at last to have a handle on the seriousness of the situation and that these 19th century weather patterns that brought such horrendous conditions still occur today. Indeed this table, drawn up by Xmetman, shows how common high pressure still is in winter.
It would be interesting to see how pollution today, in terms of total airborne particulates, NO2 etc, compares with pollution that Londoners had to suffer throughout the 19th and 20th centuries.
Heatwave hype has been building over the past few days and, for once, the media has been justified in its coverage of the current spell.
Temperatures over the past few days have been enough for the Met Office to trigger its Heath-Health Watch whereby the mean temperature (an average of the maximum and minimum) for two consecutive days reaches 23.5C.
A couple of years ago I compiled a list of heatwaves for this area back to 1852 where the mean temperature reaches at least 23.5C three days running. This spell, the only other June heatwave (the other being 1976!), only just scrapes into the list.
Although it felt hot this spell, in terms of Premier League quality, was more Middlesbrough than Chelsea.
Forecasters say today is likely to be the hottest June day for 40 years though I’d be surprised if we exceed the 34.2C recorded on June 27th 2011. It would be the fifth day running that 30C has been reached in this area, enough to fulfil the World Meteorological Organisation’s (WMO) definition of a heatwave.
Whatever happens today the fact that the heat has been produced by a tropical maritime airmass is remarkable. With France and Spain recording some very high temperatures of late the same pattern in July and August could put more records at risk of being broken.
This week marks the 41st anniversary of the start of probably the finest British summer in history, but anyone hoping that yet another parallel with the 1970s is about to come true should take a look at the latest model runs.
The latest GFS operational run suggests a much cooler, more unsettled end to June – a polar opposite of 1976…
Frost still lingers on my lawn as I write this winter forecast on the last day of the meteorological autumn. Last night’s minimum was -6.1C, the coldest night this year and, indeed, colder than any night last winter.
It would be very easy to get caught up in the hysteria that happens every November of what the winter will bring. Most of the hysteria comes from ‘coldies’, those folk that hope every winter will be the coldest and snowiest on record. I count myself among them.
The north-west of England looks around 10C above average on December 9
But, despite hints from BBC weather forecasters that something maybe afoot in terms of something colder than usual from mid-December, years of disappointment have taught me to just take winter as it comes. Meteorological models this morning look anomalously warm for the first half of December, the UK being on the warm side of an anticyclone centred over France – the theme of so many winters I can remember.
The current phases of ENSO and QBO suggest that their influence on our winter this year will be far less marked than last year. Looking at teleconnections with a slight La Nina and the current QBO cycle have revealed winters that were fairly uninspiring though by no means write-offs for snow, two examples in the case of QBO being 1985/86 and 1990/91 – both had very cold Februaries.
Before I got too bogged down with trying to find patterns here I decided to move on to my more traditional pattern-matching.
Before I trawled through the figures my initial gut reaction to this winter was that it would be the coldest for at least four years – a not-too-difficult feat giving the mildness of the last three winters which saw very little in the way of snow.
The overall mean temperature for December, January and February came out at as4.2C – 1.2C colder than the 1981-2010 average, with average precipitation.
A rather cold winter, over three months doesn’t tell you much. A very mild and stormy December could mask a dry and notably cold February. This makes it worth looking at the individual months of each winter.
There is a lot of spread in the above tables. Considering them altogether I would guess winter will unfold in the following way:
December to start mild, possibly becoming very mild, before beginning to turn very cold mid-month. This pattern will persist, with varying intensity through into January which could also be very cold. Milder conditions to follow in February though this will probably end a fairly average month and drier after a slightly wetter than average December and average January.
As well as my method of using rainfall and temperature I also considered other methods. One was Russian research that states that the weather pattern in the winter will be the opposite to the weather on September 17th and November 7th. This autumn September 17th was N’ly and November 7th was NNW’ly. So, this would suggest a continental flow from S and SSE.
You can read the method of how I reached my conclusion here.
Sections of the tabloid media have been going into overdrive these past couple of weeks with tales that the UK will soon be in the grip of an Arctic freeze – one headline in the Daily Express boasted that parts of the UK were in for FOUR MONTHS OF SNOW.
The Daily Express ‘forecast’ was published at the end of September
These stories are nothing new though they seem to be published earlier and earlier in the autumn. By the time we reach November – once the traditional time when winter forecasts started appearing – the tabloids have already turned their attentions to spring. Much of it is just ‘clickbait’ – a means for publishers to prove their stories are being read to keep their advertisers happy, a symptom of an industry in financial dire straits.
There will be snow somewhere in the UK during the next five months but predicting heavy snowfall in a given area, such as London, is impossible. But given the outrageous claims at such a long way from the start of the season on December 1st I decided to have a look to see if there is anything wintry on the horizon.
I started by comparing a range of historic datasets, including quasi-biennial oscillation (QBO) and el niño–southern oscillation (ENSO), against monthly mean temperature and rainfall anomalies. Because ENSO data only goes back to 1950 the findings are obviously far more restricted than my winter forecast method which uses local data going back to 1797.
The results of my data trawl are underwhelming. The best fit years were as follows:
For anyone who likes snow the above is not encouraging, however, given the past year which has seen several daily and monthly records shattered, including a record warm December, who’s to say that recent warm temperatures will suddenly swing the other way.
The above table would also suggest that the coming winter will be colder and snowier than the previous three – but that gives little away given how mild the past three winters have been.
October 2016 has seen a strong blocking high become established over Scandinavia, the earliest this has happened since 1881.
A study of mean temperature anomalies in London since 1950 suggest that sudden swings, both positive and negative, are becoming more likely. Last month was the fifth month in a row that I recorded a positive anomaly – the longer this goes on the more likely it is the mean could turn negative – though bear in mind that I have recorded 12 months in a row of positive anomalies, from February 2011 until January 2012.
Current weather also suggests that something maybe afoot with the earliest establishment of a strong anticyclone over Norway (the fabled Scandinavian high) since 1881! This weather pattern gives the south-east its best chance of snow with the feed of cold air often coming all the way from Siberia. Time and again, however, I’ve seen these patterns break down in November just as everyone starts talking about an imminent severe winter. There is more than an element of truth to the saying:
Ice in November to bear a duck, rest of winter will be slush and muck
In conclusion, while the early figures look bleak for snow in the low-lying south-east, it is still far too early to tell if the coming winter will be mild or cold.
On a Saturday closest to full moon in July thousands of cyclists congregate in London Fields and ride 200km through the night to Dunwich on the coast of Suffolk.
Weather stats for London during the Dunwich Dynamo
Modestly described by the organisers as a “gentle bike ride to the beach, through soft country on good roads” the hours of darkness present a huge challenge for participants.
Michael Barry, the retired Canadian professional road racing cyclist, rated the challenge 5/10, harder than the 280 mile London to Paris ride which he ranked only 2/10.
Taking place in summer you would expect long hours of moonlight to be a welcome assist for these brave souls who peddle hours through the night to reach their goal. A look at the synoptic charts and statistics of each ride, however, reveals weather that is often a long way from being summery.
Looking in detail there appears to be very little chance of the ride coinciding with a heatwave. In 1999, 2003, 2004 and 2014 riders left the capital during days where the mercury reached above 80F (26.7C) – though this represents only 17% of starts. Temperatures around 70F (21.1C) are much more common.
Over 40% of the rides have seen over 1mm of rain on the opening day, this falls to 17% on the second day – a dry end to the marathon challenge is perhaps to be expected.
Patrick Field, of the London School of Cycling, said that 2007, the wettest start day to a Dynamo, was “gloriously wet”.
Perhaps what this blog also reveals is that UK weather at full moon, even in high summer, is notoriously unpredictable. Luke Howard , the father of meteorology, tried for 50 years to
prove a link between the weather and phases of the moon, but died still mystified at the ripe old age of 91.
Low pressure centred along the south coast brought a ‘gloriously wet’ Dynamo in 2007.
A movie of all synoptic charts highlights just how unsettled this time of year can be found here.
* The author is planning to take part in this year’s event to raise money for Cancer Research.
** Full stats for the weather in London during the Dunwich Dynamo back to 1992 can be found here: https://onedrive.live.com/redir?resid=A148835276FAFDEE!2561&authkey=!AEMmoeUZRVSq7uU&ithint=file%2cxlsx
Before I’m accused of going all Daily Express the following is based on winter statistics for the London area and other variables rather than the latest expert hopecast.
Even before looking at the data in depth the chart below shows that a warmer than average summer is more likely after a mild winter. The winter just gone was the third mildest in a record going back to 1797.
There are some real corkers in that list, including 1995 when this area recorded the driest August on record. Other notable summers included 1990 – England in the semi-finals of the World Cup and another notably fine August: the then hottest UK temperature was set that year when a maximum of 37.1C was recorded at Cheltenham – a record that lasted until 2003. The year 1989 also stands out with a notably sunny summer.
So far, so good. But what about rainfall? Some 145mm of rain fell this winter – pretty much on the nose average for this region. Combining warm winters with similarly average rainfall gives the following list.
Though some years have disappeared there are still some decent summers, and notably sunny too. The year 1975 stands out as does the sunniest summer on record, 1911! Both were also very dry summers.
Altough the teleconnection with El Nino is tentative in our part of the world the winter seemed to follow the pattern of most positive ENSO episodes, so it is worth having a look to see where the data goes. The latest forecast by NOAA suggests:
A transition to ENSO-neutral is likely during late Northern Hemisphere spring or early summer 2016, with a possible transition to La Niña conditions during the fall.*
If the forecast goes to plan the second ‘rainfall list’ would narrow further:
Viewed by graph reveals that ENSO values of all the years decreased over the course of the year. Series 1 is 1998, series 2 is 1983 etc.
In conclusion, the results would suggest that there is a 66% chance of a decent summer with below average rainfall and above average sunshine. In terms of details June 1st is still a very long off in meteorological terms – so whether it includes any heatwaves that would put it my premier league of hot spells is anyone’s guess at this range.
If it’s anything like 1959, 1975, 1983 or 1998, however, I think most folk will be happy.
*The above contradicts some forecasts which suggest a continuation of the general pattern that persisted during the winter: warm SSTs in the Atlantic / warm water south of the Grand Banks were largely responsible for the cyclonic westerly type of weather that caused the mild weather. In summer this would cause changeable weather rather than long spells of settled weather.
Over the past few days there has been a lot of speculation on the possibility of a sudden stratospheric warming event happening. These events can contribute to unseasonably cold snaps in winter though exactly where their effects happen on the globe is impossible to forecast at small scale resolution.
In short it looks like the eastern US is most likely to see any severe cold weather from this episode – what seems to happen a lot in recent winters in the UK.
Far from being an expert on this there was a very good posting on the usenet forum uk.sci.weather by Stephen Davenport.
“A temporary wind reversal is likely in the upper stratosphere; for example, see ECMWF at http://www.geo.fu-berlin.de/en/met/ag/strat/produkte/winterdiagnostics/, and have a look at the off-the-chart EPV (although not so much poleward). However, I do not see this as a major SSW (by definition) and everything points to a recovering but weaker circumpolar vortex mid-month onwards.
“That opens the door to Arctic air pouring far southwards, and there’ll be snow chances at least as far south as the Tennessee Valley. Incidentally there is a risk of another Nor’easter around Feb 9th-10th.
“Downstream a mid-Atlantic ridge could build rather strongly from the subtropical high towards Greenland with slowed zonal flow but most likely surface low pressure developments eastern Atlantic / near the British Isles.
“If the long wave pattern shifts a little eastwards then the increased meridionality *could* see LP progression pull in temporary subsequent N-NW flows for the UK – a more likely route to short-lived cold shots than via any high latitude blocking in the medium range.
“I think that elsewhere people have got hung up on the stratospheric warming and, as so often, drawn excitable conclusions. Cold impacts are more likely for the eastern U.S. than Europe with a displaced rather than a split vortex; and the circumpolar vortex was so strong first half of winter it was always going to take a lot to break it down fully. And sure enough, as noted there should be a recovery after this “attack”. You can see the vortex distortion and latterly the beginnings of recovery in this rather nice animation of 10hPa potential vorticity:
“GFS has occasionally pulled out a split vortex at various levels during the past week but doesn’t now.
“That’s not to say that a possible further warming (early final warming?) wouldn’t bring colder chances from the end of February into March.
“I was surprised to read recently that a well-known online forecaster had predicted significantly cold/blocked conditions for Europe in January via a major SSW. A bit premature, that.”


 Forecasters say today is likely to be the hottest June day for 40 years though I’d be surprised if we exceed the 34.2C recorded on June 27th 2011. It would be the fifth day running that 30C has been reached in this area, enough to fulfil the World Meteorological Organisation’s


 The overall mean temperature for December, January and February came out at as
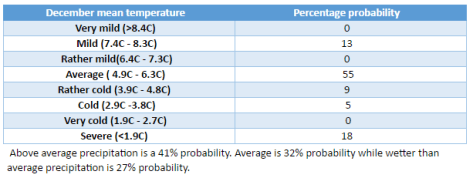


You must be logged in to post a comment.