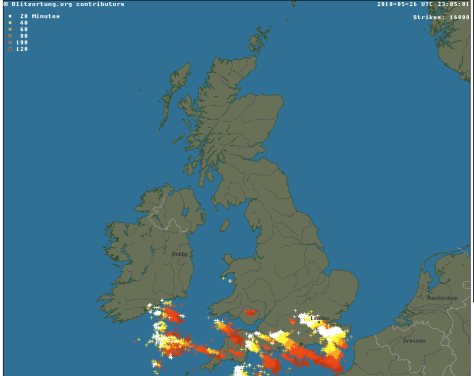
Last night’s intense thunderstorm was probably most notable for its high-level sheet lightning than rainfall, thunder or fork lightning.
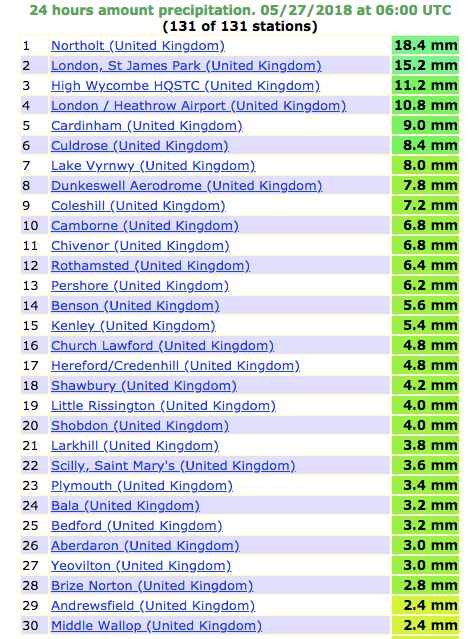
At my own station I recorded 4.8mm of rain which at its heaviest fell at a rate of 24.1mm/hr at 0046. To put that into perspective that’s just under a quarter of the rainfall rate during the thunderstorm at the beginning of last June. Rainfall in nearby Woodford Wells fell at a rate of 35.6mm/hr at 0040.
The rainfall was much heavier to the west of London.
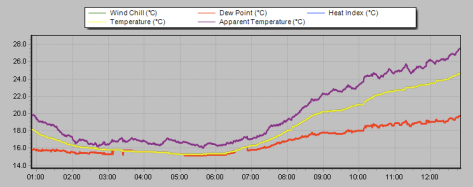
Also of note was how warm the night was. A low of 15.3C made it the 8th equal warmest May night since 1959.
There’s probably going to be a few more storms this bank holiday weekend though it remains to be seen whether this is going to be a classic summer for storms.
At it’s peak at 2305 there were 16800 strikes, according to Blitzortung.
Firefighters were called to a house fire after this house in Essex was struck by lightning overnight. Crews said the entire roof was alight pic.twitter.com/fUSt9jMSgN
The 27th was fairly quiet but with abundant sunshine and little wind it wasn’t long before more storms, this time homegrown, developed over the Midlands and the south. Severe flash flooding was reported in the Selly Oak area of Birmingham after a month’s worth of rain fell.
Reports of severe flash flooding across the city and beyond. This is the scene on Hubert Road in Selly Oak. Please only travel if it’s an emergency as the roads are becoming treacherous. (Video: Alexander Walters) pic.twitter.com/8gA0jjG03R
And as dusk approached a huge storm toward to the north-west of London and Chilterns. With little wind the storm stayed more or less in situ, expending all its energy with the most amazing lightshow – lightning within cloud that became more and more vivid as darkness approached.
Because these storms can reach heights of 29,000ft – roughly the height of Everest – they can be seen from over 40 miles away.
I had a go myself.
Not bad but the best footage I’ve seen was captured by Simon Cardy from east London and can be seen here.
Less than 24 hours after a spectacular lightning display, we have another one! pic.twitter.com/3qnZw9sIb3
It is 194 years ago this week that the River Lea burst its banks in the Stratford area leading to an ‘inland sea’ forming on nearby marshland.
Days of heavy rain that started on the 12th sent the water rising to record levels, the height was 2.5 inches higher than the devastating flood of 1809.
Luke Howard, in an entry in The Climate of London, had measured nearly three inches (74mm) of rain by the 16th and was expecting a flood:
“Towards evening the waters rose suddenly in the Lea and passing over all the banks of the level soon filled the marshes and in the course of the night rose to an unprecedented height being two inches and a half higher than in the flood of 1809.
The houses in the marshes south of the road were filled nearly to the chamber floors and some of the inmates removed with great difficulty. The flood remained stationary for nearly 24 hours. On the 17th in the afternoon it began very gradually to subside and on the 18th in the morning was much abated; the marshes still presenting the appearance of a sea the tops of the trees appearing in places only.”
Though there are no reanalysis charts from the time Howard’s daily entries state that pressure was low with the wind in the north-east, a classic pattern where depressions can move along the Channel before getting ‘stuck’ in the North Sea. A similar pattern with an almost identical amount of rain caused severe flooding in June 1903.
There was some 96mm of rain recorded during May 1824, locally the 11th wettest back to 1797. There have been wetter Mays since but, thanks to massive investment in the River Lea Navigation , prompted by more devastating floods in 1947, widespread flooding is a thing of the past.
The area around where Luke Howard’s factory once stood
Walthamstow Marshes were flooded to a depth so great that many trees briefly disappeared
“Worst floods ever!” Hyperbolic reporting of weather events is nothing new; whenever the UK is hit by the latest named storm breathless news anchors often try to portray atrocious conditions as ‘unprecedented’. This may soon change thanks to a project that uses citizen science.
Operation Weather Rescue, the citizen science project which last year processed Ben Nevis and Fort William data from between 1883 and 1904, has now recovered thousands of European observations from past Daily Weather Reports compiled from 1900-1903.
Though reanalysis data of the northern hemisphere back to 1851 have been available for some years the maps don’t give enough detail to be able to compare if an old storm has the same pressure characteristics as a modern storm. Evidence of impacts is restricted to fixed observations such as temperature, rainfall and archive press reports.
Weather Rescue: “We want to learn about the frequency of intense storms in the past to compare with now and these rescued observations will significantly improve our understanding.”
The latest release of data features pressure plots from June 1903 that tie in with the record-breaking 59-hour deluge that left much of the London Borough of Redbridge underwater. The following October, nationally, was the wettest month ever recorded in the UK.
Further recovery of these archived data, with the help of thousands of volunteers, will prove invaluable to our understanding of high-impact weather, and if storms are getting worse.
This latest example of Big Data could also offer huge benefits to the insurance and reinsurance industries, as well as planning engineers, as the resolution of climate models steadily improve.
But on a purely weather reporting scale it should also be possible to one day provide the media with a quickly accessible database of weather events going back over a century, enabling them to judge whether the latest storm really is the worst in 100 years.
In this age of clickbait journalism, however, I’m not holding my breath!
An article by the late meteorologist and broadcaster Philip Eden a number of years ago considered many of these patterns and found that, to varying degrees of reliability, they provided a guide to what the weather would be like at any given time of the year.
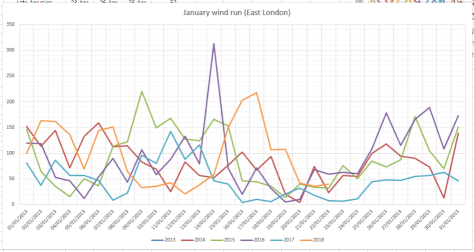
Considering climate change I wondered how much these patterns could still be relied on. Using my own pressure, rainfall and ‘wind run’ data (the total amount of daily wind) going back to the start of 2013 I had a look at the singularities for January and February
January patterns at the beginning, middle and end of the month appear to be the most reliable. However, it is only the ‘mid-Jan settled’ period that is most reliable.
The pressure trace most notably shows a general rise from the 17th, the date of last week’s windstorm, consistent with the mid-January settled singularity.Though this year’s ‘settled’ January spell saw rain the past 5 years have seen mostly dry weather.Very little wind has been recorded around January 20th for the past 5 years
The early Feb settled spell occurs with very low probability: just 56 per cent. And this year the pressure, according to the GFS model, plotted below by WXCharts.eu, is predicted to be around 1040mb by February 2!
This animation of the GFS model shows the idea of the Iceland low, which drives our SW’ly type weather, ‘taking a holiday’ to southern Iberia, possibly advecting any cold weather in the east to flood the UK
Looking at the results of the past 5 years it could be concluded that the patterns do still occur but because of the nature of the jet stream, which seems to meander far more readily than in the past, these stormy / quiet episodes are becoming shorter than they were in previous studies.
The 8th and 9th of August 2017 has produced probably the most miserable weather of this summer.
A rainfall event that began just after 8am on the 9th deposited nearly 36mm of rain in the Wanstead area over 14 hours.
The 09-09 total of 33.7mm made it the fourth greatest daily August rainfall since 1960.
The heaviest rain fell in a fairly narrow band, as shown by the official 24hr totals on ogimet.com. The low pressure system also produced a lot of rain for the east coast in the previous 24hrs with Bridlington recording over 56mm.
The rain brings the summer total to 207.7mm, just 0.6mm short of the amount recorded in 1997. Though it has been wet it is still a long way short of the wettest summer on record: some 391mm were recorded here in 1903.
In terms of temperature it has been a chilly start to August; the mean temp currently stands 1.2C below the whole month average. Considering CET it has been the coldest start to the month for 30 years.
Widespread heavy rain and gales across the UK have made the start of summer feel very unseasonal. But the conditions, which follow an extended period of mostly dry weather, are very typical for early June.
The pattern for June over the past 10 years reveals the month often starts unsettled before drying up in the final week
The ‘NW European monsoon’ is one of the most reliable ‘singularities’ on the annual weather calendar. Though it sounds very unscientific that the atmosphere can remember how it behaved on a certain date in previous years much statistical work over the past 170 years highlight tendencies for unusual weather at particular times of the year. These tendencies were first identified by the German climatologist, A.Schmauss, in 1938.
While the pattern isn’t set in stone statistics show that the probability of the euro monsoon occurring between June 1st and 21st is 77 per cent.
The GFS operational run suggests an unsettled outlook
24hr rainfall totals
Depression across the UK
One of the most notable inclement spells of weather in June happened during the D-Day landings in 1944.
0100 June 5 1944
12 June 6 2017
With the changes in ice at the North and South Poles, together with the massive positive temperature anomalies last winter, it would be thought logical that this would have some bearing on the general pattern this year. But polar ice is only one variable to consider when trying to predict the world’s climate.
The driest April since 2011 was also the seventh driest in a local record going back to 1797. Just 4.3mm fell, nearly half of which was recorded on the final day.
An ‘absolute drought’ that began in March coincided with the month; a run of 26 days with a daily total of <0.2mm! Dry early springs seem to be becoming a pattern in this area with eight of the last 11 Aprils being notably dry.
Though the mean temperature for April finished a fraction above average – 10.6C is 0.8C above average – it was a month of two halves. The month started warm with the temperature peaking at 25.4C on the 9th – Sunday of what was a warm weekend in London.
A polar low on 24th brought an unseasonably cold end to the month with cold days and night frost. Thunder was recorded on 26th and was accompanied by <5mm hail.
The total sunshine hours were just above average: 178.4 hours is 111% of the 1981-2010 average.
The wettest day occurred on the 30th with 2mm.
Air frosts: 1, Ground frosts: 7
Looking ahead, I think May will be another slightly milder than avrage month and continuing much drier than average.
Here follows the full weather diary for April. To view full stats follow this link:http://1drv.ms/1kiTuzv
1st: Cloudy into the late morning before some cloud breaks appeared. Brief shower and some warm sunshine but cooler than lately. Cold in early evening and cloud breaks overnight.
2nd: Sunny with variable cumulus. Variable cloud through the day and chilly overnight
Sunny with bubbly cumulus. 3rd: Cloudy but with bright breaks and blue sky in distance.
4th: Sunny and pleasant early with bubbly cumulus – this lasted all day.
5th: Sunny with just a few cumulus.
6th: Sunny with just a few wispy cumulus floating around, slight haze.
7th: Sunny and gin clear.
8th: Sunny spells with a few cumulus. Much cooler.
9th: Sunny with some cirrus and cumulus.
10th: Sunny though with lots of cloud at times.
11th: Sunny start then clouded over then sunnier again with cloudier periods.
12th: Early sunny spells, the cloud thickening by 11.30pm to leave a mostly cloudy afternoon. 13th: Cloudy though high base made it seem bright. Feeling chilly. A shower overnight.
14th: Bright start though with plenty of cloud around. Clear spells overnight.
15th: Sunny early though cloud increasing – a very light shower at 2.15pm.
16th: Cloudy, dull and cool. Some brightness at 2pm but then cloud thickened and breeze freshened to leave a cold afternoon.
17th: Sunny with variable cloud – clear overnight with ground frost.
18th: Sunny with broken cloud to start.
19th: Sunny start but clouded over, then sunny intervals.
20th: Cloud and mild all day.
21st: Very light drizzle to start then heavy cloud. Drizzle turned to light rain in Beckton but dry in Aldersbrook.
22nd: Bright start with broken cloud.
23rd: Bright early with patchy cirrus and altocumulus then completely cloudy and chilly. 24th: Some spots of rain around before moderate shower arrived at 5pm with 0.54mm falling.
25th: Sunny, clear start in polar air before cloud bubbled up around 10.30am. Then sunny spells – dew point stayed around or below freezing all day.
26th: Overcast and chilly with a cold breeze.
27th: Sunny, frosty start but cloud quickly bubbling up. Felt chilly.
28th: Mostly cloudy with the odd sunny spell
29th: Bright start but quickly turning cloudy
30th: Sunny early but gradually clouded over with rain at 1am. This stopped around 2am with small fall before 9am.
December 2016 was the driest 12th month in over 80 years and the 5th driest in a record going back to 1797.
Christmas day was the second warmest on record in London
The total fall of 8.3mm is just 16 per cent of what normally falls in December, marginally more than December 1933. The mean temperature of 6.1C was 0.5C above average, though 4C colder than the record December last year.
There were 51hrs of sunshine, that’s 125 per cent of average.
The wettest day was on the 10th when 5.2mm of rain fell. The warmest day occurred on the 9th with 14.2C recorded. The lowest temperature occurred on the 28th when the spirit fell to -4C.
The sunniest days were on the 4th and 29th when seven hours of sunshine were recorded.
Air frosts: 8, Ground frosts: 14
Fog, frost and black ice all featured during December
Though January has started on the chilly side in the short term the weather will turn mild. Beyond that there is a suggestion that the weather could turn on the colder side of average with some models suggesting a cold snap with snow around mid-month.
My usual method of prediction to the end of the month has been scotched by the very dry December. The only years that were similar were both far colder than last month – the usual pattern of a dry month being cold or very cold was broken.
With the unprecedented warmth at the North Pole, last year’s odd behaviour of the QBO and a weak polar vortex we are in unprecedented territory in terms of what could happen later in January. My hunch, though, suggests the month will end up average to rather cold with little precipitation. Any cold spell with probably be the short-lived variety with a couple of inches of snow that lasts three days.
So, to sum up, we’re looking at a mean of 4.4C, rainfall: 55mm, sunshine: 39hrs.
In view of the above my forecast last month was very poor: predicted mean 4.4C (result 6.1C). Rainfall: 55mm (result 8mm). Sunshine: 39hrs (result 51hrs)
I have also published a winter forecast covering the London area that you can find here.
Here follows the full weather diary for December…Full stats for the month here:http://1drv.ms/1rSfT7Y
1st: Sunny start though the frost lifted readily into low cloud and mist to leave a chilly afternoon.
2nd: Cloudy, quiet and cool weather all day.
3rd: Cloudy and quiet all day. Feeling cold.
4th: Sunny , frosty start. Quickly warming up to leave sunny, cloudless afternoon.
5th: Sunny start, then patchy cloud – this thickening before becoming foggy overnight.
6th: Misty start after fog overnight. Cloudy most of the day though there was a brief clearance around midday.
7th: Cloudy most of the day though there was occasional brightness.
8th: Dull day though with a little limited brightness early afternoon.
9th: Cloudy but wth more brightness than yesterday. Very mild. Cloud thickened with light rain around 11am. This gradually grew heavier as the day progressed and was moderate overnight.
10th: Bright start and feeling mild, then cloudier and damp.
11th: Cloudy and dull all day.
12th: Dull all day with light rain early and late. Clearer spells overnight but overcast again by dawn.
13th: Dull with bits and pieces of drizzle up to 11.20am.
14th: Bright start with lots of cirrus and altocumulus – this gradually cleared to leave a warm and pleasant afternoon.
15th: Dull and cloudy with limited brightness.
16th: Dull and cloudy start.
17th: Foggy and dull all day.
18th: Misty start with fog above 90m on cycle ride. Then dull and grey all day. Mild.
19th: Dull and cloudy all day – some spots of drizzle.
2oth: Sunny start but clouded over late morning. Cloudy thereafter with some drizzle overnight.
21st: Cloudy start then sunny. Cloud returned and turned dull and dreary in the afternoon with odd drizzle.
22nd: Bright, misty start
23rd: Cloudy start with breeze beginning to build as a result of Storm Barbera.
24th: Cloudy and dull all day. Very mild. Temp increasing overnight with approach of warm front .
25th: Cloudy, breezy start. Remained dull all day though brightness was seen over the Thames and North Downs, disrupting the SW’ly flow.
26th: Sunny, hazy start and turning colder.
27th: Sunny, frosty start, the air pressure record of 2012 has been broken.
28th: Foggy start, the fog persisting to late morning before sun broke through leaving a chilly afternoon. Frost returned quickly after dark, a clear night.
29th: Sunny and very cold and frosty start. Frost returning after dark with fog forming in the early hours.
30th: Foggy and dull all day, the fog thickening up at nightfall. Approaching cloud lifted the fog and temperature.
31st: Dull and overcast to start – this sticking around all day.
October 2016 was yet another dry month, a pattern that has emerged since the middle of June. Just 52 per cent of the October average was recorded.
October saw many pleasantly sunny days
The monthly mean finished 11.5C, 0.3C above average and ending a three-month run of warm temperatures.
Some 105 hours of sunshine were recorded, 98 per cent of average
Air frosts: 0, Ground frosts: 0
So what has November got in store weatherwise? The models on the 1st suggest an anticyclone anchored to our west over the Atlantic will bring a regime of, at times, chilly northerly winds and the potential for rainfall, much probably in the form of showers, driven by low pressure in the North Sea. Where skies clear at night there will be potential for the first air frosts of the autumn.
Beyond the grasp of the models my long range outlook method suggests an average or cold month is most likely: average and cold are both 30 per cent probability. Rather cold and severe are both 20%! There appears no chance of anything mild.
Rainfall appears that it will be skewed toward something above average at 40 per cent, though average and below average are both 30 per cent.
Sunshine looks average at 57 per cent probability.
So, to sum up, we’re looking at a mean of 6.8C, rainfall: 55mm, sunshine: 41hrs.
Numerous holes dug by squirrels appeared in October. The squirrels have no more an idea than we do whether winter will be cold
Here follows the full weather diary for October…Full stats for the month here:http://1drv.ms/1rSfT7Y
1st: Rainy start with showery bursts to 11.25am then through afternoon mostly cloudy.
2nd: Sunny but chilly, feeling very autumnal. Clearing into the evening with a cold night to follow.
3rd: Sunny, gin clear all day until 2.08pm.
4th: Another sunny albeit slightly hazy start then patchy cumulus. Warm in the sunshine even with a easterly breeze.
5th: Sunny start though breezy and with quite a few cumulus around. Cloud streets observed at 10.30am, the cloud tending to decrease and completely melt away by 4pm.
6th: Sunny start but with much cloudier spells at times. Warm in the shelter.
7th: Cloudy all day, the cloud thick enough at lunch time for drizzle that damped the ground.
8th: Cloudy with bursts of light drizzle in the morning, some brightness. A heavy shower at 2pm was brief then cloudy. Clear and cold overnight.
9th: Sunny until 2pm with patchy cumulus – a really glorious morning. Sunny spells in afternoon with cold night to follow.
10th: Sunny with just patchy cirrus first thing. Thick patches of alto-cumulus drifted across from time to time. Cold overnight.
11th: Sunny with patchy cumulus which melted away through the day. Showers after dark, one at 2330z.
12th: Cloudy and damp start. Short, sharp shower at noon then mostly cloudy.
13th: Rainy , wet start thanks to a streamer of moderate to heavy showers.
14th: Cloudy am but with lots of sunshine mid-morning before clouding over again though staying bright.
15th: Bright start but with lots of cloud pushing in and light burst of drizzle at noon. Cloud thickened before rain moved in after 5pm and fell intermittently through the night.
16th: Damp start as the remnants of the overnight rain cleared away, then becoming brighter at 11.15am. Sunny spells for a time before turning cloudier with some very sharp showers on yet another convergence line.
17th: Cloudy start but soon brightening up with some pleasant sunny spells. Heavy burst of rainfall at 5.30pm with more showers at midnight and early hours.
18th: Cloudy though quickly turning bright and breezy with long sunny spells after clearance of the cold front.
19th: Bright start though more cloud around than sun all day. Feeling colder than of late.
20th: Bright and breezy with variable cloud and sunny spells. A short shower at 2pm damped the ground. Clear spells overnight made it chilly. A shower at 9.30am.
21st: Cloudy and chily start.
22nd: Cloudy and cold start, brief clearance at 11am then sunny spells.
23rd: Sunny and clear to start though cold. Sunny spells into the afternoon. Cloudy overnight.
24th: Cloudy and cool during the day and overnight.
25th: Dull and cloudy with only limited brightness. Clear early evening with temp falling before it turned misty. Cloud pushed in raising the temperature.
26th: Cloudy start and turning very dull before bright spells spread in at noon.
27th: Cloudy though getting brighter through the morning with a brief clearance at noon, then bright and sunny intervals.
28th: Sunny and very mild to start. Sunny spells through the day.
29th: Cloudy start with bright intervals after midday. Clear spells after dark with fog forming after 11pm which gave a foggy start.
30th: Foggy start then cloudy and miserable.
31st: Fog to start then clearing at 11am. Gorgeous sunny day thereafter.
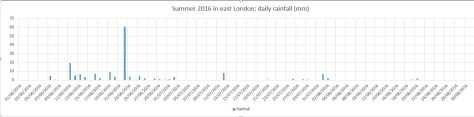
Summer 2016 turned out to be a very decent season overall, the mean temperature of 18.7C (1.1C above average) made it the sixth warmest summer since 1797.
While it wasn’t quite up there with the hot summers of 1976 and 2003 it still produced some notable records. The stormy beginning to June effectively ended with the Brexit vote, a period of 24 hours that coincided with the highest daily rainfall this area has seen since at least 1959.
The multi-cell thunderstorm in the early hours of June 23rd produced 60.8mm of rainfall, nearly half of the month’s total which became the third wettest June in a record going back to 1797. The high rainfall was in complete contrast to July and August and helped skew the overall figure: 168.6mm is 114 per cent over average summer rainfall.
With so much rainfall overall sunshine was affected with only 451 hours recorded, just 80 per cent of what can be expected in an average summer.
July produced another record, this time the highest overnight minimum recorded since 1959. The minimum of 21.1C was recorded during the early hours of the 20th – coming hours after the hottest day of the year: 33.5C – the 14th hottest day on record.
The warm and very dry theme continued into the final month of summer with the warmest August for 12 years, the 10th warmest and 12th driest since 1797.
My summer forecast, when the monthly probabilities are considered, was broadly correct though I didn’t estimate correctly just how warm it would be.


 3rd: Cloudy but with bright breaks and blue sky in distance.
 13th: Cloudy though high base made it seem bright. Feeling chilly. A shower overnight.


 With so much rainfall overall sunshine was affected with only 451 hours recorded, just 80 per cent of what can be expected in an average summer.
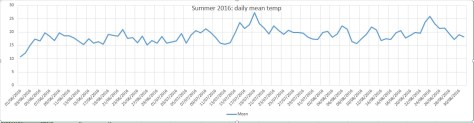


You must be logged in to post a comment.