December 2015 was a ridiculously warm month, the mildest on record in my local series going back to 1797.
The mean temperature of 10.9C is 5.3C above the average for the first winter month and breaks the previous record set in 1974 by an increadible 2.2C.
Indeed the month was warmer than what was a very mild November and was air frost free.
A persistent flow of air from the Azores was responsible for the unseasonal warmth
Sunshine was below average: 34.6hrs (86% of average) was the lowest total recorded since 2010, another December that was as exceptionally cold as this month was mild.
Rainfall was more run-of-the-mill: 44mm fell during the month: that’s 83% of average.
The warmest day occurred on the 19th with 16.3C recorded, the second warmest December day in my daily record going back to 1959 – the record fell short by just 0.1C.
Other daily records were broken including for daily mean temperature: 14.3C on Boxing Day smashed the previous record set on December 4th 1985 by 0.4C. This day also saw the highest daily minimum for December recorded: 13.5C. It was also the warmest Christmas Day on record in a series going back beyond 1852.
The lowest temperature occurred on the 8th when the mercury fell to 2.4C.
The wettest day was on the 3oth when 5.9mm of rain fell. There were only three completely dry days during the month. Thanks to the synoptic situation this area thankfully escaped the awful flooding which affected the north of England and Scotland.
There is quite a marked upward trend in the December mean since 1797
What has January got in store weatherwise? The models today (January 1st) suggest that low pressure will continue to pile into the UK from the west on quite southerly latitudes over the next week with some colder air infiltrating into the east and north of the UK from Europe with rain at times for our area. From that point on most output suggests largely unsettled weather continuing until the end of the two week period though there is a hint that high pressure may try to edge up from the SW or west later with less wind and rain but still mild.
Because of the exceptionally mild December there are virtually no figures I can work with to try to estimate January – but I’ll have a crack anyway, using figures that were at least 1C above the 1981-2010 December average.
A mean of about 5.2C with 59mm of rain, both around average. The highest probability is for average temps at 33% probability. Interestingly something ‘very cold’ comes in at the same probability. Rather mild and rather cold come in at 16% probability. I emphasise that even at such low probability my confidence is even lower.
My December outlook for temperature was way off – there was no chance shown of anything ‘very mild’.
Here follows the full weather diary for November. To view full stats follow this link:http://1drv.ms/1kiTuzv
1st: A few spots of rain after deluge overnight then cloudy.
2nd: Cloudy to start, some sun mid morning before it clouded over with two spots of rain. Mild overnight.
3rd: Cloudy start with little brightness all day. Rain moving in at 7.15pm and intermittent into the evening, clearing later with temp falling from midnight.
4th: Sunny, clear start, tending to cloud over at 11am with limited brightness.
5th Cloudy and windy all day – the wind peaking at 9pm but remaining fresh through the night.
6th: Cloudy and dull most of the day.
7th: Cloudy start with some light drizzle mid morning.
8th: Dull, drizzly start with steadier bursts. Heavy rain as front cleared through at 2pm. Evening and overnight much colder than of late.
9th: Sunny start, clouded over afternoon.
10th Cloudy start and through the day. Rain spreading in in the evening, clearing by midnight.
11th: Cloudy through the day until 2pm when a narrow band of rain passed through then dry and feeling cooler.
12th: Cloudy start with some drizzle around 10am.
13th: Cloudy and drizzly to start then just cloudy.
14th: Cloudy start with some brightness at noon. Cloudy into the afternoon with some drizzle overnight.
15th: Cloudy and dull. Rain later in the evening.
16th: Cloudy with two sunny intervals then cloudy with odd drizzle.
17th: Cloudy with odd brightness then rain at 5pm.
18th: Cloudy all day.
19th: Bright and breezy start.
20th: Dull start with heavy rain at 3.40pm. Then cloudy but clear by morning.
21st: Sunny start but quickly clouded over with rain.
22nd: Dull start with patchy drizzle up to 11.30am. More rain later with squall at 8pm.
23rd: Sunny start with cloud moving in then sunny spells.
24th: Sunny start quickly turned cloudy with heavy rain around noon, clearing to sunny spells.
25th: Cloudy start with light rain spreading in at 10.10am. Cloudy rest of afternoon with temperature climbing through the day for record warm Christmas day. Temp didn’t fall below 14C all night.
26th: Cloudy and warm all day. Temp fell to just 13.9C though the day then rose again to give the warmest December night on record, and also warmest December mean.
27th: Dull with brief burst of drizzle early then breezy and very mild. Clearer overnight and cooler than of late. Sunny start with pink clouds am.
28th: Sunny start with just a few cirrus. Mostly sunny through the day.
29th: Sunny start with brief heavy shower at 10.05am. Then sunny intervals.
30th Cloudy and breezy to start. Rain spreading in in the evening, stopping around midnight
31st: Sunny and clear to start but with cloud bubbling up from late morning. Brief rain after dark then dry and turning colder. Frost in early hours of 1st
The op chart for Christmas Day on 24/12 shows the UK split between influence from a low to the north of Scotland and a European high giving a balmy SW’ly . Rain moves up from the SW during the day. Temps in London rising to 13C after a low of 4C. Best chance of anything wintry northern Scotland
The odds for snow on Christmas Day have been shortened for those that live in northern Scotland, reflecting the latest operational model runs that suggest the current mild regime will continue in the south.
The operational runs of the weather model GFS began to include Christmas Day in its forecast on December 9. Admittedly T+384 is la-la land in terms of trying to accurately predict what the weather will be like on the day but I thought it would be fun to see how the outcome changes over the next two weeks or so.
William Hill odds for snow on Christmas Day:
9th: London 5/1; Aberdeen 5/2; Edinburgh 3/1; Glasgow 3/1; Newcastle 4/1; Belfast 5/1; Birmingham 6/1; Norwich Airport 7/1; Penzance 10/1
10th: unchanged. 11th: unchanged. 12th: unchanged. 13th: unchanged. 14th: unchanged. 15th: unchanged. 16th: London 8/1; Aberdeen 7/2; Edinburgh 4/1; Glasgow 4/1; Newcastle 5/1; Belfast 5/1; Birmingham 7/1; Norwich Airport 10/1; Penzance 16/1.
My predicted outcome for London made at the beginning of December: TMax: 7C TMin: 1C Moderate westerly 60% chance of rain shower 1hr of sunshine
Please note that the outcome will change markedly from run to run, day to day. The best hint of what the weather will be like will be from T=240z (10 days) and, reliably, T+120z. If the pattern is zonal then detail can only start being pinned down at T+72z.|
5C, variable winds with threat of rain approaching from south-west. Chance of wintry showers Liverpool northwards. Snow On Christmas Day 5/2 Aberdeen Airport 3/1 Edinburgh Airport 3/1 Glasgow Airport 4/1 Newcastle Airport 5/1 Belfast Int. Airport 5/1 Leeds Bradford Airport 5/1 Liverpool Airport 5/1 London Heathrow 6/1 Birmingham Airport 6/1 Dublin Airport 6/1 Manchester Airport 7/1 Bristol Airport 7/1 Cardiff Airport 7/1 Norwich Airport 10/1 Penzance RNAS CuldroseThe operational chart for Christmas Day on 10/12 shows ridging from the south allowing a brief spell of quiet weather. Temps in London a couple of degrees above freezing with frost at night. A flurry possible almost anywhere though east coast most likely.The op chart for Christmas Day on 11/12 shows a ridge bringing a brief spell of cold, quiet weather. Temps in London about 6C after a cold, possibly frosty start. Dry to start though increased risk of rain from the west later. Best chance for anything sleety probably Glasgow…The op chart for Christmas Day on 12/12 shows the UK in a col. Rain a possibility almost anywhere but chiefly in the SW and south. Temps in London about 6C and a low of 3C. Best chance for anything wintry probably Aberdeen toward midnight…The op chart for Christmas Day on 13/12 shows the UK in a returning N’ly regime. Heavy rain spreading in to SW and S. Temps in London about 12C and a low of 6C. Best chance for anything wintry in the far northThe op chart for Christmas Day on 14/12 shows the UK in a returning N’ly regime. Starting dry in the SE but rain spreading in later. Temps in London peaking at 13C after a low of 10C. Best chance for anything wintry in the far northThe op chart for Christmas Day on 15/12 shows the UK split between a returning N’ly regime and a large area of high pressure centred over Switzerland, advecting warm air from North Africa. Mostly dry across the UK with best chance of precipitation NW Scotland. Temps in London peaking at 10C after a low of 7C. No chance of anything wintry, anywhereThe op chart for Christmas Day on 16/12 shows the UK split between a returning N’ly regime and a large area of high pressure over central Europe, advecting warm air from North Africa. A band of rain lies across the UK though dry in the SE. Temps in London peaking at 13C after a low of 11C. No chance of anything wintry, anywhereThe op chart for Christmas Day on 17/12 shows most of the UK in a balmy SW’ly regime, controlled by a strong high pressure over central Europe. Air over the SE is all the way from the Sahara. Any precipitation confined to Scotland. Temps in London peaking at 11C after a low of 8C. No chance of anything wintry, anywhereThe op chart for Christmas Day on 18/12 shows the UK split between influence from a low centred over Iceland and a European high giving a balmy SW’ly . Air over the SE is from northern Spain. A band of rain heralds cooler air from the NW. Temps in London peaking at 11C and falling away during the day. Best chance of anything wintry Western Isles of ScotlandThe op chart for Christmas Day on 19/12 shows the UK split between low centred off north of Scotland introducing a cooler NW’ly airstream while south just about hangs on to the European high. A band of rain clears SE early on 25th from the NW. Temps in London peaking at 10C and falling away during the day. Best chance of anything wintry high ground in N England and northern ScotlandThe op chart for Christmas Day on 20/12 shows the UK split between influence from a low to the north of Scotland and and a European high giving a balmy SW’ly . Rain moves in from the west during the day. Temps in London rising to 12 after a low of 4C. Best chance of anything wintry northern ScotlandThe op chart for Christmas Day on 21/12 shows the UK split between influence from a low to the north of Scotland and and a European high giving a balmy SW’ly . Rain moves in from the west during the day. Temps in London rising to 12 after a low of 4C. Best chance of anything wintry northern ScotlandThe op chart for Christmas Day on 22/12 shows the UK split between influence from a low to the north of Scotland and a European high giving a balmy SW’ly . Rain moves up from the SW during the day. Temps in London rising to 13C after a low of 4C. Best chance of anything wintry northern ScotlandThe op chart for Christmas Day on 22/12 shows the UK split between influence from a low to the north of Scotland and a European high giving a balmy SW’ly . Rain moves up from the SW during the day. Temps in London rising to 13C after a low of 4C. Best chance of anything wintry northern ScotlandThe op chart for Christmas Day on 23/12 shows the UK split between influence from a low to the north of Scotland and a European high giving a balmy SW’ly . Rain moves up from the SW during the day. Temps in London rising to 13C after a low of 4C. Best chance of anything wintry northern Scotland
The run up to Christmas 85 years ago saw yet more terror in the form of Luftwaffe bombs falling on an already shellshocked population in east London.
The final raid of the year, on the evening of December 8th, saw yet more tragedy befall the borough of Woodford.
Just after 7pm a high explosive bomb fell in St Albans Road, killing three people. And at 10.25pm a paramine was dropped on Wordsworth Avenue, South Woodford, killing 14 people and injuring 41.
It was the second deadliest day of the Blitz for the two boroughs which had already endured three months of bombing raids that had left 27 dead and over 100 injured.
The weather was fairly typical for early December, some winter sunshine with a high of 6C followed by a minimum of 2C. Really cold weather didn’t arrive until much later in the month.
Over a period of eight months around 450 bombs were dropped on the two boroughs, killing 129 people and injuring 194.
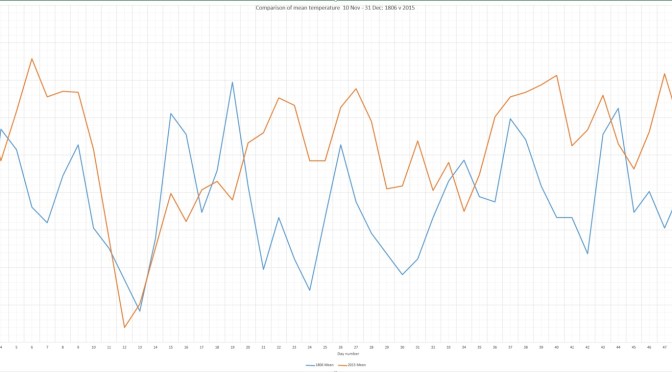
When I was writing up my winter forecast I came across an analogue that was very similar to what happened during the period November 10th to December 31st.
The period November 10th – December 31st in 1806 and 2015 show some striking similarities. It is also notable that mean during 2015 was 3C higher than 1806. Is this a question of synoptics or a warming world?
The results showed a close similarity between the two periods, November 10th – December 31st, though the mean in 2015 was some 3C warmer than 1806. Is this a question of synoptics or is this area now 3C warmer than it was just over 200 years ago?
Rainfall was also remarkably similar: 87.7mm fell from 10/10 – 31/12, just over 5mm more than 1806.
The period November 10th – December 31st in 1806 and 2015 show some striking similarities. It is also notable that mean during 2015 was 3C higher than 1806. Is this a question of synoptics or a warming world?
Luke Howard, in his first volume of The Climate of London, describes a very warm December that followed on from a warm November that fooled flora and fauna into thinking spring had begun early.
Howard’s statistics are very high: a November mean of 9.5C while December was 7.2C. CET that November was 2.3C above average while December was 3.3C above average. Considering the England Wales Precipitation series a slightly wetter than average November was followed by a very wet December – over 250% the monthly average.
“The catkins of the filberts expanded prematurely. On December 25th a hedge sparrow’s nest was taken at Doveridge, Derbyshire, with four eggs and near Warwick a green linnet’s with two eggs. It is worthy of remark that the heat was the same on December 24th as on June 24th last – on both those days the thermometer being nearly 60F.”
Howard goes on to describe how the south-west wind had “reigned for weeks” – for most of November and December before finally giving way at the turn of the year.
“The south west wind which had so long reigned yielded just at the close of the year to the north and west . Some frost ensued which, however, had not the characters of permanence being neither ushered in by driven snows nor accompanied with a dry and serene atmosphere.”
The period November 10th – December 31st in 1806 and 2015 show some striking similarities. It is also notable that mean during 2015 was 3C higher than 1806. Is this a question of synoptics or a warming world?
His description is not dissimilar from what is known as a “three-day toppler” cold spell where a dominant European high briefly gives way to cold air from the north-west or north, bringing often heavy snow to Scotland and the north but just a few cooler days in the south, before the cold feed is cut off as the high re-establishes itself.
Howard also describes how the warmth affected plants.
“The effects of the late high winter temperature on vegetation must have been obvious to everyone who has seen the country. To the very close of the year the grass continued to grow, the daisies to enamel the turf and many of the inmates of our gardens native and exotic to thrive and blossom. Even hyacinth bulbs left in the open beds shot up and flowered. Ten years ago winter came on six weeks earlier and with considerable severity.”
Words that echo what’s going on this month, particularly in the south-west where I’ve heard reports of roses still in bloom and affected by greenfly whiles daffodils look like they will be out in a couple of days.
January and February 1807 were, by the standards of that time, roughly average.
Over the next two weeks speculation on Christmas Day weather will inevitably build. Will Christmas be white or green?
At this range it is impossible to tell from standard meteorological models though from the 15th, 10 days before the big day and when models can start to be relied upon for at least a general trend, the pieces of the weather jigsaw will start to fall into place.
Latest odds offered by bookies William Hill for a single snowflake at London Heathrow are currently 5-1, slightly shorter than I’d expect at this time of year. With the predominance of the European high I’d expect those odds to start to lengthen.
In terms of proper snow falling and settling, there has not been a white Christmas in Wanstead for over 30 years. In 2010, we could still see the Christmas card Victorian snow scene in small patches if our gardens, but these were leftovers of a previous dump, so it doesn’t count. There has been snow on several Boxing Days in Wanstead (1995 and 1996) and in the weeks running up to Christmas, but not on Christmas day itself. The most typical Wanstead Christmas day weather is mild and dry, although it has rained on 13 of the last 34 Christmas days.
In an earlier blog I had a look at what the last 170 or so Christmas Days in London were like weatherwise and found that snow actually falling on the day is extremely rare. Since 1840 there have been just 19 occasions of snow or sleet falling on the capital on Christmas Day which equates to a probability of just under 11%. If you consider that the last ‘white Christmas’ (see note) was in 1996, then we are well overdue one.
But the weather doesn’t adhere to human created calendars and behave like it should on any given day. But patterns in any given year can sometimes repeat though correctly predicting they will happen is more down to luck. Nevertheless I’ve had another look at my calculations for this winter and see if there is any way I can make a prediction for Christmas Day.
I firstly had a look at Christmas Day stats overall since 1840. The most common group of maxima in the series is 8.1C and above. This occurred 70 times or 40%. I then had a look at the years that most closely follow this October and November. Ten years were on the list – two saw a white Christmas: 1938 and 1968. Snow often falls before and after Christmas.
So my guess for the weather on Christmas Day this year is for a maximum temperature of 7C after an overnight low of around 1C. With a 60% chance of rain in a stiff westerly wind there is a chance of something sleety falling.
But the fact that 20 per cent of the years in the above series saw a ‘white’ Christmas suggests that, unlike last year which I called right, there is at least *some* chance of snow falling. If you insist on having a flutter, however, Liverpool airport at 5-1 looks most generous.
Going on past form it is possible that Christmas Day will be the ‘changeover’ day for something a bit more wintry as we head into the new year – but it looks like the north Midlands northwards will be the main beneficiary of any of the white stuff
* The definition of a white Christmas used most widely – notably by the bookies – is for a single snowflake, even if it lands in the midst of heavy rain, to be observed falling in the 24 hours of 25 December at a specified location recognised by the Met Office.
** On average, snow or sleet falls in the UK 5 days in December, compared with 7.6 days in January, 6.8 days in February and 6 days in March. White Christmases were more frequent in the 18th and 19th centuries, even more so before the change of calendar in 1752, which effectively brought Christmas back by 12 days. Climate change has also brought higher average temperatures over land and sea and this generally reduces the chances of a white Christmas.
The final month of autumn was most notable for its warmth and lack of sunshine.
Rainy days were common through November. This system brought 5.6mm
The November mean was 10.5C, the third warmest on record back to 1797. Only 2011 and 1994 were warmer.
Just 31.7 hours of sunshine were recorded in this area: 54% of average, the dullest November for 47 years, and 9th dullest in the series going back to 1881
Rainfall was more run-of-the-mill: 64.3mm fell during the month: that’s 109% of average.
The warmest day occurred on the 6th with 17.2C recorded. The first air frosts of autumn were recorded. The lowest temperature occurred on the 21st when the mercury fell to -4.1C.
The wettest day was on the 3rd when 7.5mm of rain fell. There were only three completely dry days during the month – a real problem for anyone who works outside.
The beginning of the month was foggy
The sunniest days were on 21st and 22nd when four hours of sunshine were recorded.
What has December got in store weatherwise? The models today (December 1st) suggest the beginning of winter will be held at bay with most model output keeping the Atlantic in control of the weather – persistent high pressure to the SW, south and SE and a strong jet stream funneled between this high pressure zone and low pressure to the north and NW.
Winds throughout the first 15 days will be blowing from between SW and NW.
Because of the exceptionally mild November I wonder how accurate my long range method will be in estimating December – but in the interests of consistency I’ll have a crack anyway.
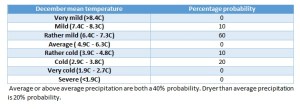
A mean of about 5.1C with 70mm of rain, on the wetter side of average and with average to slightly below sunshine. The highest probability is for rather cold at 50% probability. Average 25% and rather mild, suggested in my winter forecast, comes in at 25% probability.
My November outlook for temperature was way off. I predicted a mean of about 9C, rather mild, but the result was 10.5C, very mild. This chance showed at just 6% probability.
Here follows the full weather diary for November. To view full stats follow this link:http://1drv.ms/1kiTuzv
1st Foggy start, lifted to brief sunny spells early afternoon before mist thickened up again and saw Wanstead Flats’ fireworks cancelled
2nd Foggy start. This cleared earlier than yesterday but sunshine was weak
3rd Cloudy start though turned brighter at 10.30am. Spots of rain at 5.30pm then cloud and mild. Rain at first light
4th Rain to start then briefly brighter
5th Cloudy then rain from 2.30pm to 5.30pm. Mild and damp overnight
6th Short burst of rain at 9am then more at 9.45am. Further short bursts of rain but then mostly cloudy
7th Light rain to start, this grew heavier through the morning with quite gusty winds – the first of the autumn. Heavier showers earlier afternoon before the rain cleared at dusk
8th Cloudy with only brief brightness. A light shower in the evening
9th Cloudy through most of the day and very breezy. F6 at Walkie Talkie
10th Cloudy to start and very breezy. Spots of rain at 2pm
11th Cloudy through the day and breezy
12th Sunny start though cloud tended to fill in as breeze picked up from ‘Abigail’
13th Sunny start , gradually clouding over with some sharp gusty showers and a heavy one at 2pm
14th Light rain, becoming heavier though turning patchy around noon. Heavier again at 2pm. Petering out in the evening
15th Bright blustery start, the wind continuing through the day
16th Cloudy start with some initial brightness, then cloudy. Rain when we turned up at 8.45, heaviest at 10.45pm
17th Cloudy up until 1pm when it started to rain. Breeze began to pick up with gusty evening – 33.6mph was strongest gust since St Jude storm – wind moderated after 10pm but remained breezy
18th Sunny, bright start though gradually clouded over as breeze picked up. Some squally showers around, mostly south of the river with rain lashing off side of buildings
19th Cloudy start with light rain spreading in at 10am. Outbreaks of light rain until lunchtime then a heavier shower at 3pm. Then overcast and cooler
20th Cloudy start – this cleared just before 1pm to give sunny spells. NW’ly set in through the day with ever cooling air. Sleet falling at 7am
21st Cloudy with heavy burst of sleety rain at obs time. Sky quickly broke to sunny spells but a very cold wind. A cold night
22nd Sunny and sub zero to start after heavy overnight frost. Sunny spells through the day, the frost returning at 2.50am
23rd Sunny, frosty start with some alto cumulus. Cloud grew thicker with rain before midnight that was light through the early hours
24th Cloudy start but with light rain spreading in from 11.30am then stopping and staying cloudy. More rain overnight
25th Light rain to start, stopping at 9.40am then cloudy. Temp dropped through the day with sunny spells
26th Sunny start then turned more cloudy at 11am
27th Cloudy start. Some warm sunshine late morning then turned cloudier with strong gusty squall at 7.30pm. Clear spells overnight that led to ground frost
28th Sunny start, clouding over at 10.30am before light rain spread at 2pm and then gusty winds after dark
29th Cloudy and breezy most of the day thanks to Clodagh
30th Cloudy and breezy with occassonal drizzle
Winter in the London area this year is likely to be average overall, following the pattern of the past two winters that saw little snow.
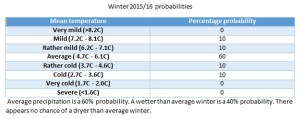
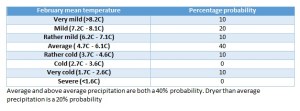
A rather mild December, dominated by a SW’ly flow with only brief, cooler, NW’ly incursions, will be followed by a rather cold January and average February. Rainfall throughout is likely to be average or slightly above. Probabilities of this scenario are listed in the tables.
The best chance of any snow is most likely to be at the end of January, though given the generally mild pattern it is not likely to last longer than two or three days.
Much has been said about how El Niño will affect this winter. The more hysterical parts of the media tell us we will see a repeat of 2009-10, a cold winter that saw frequent snowfall. But their assertion ignores the fact that other winters following a strong El Niñohave been exceptionally mild.
This autumn has shown some striking similarities with 1997, a record El Niño year, that was followed by a very mild winter in this area, the third warmest since 1797. This autumn was also similar to 1994 – another El Niño year – followed by the fourth warmest winter on record.
But just as you think the pattern is the same the El Niño this year is different in that it is an El Niño Modoki – a full-Pacific basin El Niño that differs from the one in 1997. In other words we really are in unfamiliar territory.
So before I get too bogged down in finding teleconnections with El Niño, perhaps it is wiser to go back to more traditional ways of trying to predict the coming season.
Before I trawled through the figures my initial gut reaction to this winter was that it would be mild – because of some blocking in September/October.
As well as my method of using rainfall and temperature I also considered other methods. One, of which I see mentioned very little these days, was Russian research that states that the weather pattern in the winter will be the opposite to the weather on September 17th and November 7th. This autumn September 17th was NE’ly and November 7th was SW’ly. So, of little use this year.
You can read the method 0f how I reached my conclusion here.
This chart shows that the coolest spell is likely to be around January 27th
The race to build more riverside property on London’s floodplain has received another boost after a big development on the Greenwich Peninsula was given the green light.
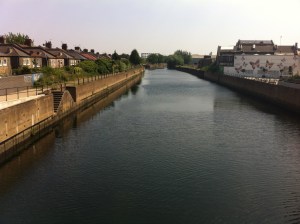
The Environment Agency’s Flood Plan map of the Thames
The Financial Times reported on Friday that Boris Johnson has given final approval to an £8.4bn, 12,700-home development that would transform this area of south-east London into a “high-rise urban village complete with film studio”.
Knight Dragon have already begun construction on the project, a 150-acre scheme approved 10 years ago in a more modest form but revived and expanded after the financial crisis.
The report mentions that local residents are concerned the scheme will place unbearable strain on the area’s transport links and that the size and density is out of keeping with Greenwich’s World Heritage Site of 17th to 19th-century buildings close by.
What is not mentioned is flood risk – a factor that, considering climate models, is deemed too minuscule to worry about. The proposed development satisfies this risk criteria – a report on the ‘Strategic Flood Risk Assessment’, drawn up in October 2011, mentions:
“Tidal flood risk is extensive, but at present Greenwich is fully defended against the 0.1% annual probability extreme tide level with climate change to 2107. A breach in the defences, although a low probability of occurrence, would have a high consequence, causing significant flooding of the Thamesmead, New Charlton and Greenwich Peninsula areas of the Borough.”
But is it wise to build on historic floodplain? Surely we should be looking elsewhere in London for safer sites for projects that will help ease the housing crisis.
The website floodlondon.com shares concern that developments such as these are at severe risk from a tidal surge when the Thames Flood Barrier nears the end of its working life in the middle of this century.
“Perched on the very tip of the Greenwich Peninsula, the O2 Arena finds itself ideally located on a nice sharp bend in the river where it is likely to take the full brunt of the surge as it careers into the bank, much like a racing car taking a corner too fast. The North Greenwich tube station just across the road will prove to be a great asset at this point as it funnels the water into the Jubilee Line.”
Before the Thames Barrier was built this part of the river has seen some catastrophic flooding.
The 1875 flood as reported in the Morning Post
In November 1875, a year that was only slightly wetter than normal, a record high tide of 8.9m was recorded at Blackwall. The figure is 1.36m (4ft 6in) higher than the greatest high tide at North Woolwich (Silvertown) this year, according to tide tables drawn up by the Port of London Authority (7.54m on March 20th).
The flood brought chaos throughout London – with this part of the river particularly badly hit. Much of the Isle of Dogs was inundated, North Woolwich Gardens were under 3ft (1m) of water while the water caused explosions at the Royal Arsenal. Elsewhere in the capital Eton College was ‘completely surrounded by water’. A correspondent for the Press Association said the damage caused on the banks of the Thames was estimated to cost £1m sterling – just over £103m at today’s prices.
The Sunderland Daily Echo & Shipping Gazette on Tuesday, November 16, 1875 reported a depth of water at East India Docks of 29ft 2in. Damage was estimated to be £1m sterling – just over £103m at today’s prices.
Since the flood of 1953 measures, including the Thames Barrier, were put in place to stop this flooding. The Environment Agency has outlined a range of options for the future of the Thames Estuary flood defences. None are particularly cheap. As a minimum, the EA estimates that the cost of maintaining the defences until 2035 will be around £1.5 billion, with an additional £1.8 billion needed to repair and upgrade the defences until 2050. Particular bits of marshland could also be set aside to store tide waters.
The EA estimates a new barrier could cost as much as £7 billion, though that figure could go up if conditions change significantly as the climate changes.
Greenwich Peninsula and another project, City in the East, which was announced last month will need proper flood protection and planning. I wonder if planners are as willing to invest in these defences as they are at making a tidy buck developing these riverside schemes. And do our politicians have the appetite to drive the legislation through?
The problem is that if the climate change does bring greater rainfall and an unprecedented sea-level rise it is the people living in these properties that will be faced with the problem of ever-increasing costs to fight off the risk of inundation.
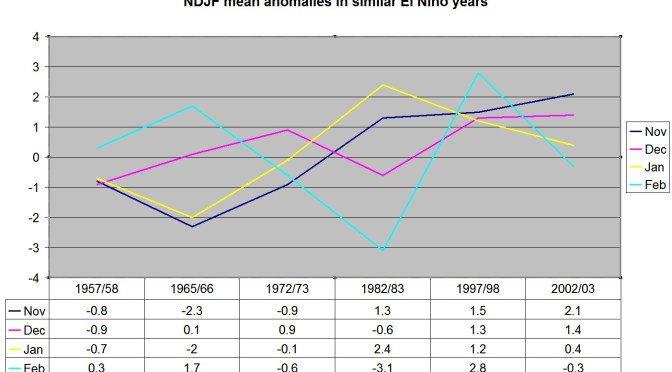
Much of the UK media has been very persistent in the past few months in saying that large positive anomaly El Niño years herald cold winters – basing their assumption on one year: 2009/10.
Whilst that winter was very cold, among the top 10 coldest of the last 70 years in this area, another El Niñoyear, 1997/98 – the strongest in recent history – brought London its third-warmest winter in a record going back to 1797.
When I had a look at ENSO data going back to 1950 a few months ago I found it impossible to find a definitive teleconnection between El Niño and winters in north-west Europe. However, now that we are midway through November, and with a fair impression of how the monthly mean will finish, I had another look.
NOAA data shows that the most similar El Niño years to this are: 1957, 1965, 1972, 1982, 1997, 2002. Taking in to account only mean temperature shows that November values have increased.
What does this mean for this winter? It is still impossible to tell and is just another variable to consider when the time comes to predict winter.
Tornadoes, earthquakes, heavy rainfall, abnormally low temperatures, pea-souper fogs and exploding meteors are phenomena that marked the Year Without a Summer around the world 200 years ago. But how did London fair?
The monthly anomalies of the two years closely follow the same pattern between March and August
When extreme weather affects Britain, such as the floods plaguing northern England and Scotland, conditions in the capital are benign by comparison.
There is not a great deal written in the press about the weather in London in 1816. So, as ever, Luke Howard’s The Climate of London, is a primary reference point.
After a wild end to 1815 that was marked with snow and lightning 1816 started dry, cold and frosty. Though cold by today’s standards January 1816 was fairly average and much warmer than the previous two when the last Thames frost fair was held.
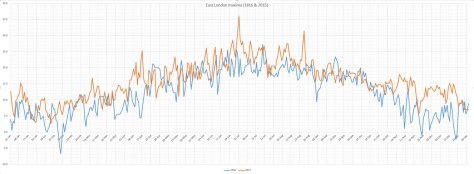
The highs and lows of 1816 and 2015 compared
Though the temperature reached 10C on 10th the rest of the month was marked with maxima around 6C and the odd frosty night.
Cold weather returned at the end of the month, turning severe in the second week of February. In the early hours of the 7th heavy snow, driven by gale-force north-easterly winds, brought possibly some of the worst winter weather this area has ever seen. Some 35mm of precipitation is recorded on the 8th – this would normally give at least one foot of level snow that could obviously be whipped up into huge drifts.
Luke Howard described the scene in his diary entry saying the abundance of snow “loaded the trees to their tops and weighed down the smaller shrubs to the ground.”
The snow and polar continental air also produced perfect conditions for a textbook radiative cooling night. The minimum recorded on the 10th: -20.6C has not, as far as I can tell, been repeated since.
To put that into perspective the lowest minimum of the severe winter of 1963 for this area was -12.2C recorded at Greenwich on January 21st. The coldest night I have personally recorded was -10.3C on January 12th 1987.
As often happens with severe cold snaps Howard reported on the 17th the the snow “was mostly gone but very thick ice remains on ponds”; a period of just under a week.
The cold snap saw the mean temperature for February over three degrees colder than average at 0.8C.
As well as keeping meticulous observations in Plaistow, Stratford and Tottenham, Howard always kept an eye on what was going on abroad and noted that earthquake activity was high.
On February 2nd an earthquake that ‘lasted nearly three minutes’ was felt at Lisbon. Three days later an earthquake was felt on Madeira.
“At midnight a severe shock of an earthquake was felt all over the island and the following morning at 4 o’clock another shock was felt.”
An extract of a letter from Captain Welsh of the Claudine described an event of an earthquake felt at sea on the 9th.
On the 9th of February off St Michael’s we experienced very tempestuous weather with a tremendous confused sea. The wind shifting from SW to SE and NE with constant lightning and heavy rain. On the 10th at 8.30pm, the ship then under reefed fore sail and mainstay sail, we were much alarmed by a severe shock of an earthquake which lasted four or five seconds.
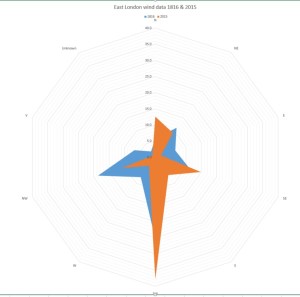
The dominant wind direction in 1816 was north-west
Later in the month on 23rd it was reported that the snow in the Grampian hills was at its greatest depth for 20 years.
Howard reported a heavy short snowstorm in the capital on March 4th. He also mentions another earthquake on March 17th that affected the north of England in towns and cities including Doncaster, Bawtry, Blyth, Carlton, Worksop, Sheffield, Chesterfield, Mansfield, Nottingham, Lincoln and Gainsborough.
“A smart shock of an earthquake was perceptibly felt in Lincoln at about 12.50pm. The undulation appeared to be from west to east and lasted from about a minute and a half to two minutes.
“Pictures and other articles hanging on the walls were set in a swinging motion. At Newark also and the neighbouring villages the shock was distinctly felt as well as at Leicester and Loughborough.”
Snowy episodes in the capital lasted well into April. On 12th snow fell for two hours “turning the high ground of Hampstead in the distance white”.
Very high tides were reported on the 15th with “much water out in the marshes”. By the 19th it was noted that the growing season was being severely hampered by the cold weather
April 1816 was nearly 1.5C below average. Despite this, by the 21st, the first swallows began to appear.
May and June were again cold. More than twice the average rainfall in June suggests the weather in the sixth month was very disturbed.
On the 25th a tornado, strong enough to carry objects weighing 60lbs, was reported in the Edgware Road area.
At two o’clock being a still sultry day a whirlwind passed over the nursery ground of Mr Henderson in the Edgware Road which lifted seven lights from the greenhouses and carried them to the height of the highest elm trees, each of the lights weighs 50 or 60lbs at least. At the same time two garden mats were carried to an immense height so that the eye could not distinguish them.
The following day “extremely heavy and prolonged rain from 9am (26th) to 9am on 27th gave 2.95 inches”. This total of over 52mm is notably high though not a record.
Overseas, meanwhile, the weather continued to confound observers. Several inches of snow fell in Quebec on June 8th while a letter from a friend of Howard mentioned a reading of -38F that had been recorded in New Hampshire earlier in the season.
July and August were similarly cold and wet. While events in London had quietened down Howard noted that the Kendal Chronicle was reporting snow on the summit of Helvellyn on July 4th while notable gales in Scotland were affecting ships.
More earthquakes shook locations around the world including one on August 14th in Scotland that caused panic and considerable damage in Inverness. Howard quotes a letter from north of the border:
“Last night, exactly a quarter before 11 o’clock the town of Inverness and the surrounding country was fearfully shook by an earthquake. We fled to the street where we found almost every inhabitant; women and children screaming and a very considerable portion of them naked. Many fled to the fields and there remained for the greater part of the night. Chimney tops were thrown down or damaged in every quarter of the town. The Mason Lodge occupied as an hotel was rent from top to bottom, the north sulk of the chimney partly thrown down one of the coping stones weighing, I should think, from 50lb to 60lb, was thrown to the other side of the street a distance not less than 60 feet.”
Elsehwhere in Europe the dreary summer and frequent thunderstorms inspired Mary Shelley to write Frankenstein. A summer vacation in Switzerland led her to spend much of the time indoors. She, along with Lord Byron and John William Polidori entertained each other with a contest to write the scariest story of all. The unseasonal conditions, along with this dare, led to the creation of Shelley’s Frankenstein: The Modern Prometheus— as well as Polidori’s novella The Vampyre and Byron’s long-form poem, The Darkness.
Though it is known as the Year without a Summer 1816 was actually only the 8th coolest summer in the local series going back to 1797. There were also 21 wetter summers – the 250mm that fell was actually less than half the rainfall of summer 1960.
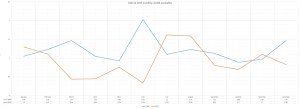
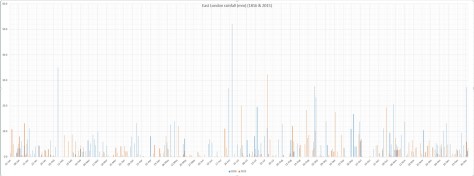
1816 & 2015 compared: monthly rainfall anomalies
A change of month in September failed to bring a change in the weather and the mean temperature continued 2C below the average for the period. Howard mentions a 9-week tour of Europe at this time – his laboratory and climate reading duties left in the hands of his friend and partner, John Gibson.
Howard’s account of his tour explains how excessive summer rains had made life difficult from Amsterdam to Geneva.
“From the sources of the Rhine among the Alps to its embouchure in the German ocean and through a space twice or thrice as broad from east to west the whole season presented a series of storms and inundations. Not meadows and villages alone but portions of cities and large towns lay long underwater; dikes were broken, bridges blown up, the crops spoiled or carried off by torrents and the vintage ruined by the want of sun to bring out and ripen the fruit.
“While the middle of Europe was thus suffering from wet, the north for a time and to a certain extent was parched with drought and public prayers appear to have been ordered about the same time at Riga for rain and at Paris for sunshine.”
On September 16th Howard noted that a ‘dreadful’ hurricane had affected the Caribbean island of Guadalope. “Houses were levelled, plantations destroyed and the soil driven about like dust in a whirlwind.”
October 1816 was a blip during 1816 in that the mean temperature and rainfall were about average though Howard’s records reveal there were four air frosts.
By November the weather began mild but by the 6th the cold had returned with a brief snowy snap. A report from Chester said that day was almost night because of the thickness of the cloud:
“Candles or lamps were obliged to be lighted in all the houses this was succeeded by a slight shower. On Thursday successive falls of hail and rain took place. On Friday the frost was uncommonly severe and on Sunday the snow which fell was above 2ft deep in the streets.”
On the 14th reports came from France that a tempest on the night of the 11th and 12th had wrecked many ships: “winds blowing from the north then SSE”.
Chesterton House, off Balaam Street, Plaistow, was the home of Luke Howard from 1806-13. The building has since been demolished
A solar eclipse on the 18th was followed by a sustained build in pressure from the 22nd with fog now becoming a problem in the capital.
The Evening Mail on November 27th reported that the problem was particularly acute in South London.
“The atmosphere was so darkened yesterday morning in the vicinity of the metropolis by the thick fog combined with smoke that in some parts it appeared like a cloudy night. In the neighbourhood of Walworth and Camberwell it was so completely dark that some of the coachmen driving stages were obliged to get down and lead their horses with a lantern.”
After the average October November had reverted to type and the month in London finished just over 3C cooler than average.
Pressure began to fall with the arrival of December. On the 12th reports of a meteor were made from Glasgow and Perth. The phenomena sounded spectacular:
“The meteor made its appearance in the SW in the form of a small star and gradually increased in magnitude till it reached the zenith when it subtended an angle nearly equal to that of the full moon. In shape it resembled a paper kite. After passing the zenith it again seemed to diminish in size owing no doubt to its gradually receding from the observer till its altitude was equal to about 30 miles when it exploded like a sky rocket. The report of the explosion, which is described as more tremendous than the noise of the loudest thunder, reached the ear about three minutes after the meteor vanished so that it could not be less than 40 miles distant and probably about 27 miles above the surface of the earth. From the various particulars collected its diameter must have been about 240 yards. The light which it yielded was very considerable being sufficient to render the smallest objects visible.”
Two days later the air pressure fell to its lowest point that year: 966.1mb. In the early hours of the 15th Howard wrote of an earth tremor that lasted 15 seconds.
A brief cold snap arrived on the 19th with the temperature falling to -10C on 21st – by the 26th, however, the temperature reached 10C.
Though December was relatively milder than November the month still finished 1.5C below average with 1.5 times average rain.
1816 & 2015 compared: East London maxima1816 & 2015 compared: East london minimaEnter 1816 & 2015 compared: East London rainfall

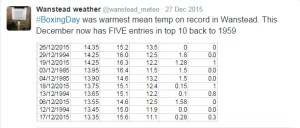
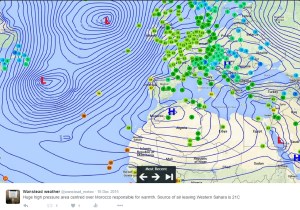
 Other daily records were broken including for daily mean temperature: 14.3C on Boxing Day smashed the previous record set on December 4th 1985 by 0.4C. This day also saw the highest daily minimum for December recorded: 13.5C. It was also the warmest Christmas Day on record in a series going back beyond 1852.
 The lowest temperature occurred on the 8th when the mercury fell to 2.4C.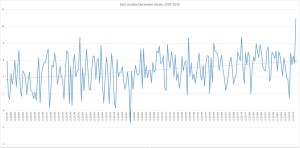


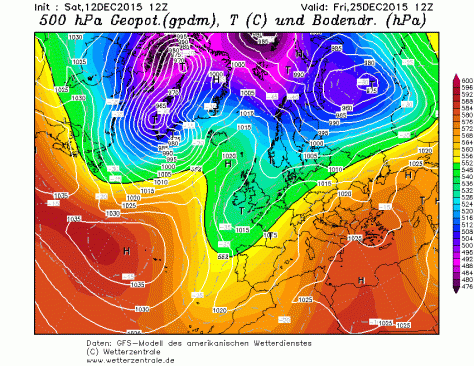






 So my guess for the weather on Christmas Day this year is for a maximum temperature of 7C after an overnight low of around 1C. With a 60% chance of rain in a stiff westerly wind there is a chance of something sleety falling.


 A rather mild December, dominated by a SW’ly flow with only brief, cooler, NW’ly incursions, will be followed by a rather cold January and average February. Rainfall throughout is likely to be average or slightly above. Probabilities of this scenario are listed in the tables.
 This autumn has shown some striking similarities with 1997, a record El Niño year, that was followed by a very mild winter in this area, the third warmest since 1797. This autumn was also similar to 1994 – another El Niño year – followed by the fourth warmest winter on record.
 So before I get too bogged down in finding teleconnections with El Niño, perhaps it is wiser to go back to more traditional ways of trying to predict the coming season.
 As well as my method of using









You must be logged in to post a comment.