There’s been some very interesting output on the weather models these past couple of days – not least the GFS’s dew points from Christmas Day into Boxing Day.
Very cold air from the east can be seen moving toward the SE of the UK to just across the North Sea – one run has the dew point down to -20C!
The outcome will be different but it’s been a fair while since I’ve seen this sort of solution in what is a relatively short timeframe.
The op chart for Christmas Day on 24/12 shows the UK split between influence from a low to the north of Scotland and a European high giving a balmy SW’ly . Rain moves up from the SW during the day. Temps in London rising to 13C after a low of 4C. Best chance of anything wintry northern Scotland
The odds for snow on Christmas Day have been shortened for those that live in northern Scotland, reflecting the latest operational model runs that suggest the current mild regime will continue in the south.
The operational runs of the weather model GFS began to include Christmas Day in its forecast on December 9. Admittedly T+384 is la-la land in terms of trying to accurately predict what the weather will be like on the day but I thought it would be fun to see how the outcome changes over the next two weeks or so.
William Hill odds for snow on Christmas Day:
9th: London 5/1; Aberdeen 5/2; Edinburgh 3/1; Glasgow 3/1; Newcastle 4/1; Belfast 5/1; Birmingham 6/1; Norwich Airport 7/1; Penzance 10/1
10th: unchanged. 11th: unchanged. 12th: unchanged. 13th: unchanged. 14th: unchanged. 15th: unchanged. 16th: London 8/1; Aberdeen 7/2; Edinburgh 4/1; Glasgow 4/1; Newcastle 5/1; Belfast 5/1; Birmingham 7/1; Norwich Airport 10/1; Penzance 16/1.
My predicted outcome for London made at the beginning of December: TMax: 7C TMin: 1C Moderate westerly 60% chance of rain shower 1hr of sunshine
Please note that the outcome will change markedly from run to run, day to day. The best hint of what the weather will be like will be from T=240z (10 days) and, reliably, T+120z. If the pattern is zonal then detail can only start being pinned down at T+72z.|
5C, variable winds with threat of rain approaching from south-west. Chance of wintry showers Liverpool northwards. Snow On Christmas Day 5/2 Aberdeen Airport 3/1 Edinburgh Airport 3/1 Glasgow Airport 4/1 Newcastle Airport 5/1 Belfast Int. Airport 5/1 Leeds Bradford Airport 5/1 Liverpool Airport 5/1 London Heathrow 6/1 Birmingham Airport 6/1 Dublin Airport 6/1 Manchester Airport 7/1 Bristol Airport 7/1 Cardiff Airport 7/1 Norwich Airport 10/1 Penzance RNAS Culdrose
The operational chart for Christmas Day on 10/12 shows ridging from the south allowing a brief spell of quiet weather. Temps in London a couple of degrees above freezing with frost at night. A flurry possible almost anywhere though east coast most likely.
The op chart for Christmas Day on 11/12 shows a ridge bringing a brief spell of cold, quiet weather. Temps in London about 6C after a cold, possibly frosty start. Dry to start though increased risk of rain from the west later. Best chance for anything sleety probably Glasgow…
The op chart for Christmas Day on 12/12 shows the UK in a col. Rain a possibility almost anywhere but chiefly in the SW and south. Temps in London about 6C and a low of 3C. Best chance for anything wintry probably Aberdeen toward midnight…
The op chart for Christmas Day on 13/12 shows the UK in a returning N’ly regime. Heavy rain spreading in to SW and S. Temps in London about 12C and a low of 6C. Best chance for anything wintry in the far north
The op chart for Christmas Day on 14/12 shows the UK in a returning N’ly regime. Starting dry in the SE but rain spreading in later. Temps in London peaking at 13C after a low of 10C. Best chance for anything wintry in the far north
The op chart for Christmas Day on 15/12 shows the UK split between a returning N’ly regime and a large area of high pressure centred over Switzerland, advecting warm air from North Africa. Mostly dry across the UK with best chance of precipitation NW Scotland. Temps in London peaking at 10C after a low of 7C. No chance of anything wintry, anywhere
The op chart for Christmas Day on 16/12 shows the UK split between a returning N’ly regime and a large area of high pressure over central Europe, advecting warm air from North Africa. A band of rain lies across the UK though dry in the SE. Temps in London peaking at 13C after a low of 11C. No chance of anything wintry, anywhere
The op chart for Christmas Day on 17/12 shows most of the UK in a balmy SW’ly regime, controlled by a strong high pressure over central Europe. Air over the SE is all the way from the Sahara. Any precipitation confined to Scotland. Temps in London peaking at 11C after a low of 8C. No chance of anything wintry, anywhere
The op chart for Christmas Day on 18/12 shows the UK split between influence from a low centred over Iceland and a European high giving a balmy SW’ly . Air over the SE is from northern Spain. A band of rain heralds cooler air from the NW. Temps in London peaking at 11C and falling away during the day. Best chance of anything wintry Western Isles of Scotland
The op chart for Christmas Day on 19/12 shows the UK split between low centred off north of Scotland introducing a cooler NW’ly airstream while south just about hangs on to the European high. A band of rain clears SE early on 25th from the NW. Temps in London peaking at 10C and falling away during the day. Best chance of anything wintry high ground in N England and northern Scotland
The op chart for Christmas Day on 20/12 shows the UK split between influence from a low to the north of Scotland and and a European high giving a balmy SW’ly . Rain moves in from the west during the day. Temps in London rising to 12 after a low of 4C. Best chance of anything wintry northern Scotland
The op chart for Christmas Day on 21/12 shows the UK split between influence from a low to the north of Scotland and and a European high giving a balmy SW’ly . Rain moves in from the west during the day. Temps in London rising to 12 after a low of 4C. Best chance of anything wintry northern Scotland
The op chart for Christmas Day on 22/12 shows the UK split between influence from a low to the north of Scotland and a European high giving a balmy SW’ly . Rain moves up from the SW during the day. Temps in London rising to 13C after a low of 4C. Best chance of anything wintry northern Scotland
The op chart for Christmas Day on 22/12 shows the UK split between influence from a low to the north of Scotland and a European high giving a balmy SW’ly . Rain moves up from the SW during the day. Temps in London rising to 13C after a low of 4C. Best chance of anything wintry northern Scotland
The op chart for Christmas Day on 23/12 shows the UK split between influence from a low to the north of Scotland and a European high giving a balmy SW’ly . Rain moves up from the SW during the day. Temps in London rising to 13C after a low of 4C. Best chance of anything wintry northern Scotland
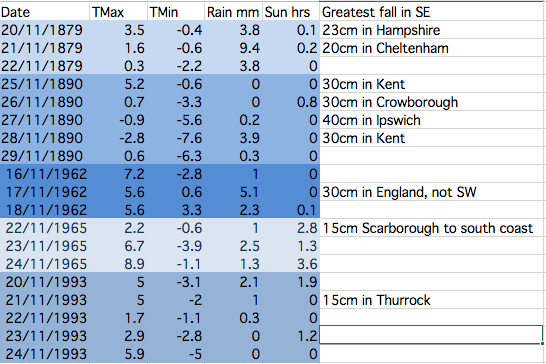
This table shows the stats for Greenwich during spells when there has been heavy snowfall somewhere in the south-east. The figures reveal that it is very hit and miss and that the associated air doesn’t stay cold for long. There is a link to UK-wide November snowfalls here: http://1drv.ms/1PjOB9H
November has produced some potent snowfalls in Scotland and northern England over the past 150 years. These brief shots of cold air, often direct from the North Pole, however very rarely produce anything that can sustain long-lasting low-level snow in London and the Home Counties.
With the GFS weather model occasionally hinting at a blast of polar maritime air I decided to have a look back through the records to see how frequently the capital has turned white during the eleventh month.
Anyone who is familiar with the Objective Lamb Weather Type (LWT) data series will know that there may be an increased likelihood of things turning colder at some point this month. Last month was the joint 5th most anticyclonic October in the LWT series data series that runs from 1871; resulting stats closely resemble both October 1946 and 1962 as being very anticyclonic. Another similar year is 1972.
November 1972 was mild till mid month and then turned much colder with snow in places. November 1962 was cyclonic till the 24th, and then anticyclonic, with a cold northerly outbreak from the 18th for a few days with snow, before turning rather mild. November 1946 in complete contrast to both years, was a mild, dull and very wet month.
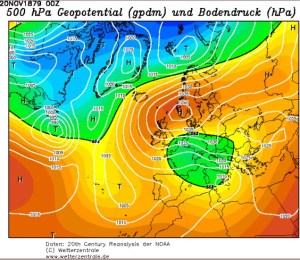
The most impressive November snowy spells seem to have occurred in the late 1800s. These two 500mb reanalysis charts show a cold feed from Scandinavia in both cases.
Snow and sleet falling in the London area is obviously much more common than snow lying. The snowiest Novembers were in 1919 and 1952 when snow or sleet fell for 10 days at Wallington and Hampstead respectively.
Kew saw snow or sleet on 8 days in 1919, while Heathrow and Northolt recorded snow or sleet on eight days in 1952.
This small article appeared on the front page of Reynold’s Newspaper in November 1890
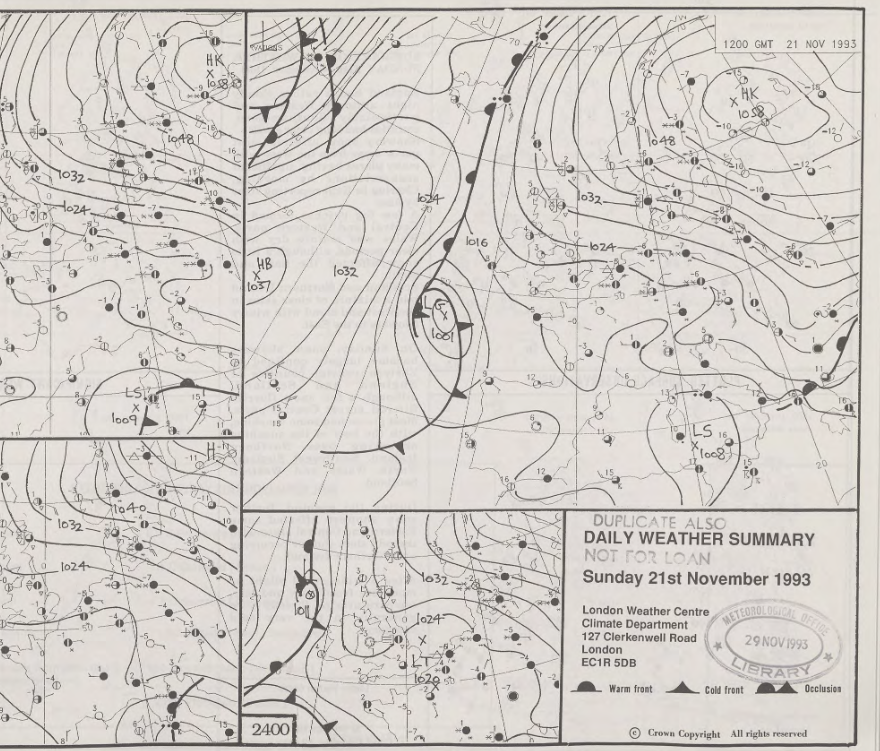
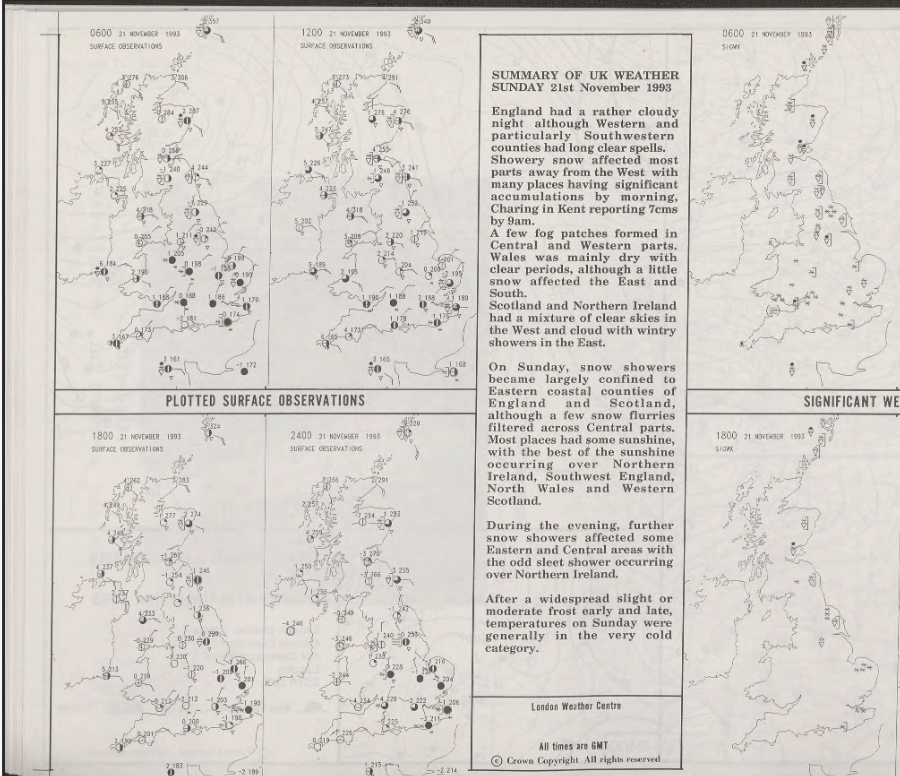
The only decent snowfall that occured in London in my lifetime was November 1993 – and I was abroad for that. I remember my dad mentioning it in a letter written to me as I travelled round China. It arrived in the early hours of one Sunday morning and fell to a depth of five inches.
Given that was the last time London saw a decent fall I won’t be holding my breath that we’ll see any this month – though, if you live in Scotland, the odds are much narrower.
Before 1861 information on snowfalls becomes scarce – at least in terms of correct quantity. However, heavy snowfalls obviously did occur. On November 17, 1816, the Inverness Journal contained this report:
“The winter has commenced with a severity almost beyond example. Frost, rain and snow have been almost incessant during the last week and the greater proportion of corn still uncut or in stocks has suffered material injury.
“We regret to say that several lives have been lost. A postboy of Bennet’s coming from the south was obliged to leave his chaise on the road and would have been lost but for the lights shown from the windows of Moyhall which he reached nearly in a frozen state. The obvious advantage of keeping lights in stormy nights in the windows of houses in the country has thus been illustrated
“The winter it appears has set in with extreme severity in the interior of the continent. At Augsburg on the 19th of November the eclipse of the sun was entirely obscured by a fall of snow which commenced at 7 o’clock in the morning and lasted till noon. The ground was covered with snow a foot in depth. There was a great fall of snow at Frankfurt on the same day and Reaumur’s thermometer showed at from 9 to 10 degrees below the freezing point.”
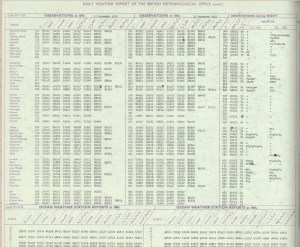
Perhaps the most impressive, modern day snowfall in the south of the UK occurred around November 18th 1972 when observers recorded 60cm of snow on Dartmoor. Synoptic charts and other data are attached below.
Image courtesy of the Met Office
Image courtesy of the Met Office
Image courtesy of the Met Office
Image courtesy of the Met Office
Inspiration for this piece came from Dr Richard Wild’s PhD study on snowfall which you can find here.
The weather model GFS (Global Forecasting System) has, for years, teased weather anoraks with mouthwatering possibilities of what the weather could be like 5 to 10 days away. Many ‘coldies’, that unexplained breed of weather anorak whom lust after extreme cold and snow every winter, often look at the end of the run, out to 384 hours, and cherry pick these charts, taking as gospel that the synoptics will come to pass, especially if there is high pressure plonked over Scandinavia.
But 16 days is an eternity in weather forecasting and what happens on the day is, more often than not, a world away from what was modelled a fortnight before. But it doesn’t stop the blizzard of toys and dummies being thrown out of prams, often by grown men who really should know better that the weather they really want is always 10 days away.
Is this about to change? Probably not but the improved resolution, from 27km to 13km, will massively improve accuracy at short-range.
In the meantime it is perhaps ironic that the final 18z operational run of the GFS 27km resolution model had some of the most mouthwatering solutions for classic cold and snowy winter weather for nearly two years. But, just for a change, the operational is backed up by the ensemble.
Here are most of the 500hPa charts from that last run


You must be logged in to post a comment.