A look at local east London stats shows that six of the last 10 Junes have been warmer than average while half have been much drier than average.
I’ve put together a few top 10s of stats for Wanstead, St James’s Park and Heathrow for the month of June.
Probably most notable from the below values is that recent Junes have been devoid of extreme cool temperatures and rainfall.
Snow has been known to fall in June, in 1975.
Rain is usually most frequent in the last week of the month.
The 10 driest Junes were:
Some UK May values according to TORRO
Hottest: 29th 1957: 35.6C at Camden Square, London. Also Southampton 28th 1976
Coldest: 9th 1955: -5.6C at Dalwhinnie, Highland. Also June 1st and 3rd 1962: Santon Downham, Norfolk
Wettest: 28th 1917: 242.8mm at Bruton, Somerset
In terms of climatology June maxima, considering the 1981-2010 average, shows a gradual increase through the month, though around the 19th to the 21st there is often a dip before a warm end. This would reflect the June Monsoon which occurs every year at 77 per cent probability.
The average rainfall graphic reflects this, showing a four-day wetter spell after the 20th.
This May will probably be most remembered for the number of thunderstorms affecting the area. I recorded an unprecedented (in my memory) four consecutive days of thunderstorms.
Convective clouds build over Wanstead Flats
It was also warm with a couple of days making the top 10 of hottest days since 1959. The mean temperature finished 15.1C, 2C warmer than average, the warmest May for seven years and the 8th= warmest since 1797.
Rainfall at 65.5mm was 128 per cent of average and slightly drier than last year.
Some 244hrs of sunshine were recorded, 134 per cent of average, making it the sunniest May for 7 years, and the 11th sunniest since 1881.
Spring finished with a mean temp of 11C, 0.8C above average, 1C cooler than last year. Rainfall at 181.9mm, was 135 per cent of average, making it the wettest spring for 10 years. Sunshine of only 411.2 hours made it the dullest spring since 2006.
The thundery end to spring has probably built everyone’s hopes up that we’re about to experience a summer with plenty of fireworks in the atmosphere. But the current pattern that brought four consecutive days of thunder (the whole year average is 3.5!) – a continental influence on our weather – could just as easily flip to a mobile south-westerly.
Thunderstorms will probably continue to be a feature of the summer
The mean temperature for summer 2018 is looking average overall with average precipitation.
Like the most recent winter forecast I’ve looked in depth at ENSO, QBO and local meteorological data.
ENSO
The El Niño–Southern Oscillation (ENSO) is a periodic variation in winds and sea surface temperatures over the tropical eastern Pacific Ocean. Current neutral conditions are forecast to continue through to September so any impact is likely to be very small. I had a look at similar years were ENSO was 0.2 in May and came up with the following.
Temperature
Average: 40%
Rather cool: 40%
Cool: 20%
Rainfall
Average to slightly dry: 60%
Average to slightly wet: 40%
Sunshine
Average to slightly sunnier than average: 60%
Average to slightly dull: 40%
QBO
I also had a look the quasi-biennial oscillation (QBO), the quasiperiodic oscillation of the equatorial zonal wind between easterlies and westerlies in the tropical stratosphere. This produced only two similar years: 1963 and 2010.
Temperature
Average: 50%
Cool: 50%
Rainfall
Average to slightly dry: 50%
Average to slightly wet: 50%
Sunshine
Average to slightly sunnier than average: 50% Singularities / patterns
Spring was consistently on the wet side this year with all months at least 127 per cent wetter than average, the total of 182mm made it the wettest for 10 years.
The mean temperature for the spring season, despite the very cold start, ended 0.8C warmer than average, just under a degree colder than last spring which was the second warmest on record.
If you take into account all years back to 1797 that were within +/- 10 per cent of these figures, some 10 ‘best fit’ years emerge.
The list of 10 summers, ranging from 1801 through to 2007, predominantly saw summers that were just on the cooler side of average – no real corkers stand out except for 2001 which saw a hot spell at the end of July that made it into my list of best heatwaves.
As an average this summer could be expressed as: Mean: 17.1C (just below average) Rainfall: 150mm (about average). Sunshine 535 hours (just below average)
Or, expressed in probabilities, I concluded the following:
Temperature Average to slightly below: 50%
Average to slightly above: 20%
Rather cool: 20%
Cool: 10%
Rainfall
Average: 50%
Wet: 30%
Dry: 20%
Sunshine
Average: 10%
Average to slightly sunny: 30%
Average to slightly dull: 40%
From the above you could deduce that the next three months will be slightly below average for temperature, with average rainfall. And slightly duller than average.
To try to give some idea of what month will have the best weather I’ve broken down the summer into June, July and August probabilities.
Looking at June, after the weekend, the outlook is looking unsettled and gradually turning cooler after the first week. July looks average as does August which, apart from two years, has been a very disappointing summer month.
Perhaps the best weather this summer will be at the end of June and the second week of July – just as most schools break up?
* Taking into account the fact that temperatures in London are up to 0.66C warmer than they were 100 years ago I have added 0.66C to mean temperatures before 1915.
** Obviously, in the event of a series of direct hits from thunderstorms, my rainfall estimate could be hopelessly short – a symptom of abundant solar energy at this time of year which creates a ‘noisy’ atmosphere compared with winter.
*** The 1981-2010 average mean for summer in this region is 17.6C, with 144.9mm of rain and 564 hours of sunshine
Posts about thunderstorms are usually few and far between – the average number of thunderstorms in this part of the UK in a summer month (July) is just 3.5.
So experiencing four in four days must be very rare; the record for thunderstorms in a month is 12 in June 1982 though I’ve no idea how many of these were on consecutive days.
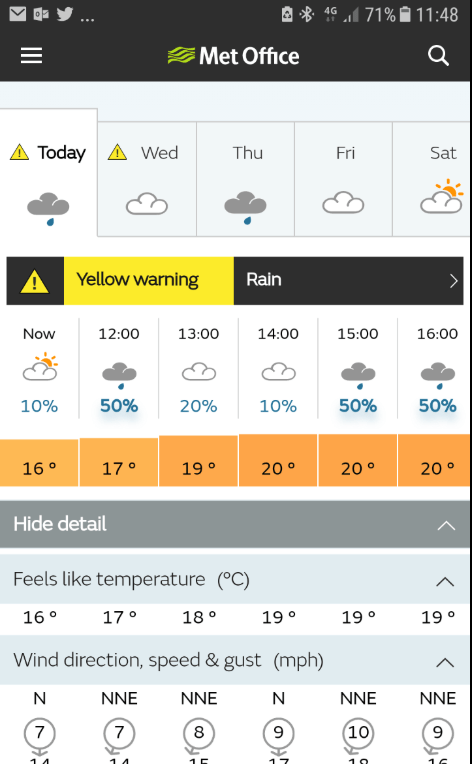
While the storms over the weekend were all about lightning this one was all about rain and loud thunder. Tuesday, May 29th, started cloudy and dull with some light rain. I was expecting some rain but it lingered and became heavier at 11.30am before turning torrential at 1pm, going against forecasts from BBC and Met Office – the trough was a lot further north than modelled. I pointed this out to the UKMO to be told that a yellow warning was in place for the whole SE region.
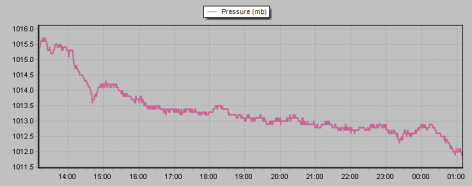
The bulk of the rain fell between 1pm and 2pmA marked drop in pressure coincided with a bright flash of lightning that was almost instantly followed by thunder that was as loud as cannon fire
Some 26.5mm fell in just over two hours bringing lots of surface water and flash floods around Leyton and Walthamstow. At 1pm, while driving in this area, a bright flash was quickly followed by cannon-like thunder. A further fall in the early hours brought the 09-09 total rainfall to 29.8mm, the 5th greatest May fall since 1959.
In the neighbouring borough of Barking and Dagenham it was reported that lightning struck a chimney which caused a fire in a terraced house in Rush Green at 2pm.
Local media pick up the story here, here and here.
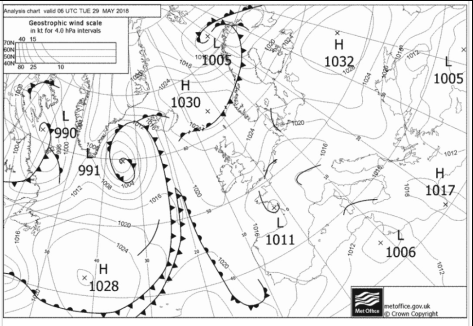
The position of the storm around the time of the loudest thunderSouth Access Road in Walthamstow suffered flash flooding as drains failed to cope with the volume of rainfallThe trough on this FAX chart suggested the heaviest rain would be slightly further south than it was
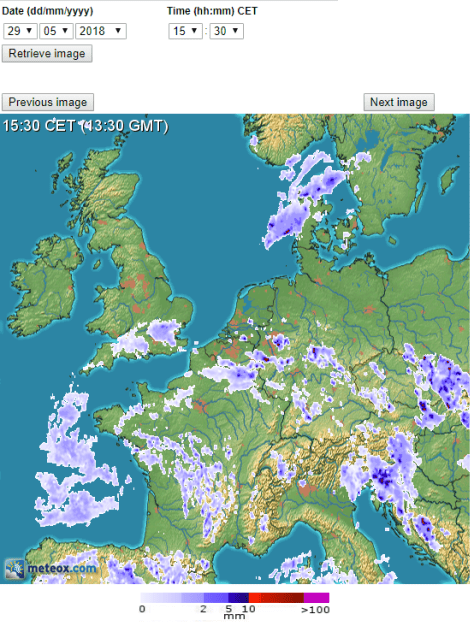
The Met Office forecast for Tuesday shows how useless auto generated apps can be, the 10-20% risk of rain between 1300-1400 contradicts the yellow warningPosted by Simon Cardy: “The large mature Cumulonimbus clouds over SE England (outlined purple on the map) are producing frequent lightning, very loud thunder and heavy rain. (credit: EUMETSAT).”
The coming bank holiday weekend is looking very warm, possibly hot on Monday. And with the heat comes the inevitable thunderstorms.
Looking at the CAPE forecast on @wxcharts the risk on Saturday looks like staying to the west of London. The best chance for east London looks like after noon on Sunday and Monday. There is no guarantee of thunderstorms here – some places could get hammered while just down the road it could stay dry – the potential is there.
Meteorologists will be keeping a close eye on Herstmonceux and Trappes ascents in the coming days.
Weather models are hinting that this coming bank holiday weekend could be very warm indeed, with one WX Charts animation suggesting that a positive anomaly of 12C could be possible on Monday.
A date record looks a formality and, unless there’s a downgrade, new monthly high temperature records at stations across the south-east look a possibility.
While it looks very warm it is too early to start talking about heatwaves. And, considering the pattern since late February, with hot and cold alternating weekly, a brief return to much cooler conditions at the beginning of June can’t be ruled out.
The British record high temperature for May is 32.8C, reached on two occasions:
Camden Square, London May 22nd 1922. The same station recorded this value again on May 29th 1944, along with Regents Park, Horsham and Tunbridge Wells.
The national date record for the 28th, according to TORRO, is 30.6C at Camden Square.
Locally the highest temperature recorded in this area in May is 32.1C on May 27th 2005. The date record I recorded is 26.5C in 2012.
The media are up to their old tricks of flagging up their usual ‘hottest ever’ line; this time the May Day bank holiday.
Today’s Guardian
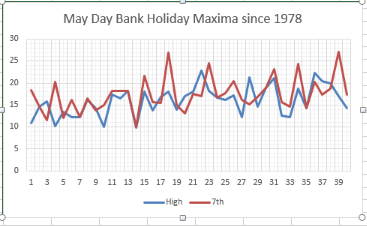
Today’s Guardian informs readers that Monday could be the warmest ever May Day bank holiday, the quite unremarkable record high of 23.9C was set in 1999.
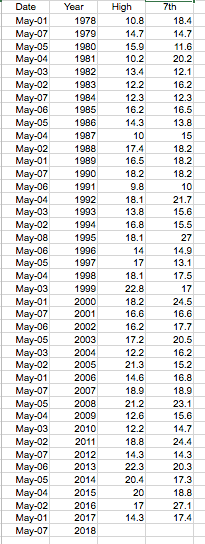
A closer look, however, reveals that dates of the holiday, which only began in 1978, are always moving. Like Easter the date shifts and can fall on any day between the 1st to the 8th. Only six early May bank holidays have occurred on the 7th. It is therefore difficult to compare like with like.
A more correct approach is to compare date records which, for the 7th since 1978, the highest is 27.1C in 2016. The highest temperature for the 7th going back 60 years is 28.5C in 1976.
I normally headline these monthly reviews by referring to the most notable weather but this April, often a fairly non-descript mid-spring affair, offered pretty much every type of weather.
The mean temperature finished 11.7C, 1.9C above average and the warmest for four years.
Rainfall was 55mm, 129 per cent of average and the wettest for 6 years.
Sunshine was just 110 hours, the dullest for 40 years and the 16th dullest since 1881.
Hidden in the positive monthly anomaly was the warmest April day in a local record going back to 1959: 29.1C on the 19th – a figure that represents a positive anomaly of 15.5C and occurring at the start of the warmest April heatwave since 2011. It was remarkable that such an anomaly happened so close to a record negative anomaly the previous month.
Yet, just over a week later, temperatures lurched cold again with one of coldest last days of April on record. Though the 24hr record wasn’t broken the noon-6pm record going back 60 years was beaten.
The wettest day occurred on the 9th with 10mm falling.
Air frosts: 0, Ground frosts: 1
April 30th provided a timely reminder after the heatwave to ne’er cast a clout till May is out. A low pressure system in the North Sea brought a thoroughly miserable day though even more rain fell across the Channel.It was a month with some amazing sunsets. This one, on April 30th, happened just as the sky cleared before dusk
Since notably cold weather struck at the end of February I’ve lost count of the number of times I’ve heard this phrase uttered by the public and some sections of the press.
Top 20 cold anomalies
The ‘Beast from the East’ (versions 1.0 and 2.0) really captured the imagination in an age where everything has to have a label slapped on it; any message that these cold spells are ‘weather’ and not ‘climate’ seems to get lost.
Both spells, indeed the general pattern of our late winter weather, were driven by the stratospheric sudden warming event that lead to a split polar vortex in February – leading to a very cold end to the month and a mean temperature anomaly of -2.5C, the greatest monthly anomaly since March 2013.
To put it into perspective, however, it was nothing like some of the anomalies that occurred in the early 19th century: January 1814, for example, saw a monthly anomaly of -8.2C and coincided with the last occasion a frost fair was held on the Thames. Januaries back then were generally very cold, the 1801-1831 average monthly mean was -3C, that’s 8C colder than the most recent 1981-2010 average!
So climate now is much warmer but that is not to say that anomalously cold months can’t happen. February 1986 saw an anomaly of -5.6C, the 13th= greatest cold anomaly in my local dataset going back to 1797.
Top 20 warm anomalies
The cold December of 2010 recorded an anomaly of -4.2C, 76th= greatest cold anomaly, while anomalies of -4.1C recorded in January 1979 and March 2013 were 77th=.
With the warming climate it is no surprise that most warm months happened very recently. The balmy month of December 2015 saw a positive anomaly of 5.4C.
The ‘Beast from the East 2.0’ was caused by a narrow tongue of extremely cold air from Russia scoring a direct hit on the UK. The odds of this happening must have been low but it is an example of how, when the synoptics of the atmosphere line up perfectly, anything is possible.
And it is an example how even in a warming climate the UK can still be subject to anomalous cold and warmth at any time of the year.
As the author Mark Twain reportedly once said: “The climate is what you expect; the weather is what you get.”
The upper air anomaly of the ‘Beast from the East 2.0’. This graphic shows positive and negative monthly anomalies since 1797 against a generally warming climate
Because the above graphic is crowded I created one of anomalies since 1970. The upward trend is the same.
The weather this coming weekend reminds me of a March weekend in 2013 when large parts of the south-east woke up to a covering of snow.
Conditions in Wanstead were very knife-edge, the cover being very slushy. I remember going for a bike ride on that Sunday morning. We left Aldersbrook in sleet, the cover grew thicker as we pedalled into Essex. By the time we reached High Beach near Epping there was 8cm of fresh cover. Conditions on the 2-hour plus ride were inclement to say the least – the temperature didn’t rise above 0C!
This weekend we have a similar set-up, only this time the upper air at 5,000ft is a good 10C colder – no knife-edges this time and, if the streamer gets going, many places should see 10cm of cover. Don’t put away that sledge just yet!


 In terms of climatology June maxima, considering the 1981-2010 average, shows a gradual increase through the month, though around the 19th to the 21st there is often a dip before a warm end. This would reflect the June Monsoon which occurs every year at 77 per cent probability.


You must be logged in to post a comment.