Tag Archives: wanstead

Beast MkII or just a late March cold spell?

After the severe spell at the end of February that lasted into this month there’s lots of excitement / dread (*delete as appropriate) that the synoptic conditions that brought very cold air from our east is about to return.

The latest run on the GFS model shows that very cold air (-10C at 5,000ft) could be over us by next Sunday, with the ECM 12Z operational looking particular cold. ec

Snow this late in the year is very rare in the London area though, if the conditions are right, a blizzard is not impossible, as happened during the spring of 1952 when a two-day blizzard at the end of March brought drifts up to 6ft deep in the Chilterns.

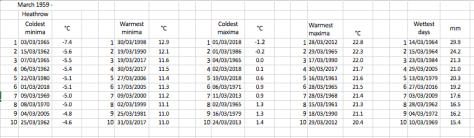
Much more likely will be severe, possibly record breaking frosts. The coldest March night since 1959 across the London area occurred on the 3rd in 1965 with -7.4C recorded at Heathrow. Central London fell to -5C on the same night.

A look back at cold spells in March reveals that while snow was very scarce in London and the Home Counties it can be common on high ground from the Peak District northwards.

A history of March cold

1812: Luke Howard in The Climate of London noted that “great inclemency of the weather” on the 21st March disrupted mail deliveries between the north of Scotland and  Carlisle. The road between Appleby and Brough was impassable because of snow and between Sheffield and Manchester and Bradford and Halifax the snow had drifted from “two to three yards deep”.

Mail deliveries were also disrupted across South Wales.
In Plymouth a “a most tremendous gale from SW the whole of last night and this morning” brought flooding.
Howard’s account would confirm a classic battleground scenario of mild Atlantic air from the south pushing against cold Polar continental air in the north.
His own records from Stratford show a couple of cold days from the 16th, highs never lower than 2C, the coldest night on the 24th, being -4.4C. On the 20th he mentions snow in the morning followed by rain.
Wanstead mean: 4.9C (-2.8C) rainfall: 74.4mm (183%)

The following accounts of cold spells in March are recorded on the site London Weather.

1962: The first ‘spring’ month was colder than any month during the preceding winter. Frosty nights were much more frequent than normal, and sleet or snow fell on 10 days, although amounts were often trivial . On the 5th, the maximum temperature was only 2.2 C. Towards the end of the month, north to northeast winds were replaced by somewhat, cloudier milder, and moister south-westerlies. Atlantic fronts brought rain bands, and on the 29th nearly 10mm was measured.
Wanstead mean: 3.3C (-4.4C) rainfall: 36.5mm (90%) sun: 95.4hrs (88%)

1964: The first week of March was mostly cold with wintry showers and a fresh northeast wind. The temperature on the 7th only reached 2.3C. The second week was changeable and milder, and the high on the 13th was near 14C., but on the 15th, rain turned to sleet and gave a total of 26mm as cold air slowly encroached from the east. Nearly 15mm of rain fell on the 19th as milder air returned, but the rest of the month stayed mostly rather cold and changeable.
Wanstead mean: 4.9C (-2.8C) rainfall: 80.4mm (90%) sun: 63.5hrs (58%)

1969: The first week was mainly dry, and although dull and cold at first, it became fairly sunny and milder but with severe frosts. Overnight on the 6th/7th the minimum temperature was close to minus 8C. During the second week it became dull and wet, but after a cold start temperatures rose above average. Cold north-easterlies returned on the 16th with a high of only 3C., and cloudy, rather cold, and often wet, weather persisted until westerlies returned on the 29th.
Wanstead mean: 4.6C (-3.1C) rainfall: 53.2mm (131%) sun: 55.8hrs (51%)

1979: The first 12 days of March were changeable and windy with temperatures mostly above average. A wave depression formed on a cold front and produced 23mm of rain on the 13th, and as this depression became slow moving to the east of the country the rain turned to sleet and snow on the 14th, and continued into the 15th and 16th with highs near 3C. After mid month, the weather became less unsettled and milder, and the high on the 25th was near 15C.
Wanstead mean: 5.8C (-1.9C) rainfall: 96.5mm (237%) sun: 100.5hrs (92%)

1985: After a changeable start to the month, pressure built, and it became mostly dry, although often rather cloudy, with temperatures close to normal. On the 15th, showery rain turned to snow during the morning, and several cold and unsettled days followed. Sleet or snow fell on 5 days, and on the 21st the temperature failed to rise above 5C. Sharp frosts occurred, and although it then became less cold, the 26th was a miserable day with 11m of rain falling.
Wanstead mean: 5.9C (-1.8C) rainfall: 44.1mm (108%) sun: 100.5hrs (87.4%)

Winter 2017/18 forecast review

At the beginning of December the opening par for my forecast for winter read:

The mean temperature for winter 2017/18 is looking average overall with average precipitation. While that doesn’t sound exciting for anyone looking for colder weather and snow I think the figures mask frequent 3 or 4 day-long cold snaps from the Arctic interspersed with milder interludes from Atlantic incursions; typical characteristics of a pattern driven by the troposphere. For anything longer term we have to hope for a warming of the stratosphere, a sudden stratospheric warming over the Arctic, that downwells into the troposphere, reversing the general westerly circulation. We are overdue an ‘SSW’ event but, even if one were to happen, its effects wouldn’t be felt until much later in the winter.

Figures generated using QBO statistics in the run up to December were identical to the outcome of 5C. It is figures generated using ENSO statistics, however, that produced the best results considering December, January and February alone.

It would seem that the winter was most influenced by the ENSO variable up until February when the effects of the SSW were enough to overcome it?results


Winter 2017/18: 27th out of 72

A few years ago I devised a winter index to try to decipher how modern winters ranked against legendary seasons, such as 1947 and 1963.

With the media hyping conditions last week, which were severe in many parts of the country, it is very difficult for many to gauge just how conditions compare with previous winters.

My findings show that this winter so far stands 27th. It is possible that further snowfall that results in lying snow at 9am between now and April will boost the position higher though, given recent years, this would seem unlikely.

index

Last week’s cold spell, while containing some impressive statistics, is put into perspective when it is compared with other severe spells since 1960. A decent cold spell but no record breaker in the form of a 1962/63.

Perhaps it is the advent of social media, the plethora of constant updates of the latest feet-deep snowdrifts and instant tales of heroism in the face of icy adversity, that has made this cold spell seem far more severe than it actually was in the minds of many; February / March 2018 was the first truly social media-driven cold spell.

London’s March extremes since 1959

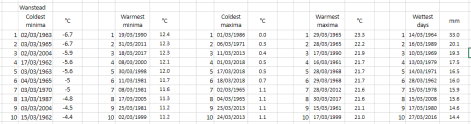
I’ve put together a few top 10s of stats for Wanstead, St James’s Park and Heathrow for the month of March.

The month, the first of the meteorological spring can offer really contrasting weather; perishing cold and very pleasant warmth are both very possible, as the values show.

Probably most notable in the list is the cold March of 1962 which was the coldest of the 20th century and 11th coldest in a local list going back to 1797. March 2013 was also very cold. Strong winds from deep depressions often feature as does the odd blizzard.

Marches in the 1960s also appear to often start very cold and end very warm; the term ‘In like a lion, out like a lamb’ being very appropriate.
•Though this blog only covers extremes back to 1959, thanks to Met Office digitised data, I’ve unearthed records prior to this. Both W.A.L Marshall’s A Century of London Weather (covering 1841 to 1941) and J. H. Brazell’s London Weather (covering 1841 to 1964) confirm the coldest March day as the 13th in 1845 when 25F (-3.9C) was recorded at

The coldest March minimum was 4/5 in 1909 with 9F (-12.8C) at Epsom. Greenwich and Hampstead recorded 14F (-10C)

march extreme

Screen Shot 2018-03-21 at 13.57.55

Screen Shot 2018-03-21 at 13.38.47

Some national UK March values according to TORRO

Hottest: 25C Wakefield, West Yorks – 29th 1929
Coldest: -22.8C Logie Coldstone, Grampian – 14th 1958
Wettest: 164.3mm Glen Etive, Highland – 26th 1968

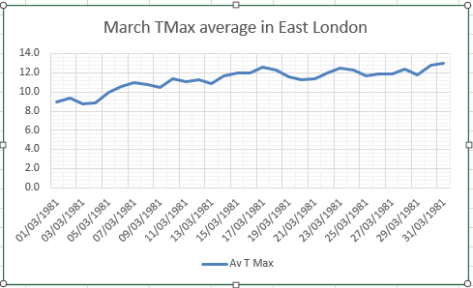
march av tmax

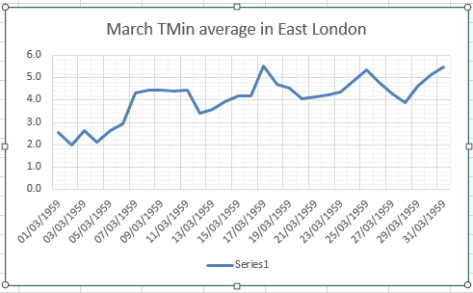
march Tmin

march av rain

The most potent cold spells since 1960

‘This cold spell is rubbish compared to what we used to get!’
Every winter when weather model hype builds expectation for many, often days in advance, the outcome never seems to quite match the hype.

This expectation among weather nerds is inflated even further when the tabloids cotton on and build anticipation further only for it all to end in a ‘damp squib’.

I’ve lost count of the number of times when excited enthusiasts proclaim that an incoming cold spell is going to last at least three weeks; the reality being that the intensity of the cold has gone after four or five days. Cold spells since 2008 often arrive as a ‘blob of cold air’ from the continent that eventually gets ‘warmed out’; it’s been a very long time since we had a cold spell that’s been fuelled by a continual feed of air off the continent.

Screen Shot 2018-02-22 at 09.02.23
In 2018 the really cold air aloft had warmed after 5 days

To illustrate my point I had a look back at every cold spell in this area of suburban east London since 1960. I weeded out the feeble efforts of the last few years by only considering spells where the maximum didn’t exceed 2.8C. The results spanned from the most recent very localised cold spell of December 2022 to the mammoth 31-day Siberian blast that began on Boxing Day 1962.

In another blog I remarked how similar the 2018 pattern was to February 1962. This cold spell began on the 26th and lasted 9 days. Some 7cm of snow fell, this drifting in the wind, possibly making it seem worse with only 4 hours of sunshine which would have maintained any snow cover.

One of the snowiest cold spells happened in February 2009, eight days after an SSW event that lead to a polar vortex split. This four day spell saw a total of 26cm of snow fall.

February 1991 was even snowier, the intense cold lasting some 11 days.

Looking at other February cold spells a 7-day spell occurred in 1985 about a month after an SSW event.

Overall the median length was 5 days with an average of 6cm of snow and 8hrs of sunshine.

*A survey of winters ranked for temperature and snow can be found here.

2022cs

The cold spell of February / March 1962

The last week or so has been agony for model watching coldies wishing for a snowy end to winter.

27021962
The Synoptic chart for February 27th which saw 4 inches of snow in Stratford, east London

Solutions have often flip-flopped between a mild and cold outlook. Even this morning at 6 days out the GFS and ECM model temperature outcomes differed by some 20C, a choice between spring and deepest winter!

Sometimes you have to try and second guess what is going to happen by looking at previous patterns from years past.

Yesterday at Philip Eden‘s funeral I spoke to Woodford Green resident Ron Button. He pointed out how much this February reminded him of February 1962, a month that was non-descript for the first three weeks before turning very cold and snowy. Ron, who has kept a meticulous record of the weather ever since his interest was prompted by the severe winter of 1947, produced diaries of 1962 when he was living in Stratford. The entry for 26th / 27th read: “4 inches of snow with drifting”!

The March that followed was the coldest of the 20th century, ranking 10th in my list back to 1797, and 0.3C colder than March 2013. The fact that the monthly sunshine in 1962 was only slightly below average is testament to how cold the source of the air must have been. March 2013 was very dull by comparison!

An entry in London-weather.eu reads that March was colder than any of the previous 3 winter months: “The first three weeks were mostly mild and dry. It was often breezy which resulted in fewer than average night frosts. Frontal systems off the Atlantic passed through the London area, most of them weak though on the 12th, nearly 8mm of rain fell with southwesterly winds gusting to 57 knots. During the last week of the month, it became much colder, and on the 26th snow fell with the temperature not rising above -0.3C all day.”

There was no stratospheric sudden warming that winter and ENSO was neutral.

The winter of 1961/62 ranks only 14th in my list of worst winters, mostly because the core of the cold happened in March which is considered spring in meteorological circles

Screen Shot 2018-02-16 at 13.54.17

march 1962 summary

The Snow Survey of Great Britain also makes interesting reading with these entries for February and March.

feb1962feb19622

march 1962

A new weather station for Wanstead

Wanstead has a new automatic weather station to complement the one set up in November 2012.Screen Shot 2018-02-13 at 19.13.20

The new AWS, situated in the grounds of Wanstead Golf Club, comes thanks to Friends of Wanstead Parklands. Data from the unit, which is sited very close to where Wanstead House once stood, will be used to help monitor the levels of the park’s lakes.

The sensor unit, 750m NNE of the weather station wansteadweather.co.uk on the Aldersbrook estate, is much better exposed and will hopefully offer more accurate wind and sunshine readings. It will also provide a chance to further investigate the area’s microclimate.

The station has already shown that the golf course is warmer on a radiative cooling night than the Aldersbrook Estate. Screen Shot 2018-02-18 at 14.22.08

The AWS can be found at WeatherCloud https://app.weathercloud.net/d0507444306#profile

Also at Weather Online
https://www.wunderground.com/personal-weather-station/dashboard?ID=ILONDON737

It also tweets hourly and provides an automatic 24hr daily summary. You can follow it @WansteadParkWX

Hourly tweets and all things weather continue as normal at @wanstead_meteo

wxmap.PNG

London’s February extremes since 1959

I’ve put together a few top 10s of stats for Wanstead, St James’s Park and Heathrow for the month of February.

Probably most notable is the cold February of 1991 which saw the deepest snowfall I can remember – days of snow saw the level depth past my knee in suburban London. February 1986 was also very cold but also very dry with little snow.

Februaries in the 1990s were also often warm with 19.7C being reached in Wanstead on 13th in 1998.

It is a shame that the Met Office only publishes easy to access daily data in Excel format back to 1959 as this obviously omits the classic snowy February of 1947 which is worth a blog on its own.

My winter forecast for the London area can be found here.

wanstead feb

top 10 heathrow feb

SJP top 10 feb

Some national UK February values according to TORRO

Hottest: 21.2C Kew Gardens – 26th 2019
Coldest: -27.2C Braemar – 11th 1895
Wettest: 196.6mm Ben Nevis, Highland – 6th 1894

feb max av

A 100% guaranteed snow risk for rest of winter

This weekend marks the halfway point through winter. Though December brought some snow January has been broadly average – really cold air has been absent with only one air frost recorded this month.

The cloudy, anticyclonic type weather is about to be replaced, however, with cold, polar maritime air this week set to flood down from the north-west.

Since December 1st, Wanstead has recorded 12 air frosts – about average. The coldest night was just -3.7C. The current mean temperature this winter to January 14th is 5.7C with rainfall 111mm – statistics that are remarkably similar to the winters of 2012/13 and 1990/91. Both those seasons were followed by cold late winters, February 1991 saw some of the deepest snow that I’ve ever seen in the south-east; the mean temp for that February finished 1.6C, the 14th coldest in the local series going back to 1797.

Using my method for finding patterns stretching back over 50 years to forecast this winter I picked out years that were +/- 10% of the 2017/18 total rainfall. From these I then weeded out the seasons where the average temperature was +/- 10% of the 2017/18 mean.

This gave a list of just two other winters with similar temperature and rainfall. Both winters had above average ‘snow lying’ days, the long terms average for this area being six.

Before any readers accuse me of going all Daily Express with the title of this blog I would emphasise that this piece doesn’t echo the latest long-term output from the models, which are in a state of flux, caused mostly by the evolution of the explosive cyclogenesis expected midweek. It is simply a reflection of what the local data is telling me.

A 100% guarantee of snow isn’t such a fantastical claim as, during the past 10 years, there is only one winter when no snow fell or was lying at 9am!

In terms of the rest of the winter, outside of the models, I would expect a couple more snowfall episodes, similar to the ones we had in January and February 2013. A repeat of February 1991, while not impossible, looks unlikely – there seems to be far too much energy coming from the Atlantic to allow the all important Scandinavian / Russian high to form and exert its influence far enough west for long-lasting cold and snow.

Wanstead Weather: 2017 review

This year finished as the 10th warmest on record – some 0.7C warmer than the 1981-2010 average. Screen Shot 2018-01-05 at 12.54.53

Only three months of 2017 were roughly average – the means being within +/-0.7 every month, bringing the mean temperature to 11.9C.

Rainfall was less remarkable with the year finishing roughly average. The total of 607mm (101% of 1981-2010 average) puts it as the 119th wettest since 1797, just over 40mm wetter than 2016.

It was also a slightly duller than average year with 1,391.2 hours of sunshine recorded. That’s 94 per cent of average, the 91st sunniest since 1881.

Screen Shot 2018-01-05 at 13.45.16


For a review of each month, click January, FebruaryMarchAprilMayJuneJulyAugustSeptemberOctoberNovember, December

To view full stats follow this link:http://1drv.ms/1kiTuzv

You can read the national review of weather events at the Met Office blog here.

Screen Shot 2018-01-05 at 14.23.28


Screen Shot 2018-01-05 at 14.25.44