This year finished as the 14th warmest on record – some 0.5C warmer than the 1981-2010 average – though 0.2C cooler than 2015.
Only four months of 2016 were below average temperature-wise
Six months of 2016 were roughly average – the means being within +/-0.7 every month, bringing the mean temperature to 11.7C.
Rainfall was less remarkable with the year being a little drier than average. The total of 561mm (93% of 1981-2010 average) puts it as the 122nd wettest since 1797, just 8mm wetter than 2015.
It was also a slightly duller than average year with 1,390 hours of sunshine recorded. That’s 93 per cent of average, the 92nd sunniest since 1881 – the least amount of sunshine for 12 years.
Weather models are now in range of predicting the weather on Christmas Day and the all important question of ‘Will it be a white one?’
High pressure centred over the near continent leaves the UK in a feed of very mild air from the Azores
The operational output from the GFS model today answers that question with a resounding ‘no’. A huge anticyclone centred over the continent puts the UK in a very mild SWly feed, the air source from the Azores. You would expect temperatures in London to top around 12C after an overnight low of around 5C.
The Daily Star this morning was even more bullish with it’s splash proclaiming that punters had poured money into Yuletide being exceptionally mild, predicting 15C which would give last year’s record warm period a run for its money. But they have based this forecast on one operational outcome on one model!
Anyone who follows weather forecasts knows that there’s always huge uncertainty in outcomes beyond five days. So putting faith in this forecast 16 days before the event could be dismissed as plain stupid. A closer look at the ensembles – model solutions that pick out trends of several operational runs – suggest that there is very wide spread in outcomes for the weather for Christmas Day: either very cold or very mild! And the GFS system is also hampered by lack of vertical resolution in the stratosphere.
Punters are apparently piling money into it Xmas day being 15C – but ensemble forecasts at this range show outcomes from very mild to very cold.
Taking a broader view of what happens in real life over the last few years there always seems to be a pivotal moment around December 17th. The odds always have to favour the mild weather for us though.
Earlier this month in my November review I found that there was a 55% chance of a cold spell at the end of December. My guess at this range is that the run up to Christmas will see us under the influence of high pressure centred over the near continent – a ‘phantom’ cold spell that is cold at the surface but, at 850mb (5,000ft), well above freezing. Christmas day in London will start frosty with the temperature topping out at 5C or 6C. Any proper cold spell with snow will not bite until 29th.
That’s my guess. My advice to anyone who fancies a flutter is to hold on to your money until the 17th. Or place a bet on both.
* The definition of a white Christmas used most widely – notably by the bookies – is for a single snowflake, even if it lands in the midst of heavy rain, to be observed falling in the 24 hours of 25 December at a specified location recognised by the Met Office.
** On average, snow or sleet falls in the UK 5 days in December, compared with 7.6 days in January, 6.8 days in February and 6 days in March. White Christmases were more frequent in the 18th and 19th centuries, even more so before the change of calendar in 1752, which effectively brought Christmas back by 12 days. Climate change has also brought higher average temperatures over land and sea and this generally reduces the chances of a white Christmas.
November 2016 was the sunniest in a record going back to 1881. Some 91 hours were recorded, 156 per cent above average and a complete contrast to last November which was the dullest for 47 years.
The temperature in the early hours of the 30th fell to -6.1C, colder than any night last winter and the coldest since January 2013
The mean temperature for the month finished 6.4C, that’s 1.5C below the 1981-2010 average ; 4C cooler than last year and the coldest November since 2010. The warmest day occurred on the 15th with 15.9C recorded. The first air frosts of autumn were recorded. The lowest temperature occurred on the 29th when the spirit fell to -6.1C.
Rainfall was 135 per cent of average with 80.1mm recorded. The wettest day was on the 19th when 23.5mm of rain fell.
The sunniest days were on the 2nd, 13th and 25th when eight hours of sunshine were recorded.
Air frosts: 4, Ground frosts: 19
The dolphin-shape of this radar image shows Storm Angus before it hit the south coast. The system stayed far enough south of us not to cause any damage in London
What has December got in store weatherwise? The models suggest the high pressure that has been anchored over us, bringing cold nights, will pull away to the continent. This will allow an ever milder but mostly dry source of air off the Atlantic through to mid month. Days will grow milder while frost and fog will feature less at night.
Beyond the grasp of the models my long range outlook method suggests an coldmonth is most likely at 43 per cent probability. Average comes in at 29 per cent probability while rather mild and rather cold are both 14 per cent probabilities.
Rainfall looks finely balanced. Wetter and dryer than average both come in at 43% probability while average is 14 per cent. Given the influence of high pressure at the beginning of the month I’m inclined to think it will be a drier than average month.
So, to sum up, we’re looking at a mean of 4.4C, rainfall: 55mm, sunshine: 39hrs.
My forecast last month was good: predicted mean 6.8C (result 6.4C). Rainfall: 55mm (result 80mm). Sunshine was way off, however – predicted total: 41hrs (result 91hrs)
I have also published a winter forecast covering the London area that you can find here.
Here follows the full weather diary for November…Full stats for the month here:http://1drv.ms/1rSfT7Y
1st: Cloudy and mild all day. Patchy drizzle at times.
2nd: Sunny, cold start after first ground frost of the autumn.
3rd: Sunny, cold start with cirrostratus and cumulus drifting around. Cloud thickened through the afternoon with some light rain around 9pm.
4th: Cloudy, dull start up to 11am. Rain pushed in and lasted for much of afternoon, clearing in evening.
5th: Cloudy, cold and damp start. Some brightness though with a cold wind.
6th: Sunny, cold start, tending to cloud in. Rain after 3pm. Feeling cold but too windy for a frost overnight.
7th: Sunny, cold and very breezy to start, the cloud tending to fill in through the day. Clearer overnight though too much cloud and occasional air prevented an air frost.
8th: Sunny and cold start. Cloud thickened during the day to bring rain after dark at 8pm that then fell through the night – the biggest fall since Brexit day.
9th: Light rain slowly clearing to cloud.
1oth: Cloudy start with light rain showers around 10.30am then cloudy. Some sunny intervals in the afternoon. Milder.
11th: Bright start with cloud decreasing through the morning to leave a pleasant and clear afternoon.
12th: Miserable and rainy to start, this lasting past 11.15am. Drizzle thereafter into 6pm.
13th: Sunny start though cloud tended to fill in through the day. Damp overnight with patchy drizzle.
14th: Cloudy and damp start with some breeze. Brief brightness at noon but patchy drizzle moved in around 4pm.
15th: Cloudy and miserable though very mild.
16th: Sunny start and very mild though cloud tended to fill in during the day making the sunshine milky.
17th: Bright, breezy start, the breeze increasing until a squall blew through at 2.40pm then sunny spells.
18th: Bright start with milky sunshine then tending to cloud over. Feeling cold.
19th: Bright sunshine though cold to start. Patchy altocumulus developed through the day, leaving it to become bright, the strength of the sun diminishing. Rain started around 6pm and fell through night with varying intensity.
20th: Dull and cloudy start with rain returning at 10am. Cloudy afternoon with rain returning late evening and through the night, some heavier bursts.
21st: Cloudy with showers past noon. Heavier showers moved in mid afternoon and fell into the evening.
22nd: Cloudy with a few very light showers around. Breezy.
23rd: Cloudy and breezy. Feeling mild.
24th: Cloudy and mostly dull with brief brightness at noon.
25th: Sunny with just a few cumulus around.
26th: Sunny start but low cloud blotted out the sun around midday then cloudy and cool.
27th: Cloudy and mild.
28th Sunny all day with just a few cumulus floating around.
29th: Sunny all day with frost persisting on grass in shade.
30th: Sunny and very frosty start. Frost persisting on the grass all day with a very cold start to the night. A veil of cloud crossed the region late evening, lifting the temperature above freezing, before clearing before dawn
Frost still lingers on my lawn as I write this winter forecast on the last day of the meteorological autumn. Last night’s minimum was -6.1C, the coldest night this year and, indeed, colder than any night last winter.
It would be very easy to get caught up in the hysteria that happens every November of what the winter will bring. Most of the hysteria comes from ‘coldies’, those folk that hope every winter will be the coldest and snowiest on record. I count myself among them.
The north-west of England looks around 10C above average on December 9
But, despite hints from BBC weather forecasters that something maybe afoot in terms of something colder than usual from mid-December, years of disappointment have taught me to just take winter as it comes. Meteorological models this morning look anomalously warm for the first half of December, the UK being on the warm side of an anticyclone centred over France – the theme of so many winters I can remember.
The current phases of ENSO and QBO suggest that their influence on our winter this year will be far less marked than last year. Looking at teleconnections with a slight La Nina and the current QBO cycle have revealed winters that were fairly uninspiring though by no means write-offs for snow, two examples in the case of QBO being 1985/86 and 1990/91 – both had very cold Februaries.
Before I got too bogged down with trying to find patterns here I decided to move on to my more traditional pattern-matching.
Before I trawled through the figures my initial gut reaction to this winter was that it would be the coldest for at least four years – a not-too-difficult feat giving the mildness of the last three winters which saw very little in the way of snow.
The overall mean temperature for December, January and February came out at as4.2C – 1.2C colder than the 1981-2010 average, with average precipitation.
A rather cold winter, over three months doesn’t tell you much. A very mild and stormy December could mask a dry and notably cold February. This makes it worth looking at the individual months of each winter.
There is a lot of spread in the above tables. Considering them altogether I would guess winter will unfold in the following way:
December to start mild, possibly becoming very mild, before beginning to turn very cold mid-month. This pattern will persist, with varying intensity through into January which could also be very cold. Milder conditions to follow in February though this will probably end a fairly average month and drier after a slightly wetter than average December and average January.
As well as my method of using rainfall and temperature I also considered other methods. One was Russian research that states that the weather pattern in the winter will be the opposite to the weather on September 17th and November 7th. This autumn September 17th was N’ly and November 7th was NNW’ly. So, this would suggest a continental flow from S and SSE.
You can read the method of how I reached my conclusion here.
The Met Office’s latest outlook for a relatively high chance of cold weather in the early part of winter has set the internet abuzz with talk that the UK is about to experience its coldest winter in years.
The 3-month outlook, produced by the agency for contingency planners, states:
Lower-than-average temperatures are more probable than higher-than-average values. Overall, the probability that the UK-mean temperature for November-December-January will fall into the coldest of our five categories is 30% and the probability that it will fall into the warmest of our five categories is 10% (the 1981-2010 probability for each of these categories is 20%).
THe ‘30% chance’ for temperatures to be in the coldest of five categories is more significant than it would appear: in this three-year period of mild winters that figure usually hovers far lower.
The continent is not yet cold enough to get excited about this synoptic chart for Monday, November 7th
The Met Office’s method, which includes a combination of data such as QBO, ENSO and ground based observations also agrees with my own method of finding local October singularities back to 1797. This month I found that an average or cold November is most likely: average and cold are both 30 per cent probability. Rather cold and severe are both 20%! There appears no chance of anything mild.
So, we can look forward to ‘a reduction in the normal westerly flow across the UK from the Atlantic, with a greater frequency of northerly or easterly winds’.
But what does this mean for the London area? If the near continent is not cold enough northerly and easterly winds could just bring a succession of cold rain in the form of showers off the North Sea with a higher than average frequency of frosty nights: nothing out of the ordinary for a slightly cooler than average November.
To try and second guess proceedings into December I decided to plot all year singularities to find when the cold spells would most likely fall and how severe they could be.
The results for November look unexciting: the coldest day is likely to be around the 19th with a maximum of 6.9C. The best chance for something cold looks to be in December, around 6th to the 11th – but there again highs of 3C or 4C would mean that any snow would be short lived. There appears to be a warm up in time to scotch hopes of a white Christmas before another cool down toward new year.
So, in conclusion, late autumn / early winter is likely to be a lot colder than the past three years. It is perhaps this fact, together with frosty mornings being common, that will make the season feel colder than it actually is.
I will be publishing my usual winter forecast on December 1st.
The coldest day in November is likely to be around the 19th
October 2016 was yet another dry month, a pattern that has emerged since the middle of June. Just 52 per cent of the October average was recorded.
October saw many pleasantly sunny days
The monthly mean finished 11.5C, 0.3C above average and ending a three-month run of warm temperatures.
Some 105 hours of sunshine were recorded, 98 per cent of average
Air frosts: 0, Ground frosts: 0
So what has November got in store weatherwise? The models on the 1st suggest an anticyclone anchored to our west over the Atlantic will bring a regime of, at times, chilly northerly winds and the potential for rainfall, much probably in the form of showers, driven by low pressure in the North Sea. Where skies clear at night there will be potential for the first air frosts of the autumn.
Beyond the grasp of the models my long range outlook method suggests an average or cold month is most likely: average and cold are both 30 per cent probability. Rather cold and severe are both 20%! There appears no chance of anything mild.
Rainfall appears that it will be skewed toward something above average at 40 per cent, though average and below average are both 30 per cent.
Sunshine looks average at 57 per cent probability.
So, to sum up, we’re looking at a mean of 6.8C, rainfall: 55mm, sunshine: 41hrs.
Numerous holes dug by squirrels appeared in October. The squirrels have no more an idea than we do whether winter will be cold
Here follows the full weather diary for October…Full stats for the month here:http://1drv.ms/1rSfT7Y
1st: Rainy start with showery bursts to 11.25am then through afternoon mostly cloudy.
2nd: Sunny but chilly, feeling very autumnal. Clearing into the evening with a cold night to follow.
3rd: Sunny, gin clear all day until 2.08pm.
4th: Another sunny albeit slightly hazy start then patchy cumulus. Warm in the sunshine even with a easterly breeze.
5th: Sunny start though breezy and with quite a few cumulus around. Cloud streets observed at 10.30am, the cloud tending to decrease and completely melt away by 4pm.
6th: Sunny start but with much cloudier spells at times. Warm in the shelter.
7th: Cloudy all day, the cloud thick enough at lunch time for drizzle that damped the ground.
8th: Cloudy with bursts of light drizzle in the morning, some brightness. A heavy shower at 2pm was brief then cloudy. Clear and cold overnight.
9th: Sunny until 2pm with patchy cumulus – a really glorious morning. Sunny spells in afternoon with cold night to follow.
10th: Sunny with just patchy cirrus first thing. Thick patches of alto-cumulus drifted across from time to time. Cold overnight.
11th: Sunny with patchy cumulus which melted away through the day. Showers after dark, one at 2330z.
12th: Cloudy and damp start. Short, sharp shower at noon then mostly cloudy.
13th: Rainy , wet start thanks to a streamer of moderate to heavy showers.
14th: Cloudy am but with lots of sunshine mid-morning before clouding over again though staying bright.
15th: Bright start but with lots of cloud pushing in and light burst of drizzle at noon. Cloud thickened before rain moved in after 5pm and fell intermittently through the night.
16th: Damp start as the remnants of the overnight rain cleared away, then becoming brighter at 11.15am. Sunny spells for a time before turning cloudier with some very sharp showers on yet another convergence line.
17th: Cloudy start but soon brightening up with some pleasant sunny spells. Heavy burst of rainfall at 5.30pm with more showers at midnight and early hours.
18th: Cloudy though quickly turning bright and breezy with long sunny spells after clearance of the cold front.
19th: Bright start though more cloud around than sun all day. Feeling colder than of late.
20th: Bright and breezy with variable cloud and sunny spells. A short shower at 2pm damped the ground. Clear spells overnight made it chilly. A shower at 9.30am.
21st: Cloudy and chily start.
22nd: Cloudy and cold start, brief clearance at 11am then sunny spells.
23rd: Sunny and clear to start though cold. Sunny spells into the afternoon. Cloudy overnight.
24th: Cloudy and cool during the day and overnight.
25th: Dull and cloudy with only limited brightness. Clear early evening with temp falling before it turned misty. Cloud pushed in raising the temperature.
26th: Cloudy start and turning very dull before bright spells spread in at noon.
27th: Cloudy though getting brighter through the morning with a brief clearance at noon, then bright and sunny intervals.
28th: Sunny and very mild to start. Sunny spells through the day.
29th: Cloudy start with bright intervals after midday. Clear spells after dark with fog forming after 11pm which gave a foggy start.
30th: Foggy start then cloudy and miserable.
31st: Fog to start then clearing at 11am. Gorgeous sunny day thereafter.
I don’t usually bother trying to forecast autumn or spring given that there is far less interest in them than winter and summer. However, given the heightened interest in this year’s hurricane season and emboldened, perhaps foolishly, by my reasonably correct summer forecast I decided to have a look at the stats and see if I can find any signs where autumn in east London may be headed.
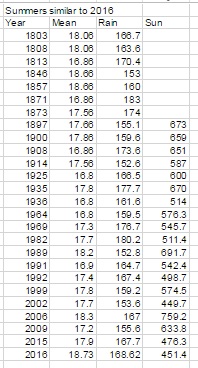
Using the method for my seasonal forecasts resulted in a shortlist of 26 summers that were similar to 2016.
Because the NOAA ENSO index only goes back to the 1950 I decided to disregard all years prior to this date to try to make any results more reliable. This narrowed down the list to 11 years.
With these considered I then searched for years that had a similar ENSO index to June (0.1 – neutral) with a tendency to turn negative (La Nina). This narrowed the field further to three years: 1999, 1992 and 1964. However, the only year that is showing signs of being similar with regard to where the ENSO index is forecast to be heading is 1964.
Although, so far, there has been an uptick in hurricane activity similar to 1964 there is, of course, the added consideration that Saharan dust is playing a part in impeding the formation of these tropical storms in the Gulf of Mexico – something the weather models seem to struggle to get a grip on.
With this in mind perhaps there will also be lower than usual instances of these storms crossing the Atlantic to affect the UK: hence a quiet autumn though, on a national scale, interpersed with the odd interest from the Atlantic. In London, perhaps we can expect something very similar to what is listed on the excellent website: http://www.london-weather.eu/article.103.html
Summer 2016 turned out to be a very decent season overall, the mean temperature of 18.7C (1.1C above average) made it the sixth warmest summer since 1797.
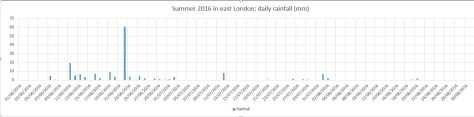
While it wasn’t quite up there with the hot summers of 1976 and 2003 it still produced some notable records. The stormy beginning to June effectively ended with the Brexit vote, a period of 24 hours that coincided with the highest daily rainfall this area has seen since at least 1959.
The multi-cell thunderstorm in the early hours of June 23rd produced 60.8mm of rainfall, nearly half of the month’s total which became the third wettest June in a record going back to 1797. The high rainfall was in complete contrast to July and August and helped skew the overall figure: 168.6mm is 114 per cent over average summer rainfall.
With so much rainfall overall sunshine was affected with only 451 hours recorded, just 80 per cent of what can be expected in an average summer.
July produced another record, this time the highest overnight minimum recorded since 1959. The minimum of 21.1C was recorded during the early hours of the 20th – coming hours after the hottest day of the year: 33.5C – the 14th hottest day on record.
The warm and very dry theme continued into the final month of summer with the warmest August for 12 years, the 10th warmest and 12th driest since 1797.
My summer forecast, when the monthly probabilities are considered, was broadly correct though I didn’t estimate correctly just how warm it would be.
Though there were no records broken August 2016 goes down as a mighty fine summer month, the warmest for 12 years. The mean of 19.5C was 1.3C warmer than average and only 0.1C cooler than 2004.
Grasslands around Wanstead Park have gradually turned brown because of the lack of rainfall
The month ended a three-year run of poor or so-so Augusts: in terms of mean temperature the month was the 10th warmest in a local series going back to 1797.
It was another very dry month: just 11.9mm fell, 24 per cent of average, the driest August since 2003 and the 12th driest in the local record.
The month only falls down in terms of impressiveness when sunshine hours are considered. Some 192 hours were recorded, the 59th sunniest since 1797 – 1995 had 80hrs more sun.
Air frosts: 0, Ground frosts: 0
So what has September got in store weatherwise? The models on the 1st suggest the month will start mixed, though any precipitation will be below average. Temperatures remaining on the warm side.
Beyond the grasp of the models my long range outlook method is again hampered by a very dry August. However, the data I do have suggests an average month at 100 per cent probability.
A wetter than average month looks most likely at 75% probability.
The rainfall probability makes me wonder whether we are in for a very unsettled second half of September, the Atlantic cranking into life with the remnants of tropical storms and hurricanes having an ever-increasing influence as the month progresses.
So to sum up: mean 15.3C (average), rainfall 162mm (300%), sunshine 140 hours (100%).
My August outlook for temperature was good. I predicted a mean of 19C (outcome: 19.5C). It was drier than I thought: 30.3mm (outcome: 11.9mm). Sunshine was poor: 239 hours (outcome: 192 hours).
Here follows the full weather diary for August…Full stats for the month here:http://1drv.ms/1rSfT7Y
1st: Cloudy start to 1pm. Rain started at 5pm through to 10pm. A brief interlude before more light to moderate rain through the night 4.30am, then drizzle
2nd: Damp, miserable start – the rain became light to moderate in the early afternoon before drying up – very high dew points through the day.
3rd: Bright and breezy with variable cloud.
4th: Bright start with variable cloud and sunny spells.
5th: Good sunny spells all day – perfect summer’s day, not too much humidity – though an isolated shower passed over at 8pm.
6th: Sunny, clear start. Lots of sunny spells during the day.
7th: Bright start though very breezy. Cloud decreased through the day to leave a gorgeous late afternoon and evening.
8th: Sunny, clear start with lots of fair weather cumulus throughout the day. Cloudier spells mid afternoon.
9th: Sunny with fair weather cumulus up until noon then cloudy afternoon.
10th: Sunny with fair weather cumulus, variable throughout the day. Breezy.
11th: Cloudy start with very brief light rain, barely enough to damp ground. Some sunny intervals later and bright and warm.
12th: Sunny start with a few clouds. Turned gin clear at 11am and stayed clear all day. Feeling hot.
13th: Bright start but turning cloudier. Sunny intervals PM.
14th: Cloudy start breaking to some long sunny spells. Feeling very warm in the sun.
15th: Bright start soon turned sunny with a clearance at 1pm.
16th: Bright start though a lot of haze around. Sunnier later though still hazy.
17th: Sunny with patchy cloud to start, this clearing late morning to leave a clear if rather hazy afternoon.
18th: Sunny if a bit hazy to start, this tending to decrease to leave warm sunshine.
19th: Cloudy with rain threatening. Low cloud at Stansted. Brief rain in afternoon then cloudy.
20th: Dull and overcast at 9am. Burst of heavy rain at 10.15am clearing to sunny spells at noon 30. Rain between 7pm and 8pm and 3am and 4am.
21st: Bright start. Sunny intervals till 3pm then sunny spells.
22nd: Bright after earlier rain at 0719 then sunny spells.
23rd: Clear and sunny start with a few cirrus clouds through the day. Hot.
24th: Sunny, gin clear start. Patchy cirrus through the day. Hot.
25th: Lots of altocumulus and sunny spells but felt sultry due to high dew points.
26th: Cloudy start but gradually decreased to leave clear pm.
27th: Overcast but bright start. Brightness through the day but hazy. Some heavy storms further north.
28th: Overcast until early afternoon, 5 minute shower at 2pm then sunny intervals..
29th: Bright start then sunny spells and cirro cumulus gradually clearing to leave a sunny evening and clear night.
30th: Clear and sunny start.
31st: Bright start though cloud filling in by 3pm, clearing again at 8.30pm
The past few days have offered a couple of perfect examples of how wind direction can have a massive effect on the resulting maximum temperature at this time of year.
Friday, August 12th and Monday, August 15th, were both very similar in that any morning cloud completely cleared by 11am. But while the wind blew from a SW’ly direction on Friday, nudging Wanstead up to a very warm 28.1C, by Monday the high pressure had drifted north, drawing in a cool NE’ly flow off the North Sea. The high temperature in Wanstead on Monday was nearly four degrees cooler at 24.4C.
Under these conditions temperatures will be warmer the further west you go, as the graphs below show.
Highs to 6pm on 12th were: Wanstead 28.1C with Northolt reaching 27C
Highs to 6pm on 15th were Northolt at 25C. Gravesend, being furthest east and most influenced by the cooling North Sea breeze reached 22.6C


 The overall mean temperature for December, January and February came out at as
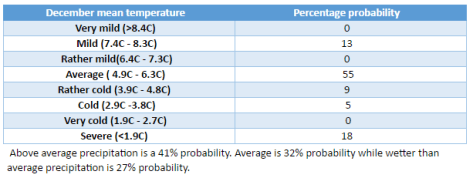


 od for my seasonal forecasts resulted in a shortlist of 26 summers that were similar to 2016.
 In London, perhaps we can expect something very similar to what is listed on the excellent website: http://www.london-weather.eu/article.103.html
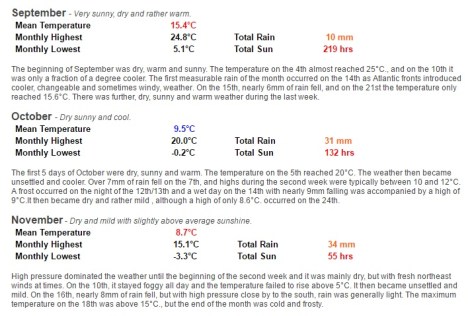


 With so much rainfall overall sunshine was affected with only 451 hours recorded, just 80 per cent of what can be expected in an average summer.
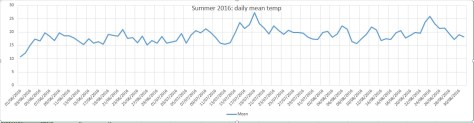


 Beyond the grasp of the models my long range outlook method is again hampered by a very dry August. However, the data I do have suggests an average month at 100 per cent probability.
 My August outlook for temperature was good. I predicted a mean of 19C (outcome: 19.5C). It was drier than I thought: 30.3mm (outcome: 11.9mm). Sunshine was poor: 239 hours (outcome: 192 hours).


You must be logged in to post a comment.