Summer 2016 turned out to be a very decent season overall, the mean temperature of 18.7C (1.1C above average) made it the sixth warmest summer since 1797.
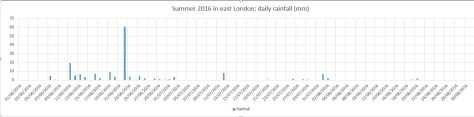
While it wasn’t quite up there with the hot summers of 1976 and 2003 it still produced some notable records. The stormy beginning to June effectively ended with the Brexit vote, a period of 24 hours that coincided with the highest daily rainfall this area has seen since at least 1959.
The multi-cell thunderstorm in the early hours of June 23rd produced 60.8mm of rainfall, nearly half of the month’s total which became the third wettest June in a record going back to 1797. The high rainfall was in complete contrast to July and August and helped skew the overall figure: 168.6mm is 114 per cent over average summer rainfall.
With so much rainfall overall sunshine was affected with only 451 hours recorded, just 80 per cent of what can be expected in an average summer.
July produced another record, this time the highest overnight minimum recorded since 1959. The minimum of 21.1C was recorded during the early hours of the 20th – coming hours after the hottest day of the year: 33.5C – the 14th hottest day on record.
The warm and very dry theme continued into the final month of summer with the warmest August for 12 years, the 10th warmest and 12th driest since 1797.
My summer forecast, when the monthly probabilities are considered, was broadly correct though I didn’t estimate correctly just how warm it would be.
Storm clouds gathering was a common sight in June 2016, but enough about the tumultuous political situation…
The levels of Heronry pond have benefited immensely from the rainfall which was 2.5 times the average in June
For anyone looking for summery weather there was little to cheer about. For sunshine the month was the dullest June in a record going back to 1797. Just 96 hrs were recorded – which is just over half what we can expect in an average June.
Most notable was the rainfall: just over 139mm fell which is 272 per cent of average, and the third wettest since 1797. Only 1903 and 1860 were wetter. The month also saw the record broken for highest daily rainfall in a 24-hour period. A multi-cell thunderstorm in the early hours of the 23rd saw 60.8mm fall, most of it in two hours, bringing flash floods to the surrounding area.
The synoptic situation at midnight on June 23 when the heaviest rainfall this area has seen since at least 1960 fell
With the lack of sunshine and copious rainfall it is, perhaps, surprising that the mean temperature for the month finished just above average: 16.8C is 0.7C above the June average. The warmest day was the 10th with 25.3C recorded – only one other day saw the mercury exceed 25C – very unusual for this time of years.
Air frosts: 0, Ground frosts: 0
So what has July got in store weatherwise? The models on the 1st suggest more of the same weather that we have seen during the last third of June. Sunshine and showers with the occasional ridge possibly calming things down for a few hours.
Roads in Wanstead were turned into rivers in the early hours of June 23rd
Beyond the grasp of the models my long range outlook method suggests a rather warm month at 50 per cent – so given the cool start perhaps we can look forward to something summery in the final half to one third? Rainfall and sun looks inconclusive so I would guess average. Because of the high rainfall last month I think my long range method falls down.
A slightly wetter than average month looks most likely at 50% probability. Sunshine probably about average.
So to sum up: mean 18.8C (0.3C above average), rainfall 50mm, sunshine 190 hours.
My June outlook for temperature was good. I predicted a mean of 16.9C (outcome: 16.8C). Rainfall was very poor: 38mm (outcome: 139mm). Sunshine very poor: 178 hours (outcome: 96 hours).
Here follows the full weather diary for May…Full stats for the month here:http://1drv.ms/1rSfT7Y
1st: Cloudy and cool all day.
2nd: Cloudy and cold all day, brief brightness at 11am.
3rd: Cloudy and cool all day, limited brightness late morning. Cloudy overnight with limited breaks – air was very humid with warm front and visibility severely limited.
4th: Cloudy all day though cloud was lighter and air felt warmer because of the warm front that came in yesterday from Europe. Brief milky sunshine at 7pm.
5th: Cloudy up until 9.30am when the cloud began to thin. Sunny spells from 11am before a clearance at 1pm interspersed with occasional cloud.
6th: A gloriously sunny day all the way through. A lovely evening too.
Sunny sunsets were rare in June
7th: Sunny start but cloud rolled in at 1.30pm with thunder heard all around Wanstead. Some serious flash flooding in Croydon. Highest official total was over 40mm in Kenley. Just 1.7mm during the day but trough brought rain at 5am, about 3mm.
8th: Sunny start but felt very humid and oppressive. A thunderstorm skirted Wanstead at 1.40pm with thunder and much rain in Chigwell, not much in Wanstead. More thunder at 2.10pm. Rain came and went for rest of day until 7pm – very little upper air movement. Mostly cloudy overnight.
9th: Cloudy start but some sunny spells developing.
10th: Cloudy start but soon decreased with long sunny spells developing. Lower humidity so felt pleasant.
Heavy rain in Chigwell
11th: Cloudy and humid start with very heavy rain at 3pm. This lasted for 45 minutes. More rain fell sporadically through the day, evening and overnight.
12th: Cloudy after moderate rain. Showers and longer bursts of rain returned before a brief clearance at 3pm. More showers piled in with a real corker to the north of Wanstead.
13th: Damp start soon led to light rain, turning persistant at 11am. Then outbreaks of rain throughout the day, evening and overnight.
14th: Light rain to start but this quickly gave way to heavy showers all day. Some brightness at 6pm then turning drier overnight. Gin clear dawn.
15th: Sunny start but with lots of convective cloud. Some drizzle but a heavy shower stayed to the east of Ilford.
16th: Bright start with sunny spells, more breeze than recent days
17th: Lots of cloud around though sunny spells arrived early afternoon. Then showers between 5 and 6pm.
18th: Cloudy with spots of drizzle. Feeling cold all day – a maximum of only 16.5C.
19th: Sunny start but cloud gradually increasing all afternoon. Rain by nightfall that fell intermittently for hours. Rain again at obs time.
20th: Rain to start that lasted, with variable intensity, through the morning. Sunny spells from mid afternoon.
21st: Sunny start with just a few cirrus and cumulus, this tending to increase through the morning to leave an overcast afternoon. Cloudy overnight – a few spots of drizzle on school run as frontal wave started to move across UK.
22nd: Cloudy start with warm sector drizzle. Showers developed at 11pm, much thunder and lightning and the rain turned really heavy through the early hours.
Extremely heavy rainfall during the early hours of the 23rd
23rd: Cloudy and humid to 1pm. Showers at 3pm.
24th: Sunny with variable cloud. Feeling humid in the sunshine.
25th: Bright start with sunny intervals. Light shower at midday. Thunderstorms at 2pm, 4pm and 9.30pm.
26th: Sunny spells though significant cloud at times. Rain between 4 and 6pm.
27th: Mostly cloudy though with some brightness after noon. Warmest point was in the evening at 7pm.
28th: Bright though cloudy start. Some sunny intervals but rain late afternoon into the evening. Cool overnight.
29th: Cloudy and breezy, some rain in the air early afternoon and again in the early hours
30th: Cloudy with slight breeze. Some light rain in the early hours.
This month marks the 60th anniversary of the Clean Air Act, a piece of government legislation prompted in part by the Great Smog of December 1952 that caused between 4,000 and 12,000 premature deaths.
Air quality in the capital has vastly improved since those days of ‘pea souper’ fogs. A study of sunshine in Greenwich and other sites around east London reveals that winter months are, on average, around 18 per cent sunnier today than they were in the same period before the act was implemented in 1956. Though the cause of this is possibly partly because of a decline in winter anticyclones – weather systems that can give weeks of dull, murky conditions – further environmental legislation has helped.
Though the sky is clearer conditions at street level have grown steadily worse in recent years. During the first week of 2016 it was revealed that parts of the capital had already breached annual EU hourly limits for nitrogen dioxide – a pollutant that causes thousands of premature deaths through respiratory problems each year. A study last year showed that nearly 9,500 people die early each year in London because of long-term exposure to air pollution, more than twice as many as previously thought, according to the research.
Although action is being taken to reduce pollution from diesel buses, taxis and lorries the figures reveal that we are once again getting to the level of deaths caused by the Great Smog. The new mayor of London, Sadiq Khan, seems to be taking pollution a lot more seriously than his predecessor with a number of initiatives announced – making London compliant with EU legal limits well before the government’s target of 2025.
However, the mayor has also sent out conflicting messages by saying he backs the expansion of City Airport – you can’t have it both ways. And, if we do leave the EU, what will replace these EU legal limits?
With the current political situation lurching from one disaster to another I fear that the environment will get pushed well down the agenda. The current list of candidates vying to take over from David Cameron as prime minister include ‘dark horse’ Andrea Leadsom, the energy and climate change minister, who has been an ardent supporter of fracking. And on coal she recently sparked controversy in February where she assured the industry the pledged 2025 coal phase-out was just a consultation and encouraged it to suggest what ‘unabated coal’ means.
The many benefits of EU membership got lost in the debate over the last few weeks – improvement in the environment being one of them. It is why, without the beady eye of Brussels keeping watch over us, that we must ensure that the next government stick to their promise of continual improvement to the capital’s air quality.
Winter sunshine totals were falling before we joined the EU. Since 1973 a general upswing is observed. On average there is 18% more sunshine during winter months since we joined the EU compared with the same period before joining the Common Market
I’m joking. But with the lies and half-truths spouted by both sides of the EU referendum debate it is a statement I wouldn’t be surprised to hear uttered in this last full week of campaigning before June 23.
This preposterous statement, however, got me thinking that perhaps there may be some truth that summers really were better before Britain joined the then European Economic Community with Denmark and Ireland in 1973.
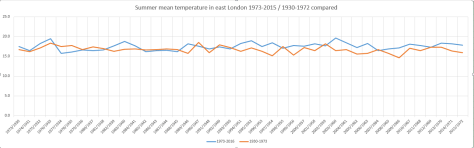
But comparing the past 43 London summers with the period of summers from 1930-1972 shows that this is not the case in terms of temperature and rainfall.
Summers during the period 1973-2015 are on average 0.8C warmer than summers 1930-1972A look at rainfall shows the average since 1973 is 84% that of the period 1930-1972Average sun since 1973 is broadly the same as period 1930-1972 though has recently dipped
Perhaps it is just our minds playing tricks on us when we think back to summers being better than what they are today, and before EU membership?
Voter turnout and the weather
Over the years it has been argued that weather can affect voter turnout and therefore the result of an election. One Dutch study states: “We find that the weather parameters indeed affect voter turnout. Election-day rainfall of roughly 25 mm (1 inch) reduces turnout by a rate of one per cent, whereas a 10-degree-Celsius increase in temperature correlates with an increase of almost one percent in overall turnout. One hundred percent sunshine corresponds to a one and a half percent greater voter turnout compared to zero sunshine.”
Weather for the referendum on June 5, 1975, was mostly fine nationwide. A temperature of 21.3C was recorded at Greenwich after an overnight low of 7C. It was the start of a settled period of summer weather that had followed a cool and miserable late May and early June. Sound familiar?
In June 1975 the electorate expressed significant support for EEC membership, with 67 per cent in favour on a 65 per cent turnout. Though the turnout looks low you certainly couldn’t blame the weather.
In terms of this year, with ten days to go, it is too early to say for sure what the weather will be like on June 23rd though the GFS model suggests, like 1975, it could be the start of a more settled spell of weather?
There are signs that the Azores high may ridge north-eastwards around June 23rd, possibly bringing fine weather for referendum day
Weather forecasting and the European Union
Weather forecasts have improved immensely since the 1970s. A three-day forecast is now much more accurate than a 24-hour forecast was in the 1980s, partly thanks to the collaboration between national met agencies throughout Europe and beyond.
The European Centre for Medium-Range Weather Forecasting (ECMWF), formed in 1975 as an intergovernmental organisation located in Reading, UK, will maintain its independence in the event of Brexit.
A spokesperson for ECMWF said: “While most of ECMWF’s member states are also members of the EU, ECMWF is structurally independent of the EU. The location of ECMWF in the UK, as well as the UK financial contributions to ECMWF and the tax arrangements between ECMWF and the UK are regulated by agreements between the ECMWF, its member states and the UK. These arrangements are entirely separate from the UK’s EU membership.”
There’s a huge amount riding on this referendum. The EU has flaws but there’s far more good comes out of it than bad. And even if the EU has too many technocrats and bureaucrats I’d rather entrust funding to them than the short-term policy making that plagues modern Westminster on both sides of the political spectrum. And that’s why I’ll be voting Remain.
The final month of autumn was most notable for its warmth and lack of sunshine.
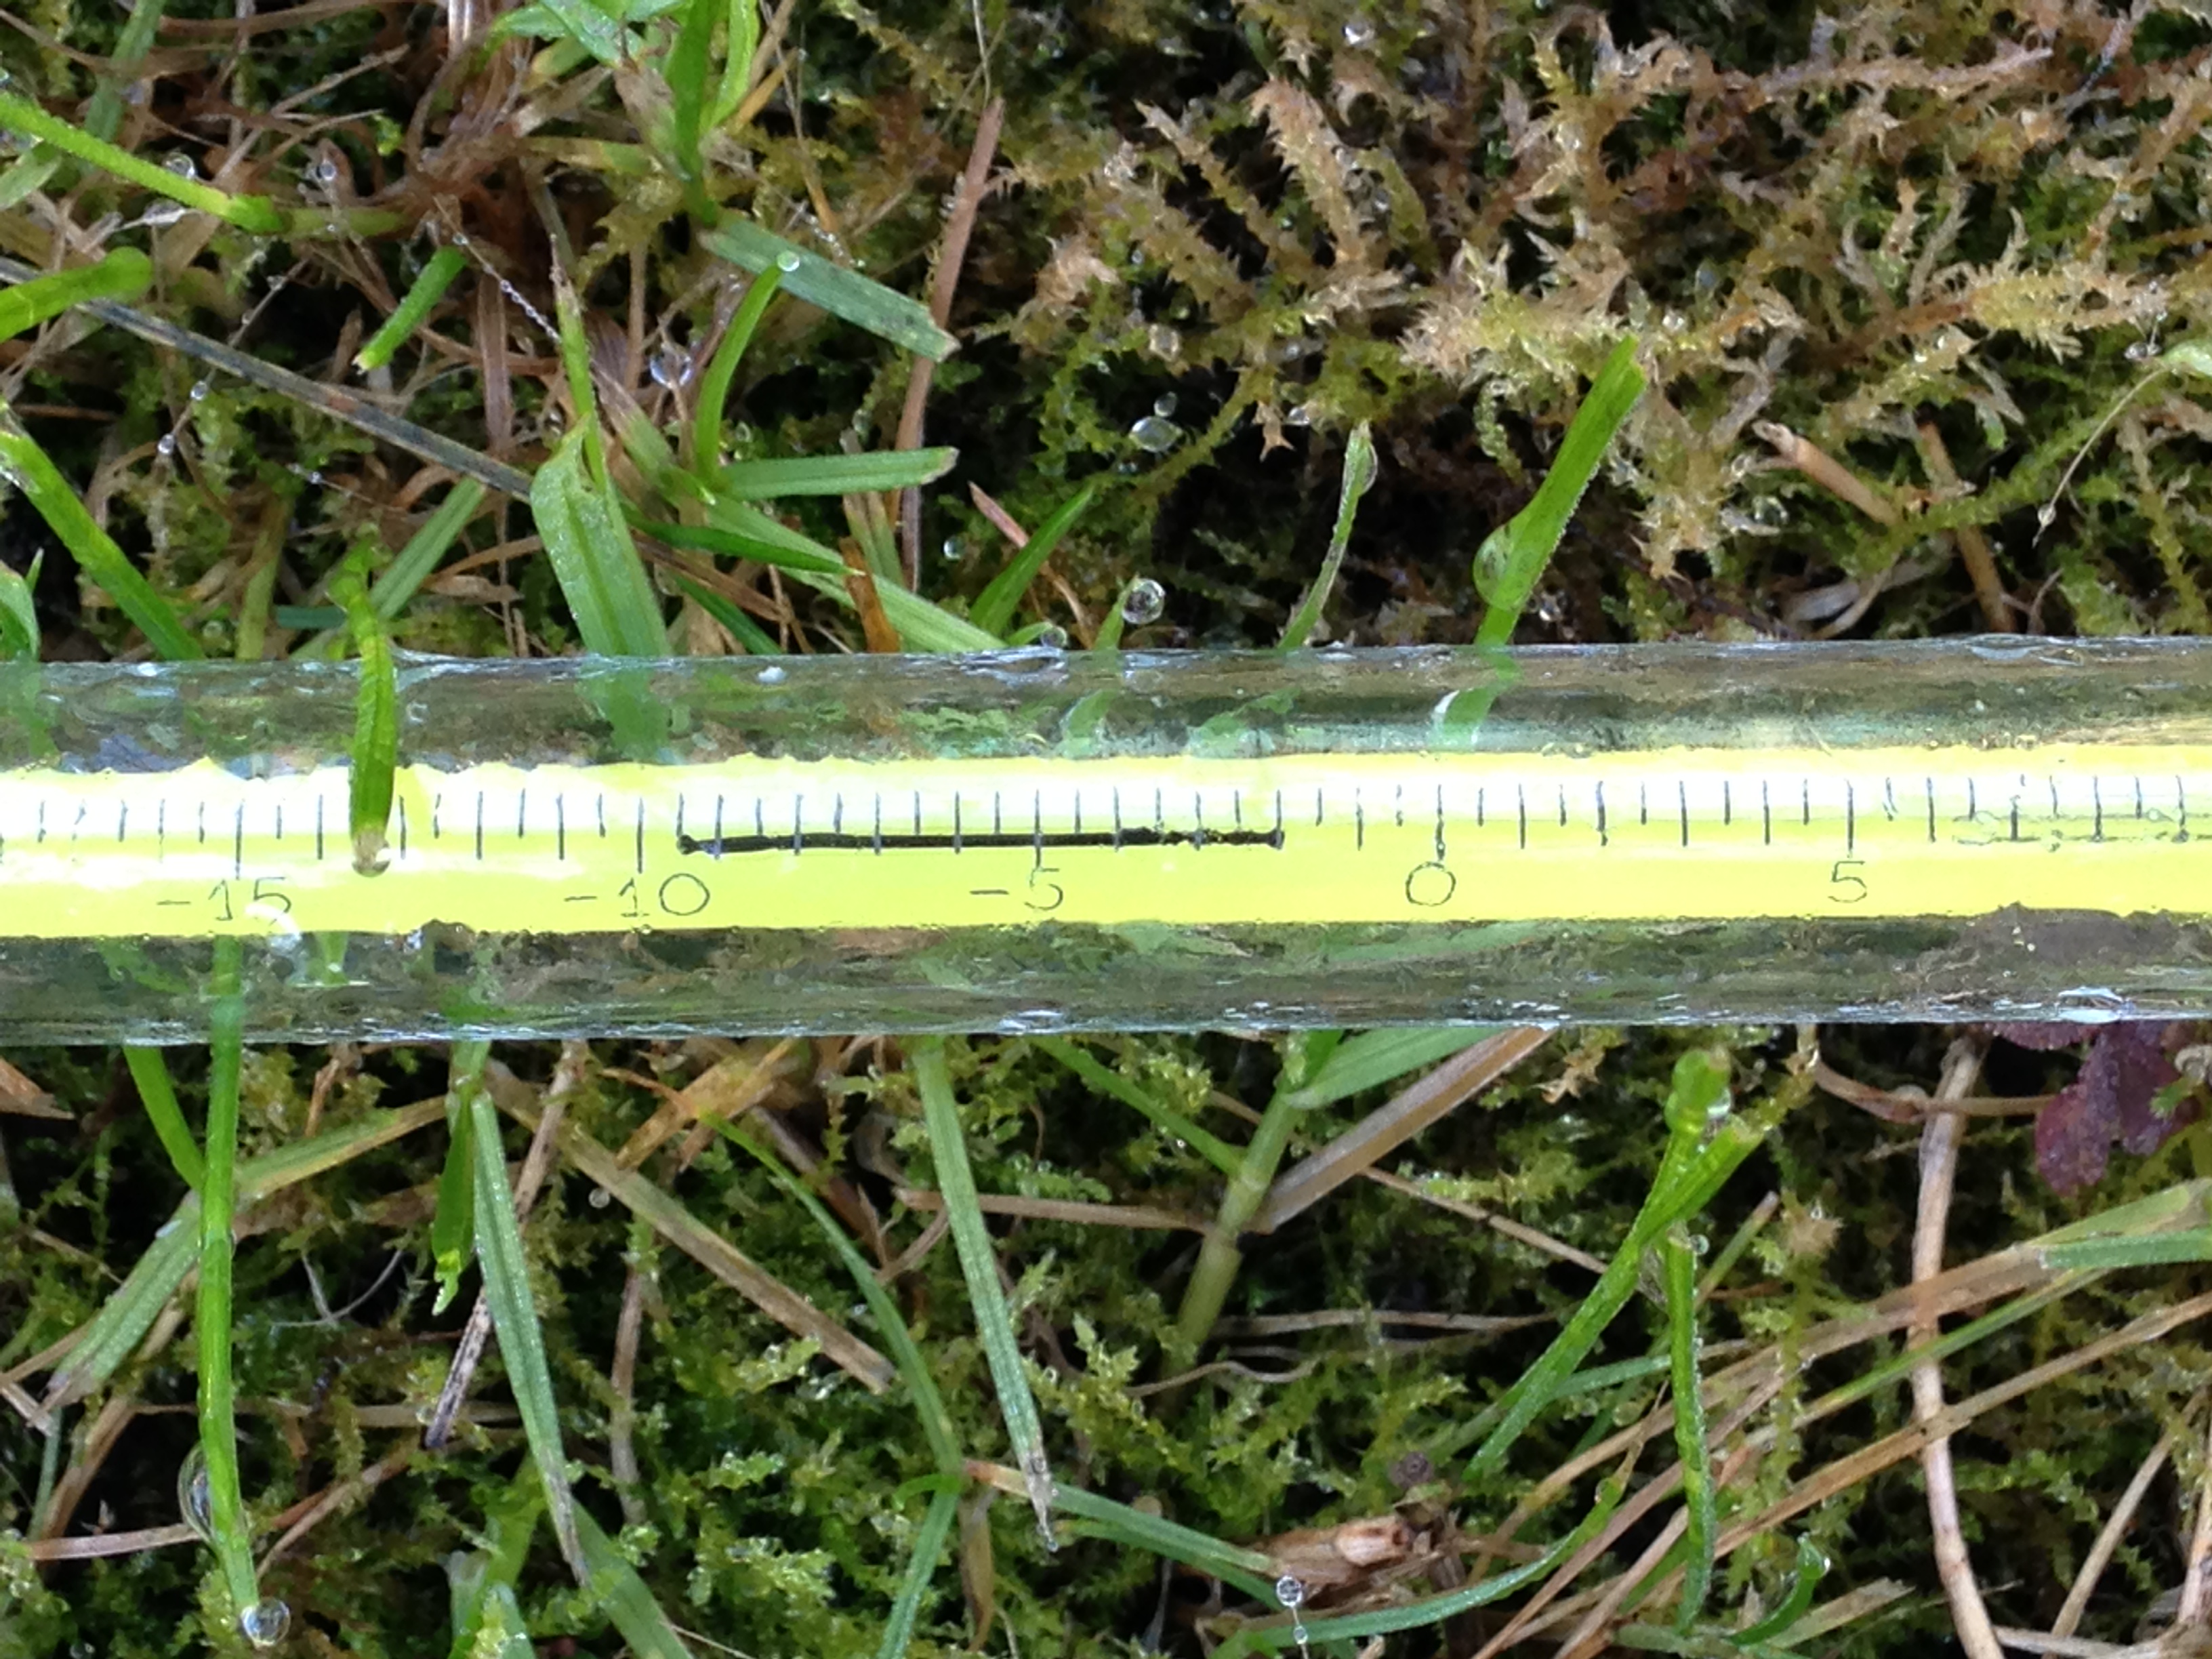
Rainy days were common through November. This system brought 5.6mm
The November mean was 10.5C, the third warmest on record back to 1797. Only 2011 and 1994 were warmer.
Just 31.7 hours of sunshine were recorded in this area: 54% of average, the dullest November for 47 years, and 9th dullest in the series going back to 1881
Rainfall was more run-of-the-mill: 64.3mm fell during the month: that’s 109% of average.
The warmest day occurred on the 6th with 17.2C recorded. The first air frosts of autumn were recorded. The lowest temperature occurred on the 21st when the mercury fell to -4.1C.
The wettest day was on the 3rd when 7.5mm of rain fell. There were only three completely dry days during the month – a real problem for anyone who works outside.
The beginning of the month was foggy
The sunniest days were on 21st and 22nd when four hours of sunshine were recorded.
What has December got in store weatherwise? The models today (December 1st) suggest the beginning of winter will be held at bay with most model output keeping the Atlantic in control of the weather – persistent high pressure to the SW, south and SE and a strong jet stream funneled between this high pressure zone and low pressure to the north and NW.
Winds throughout the first 15 days will be blowing from between SW and NW.
Because of the exceptionally mild November I wonder how accurate my long range method will be in estimating December – but in the interests of consistency I’ll have a crack anyway.
A mean of about 5.1C with 70mm of rain, on the wetter side of average and with average to slightly below sunshine. The highest probability is for rather cold at 50% probability. Average 25% and rather mild, suggested in my winter forecast, comes in at 25% probability.
My November outlook for temperature was way off. I predicted a mean of about 9C, rather mild, but the result was 10.5C, very mild. This chance showed at just 6% probability.
Here follows the full weather diary for November. To view full stats follow this link:http://1drv.ms/1kiTuzv
1st Foggy start, lifted to brief sunny spells early afternoon before mist thickened up again and saw Wanstead Flats’ fireworks cancelled
2nd Foggy start. This cleared earlier than yesterday but sunshine was weak
3rd Cloudy start though turned brighter at 10.30am. Spots of rain at 5.30pm then cloud and mild. Rain at first light
4th Rain to start then briefly brighter
5th Cloudy then rain from 2.30pm to 5.30pm. Mild and damp overnight
6th Short burst of rain at 9am then more at 9.45am. Further short bursts of rain but then mostly cloudy
7th Light rain to start, this grew heavier through the morning with quite gusty winds – the first of the autumn. Heavier showers earlier afternoon before the rain cleared at dusk
8th Cloudy with only brief brightness. A light shower in the evening
9th Cloudy through most of the day and very breezy. F6 at Walkie Talkie
10th Cloudy to start and very breezy. Spots of rain at 2pm
11th Cloudy through the day and breezy
12th Sunny start though cloud tended to fill in as breeze picked up from ‘Abigail’
13th Sunny start , gradually clouding over with some sharp gusty showers and a heavy one at 2pm
14th Light rain, becoming heavier though turning patchy around noon. Heavier again at 2pm. Petering out in the evening
15th Bright blustery start, the wind continuing through the day
16th Cloudy start with some initial brightness, then cloudy. Rain when we turned up at 8.45, heaviest at 10.45pm
17th Cloudy up until 1pm when it started to rain. Breeze began to pick up with gusty evening – 33.6mph was strongest gust since St Jude storm – wind moderated after 10pm but remained breezy
18th Sunny, bright start though gradually clouded over as breeze picked up. Some squally showers around, mostly south of the river with rain lashing off side of buildings
19th Cloudy start with light rain spreading in at 10am. Outbreaks of light rain until lunchtime then a heavier shower at 3pm. Then overcast and cooler
20th Cloudy start – this cleared just before 1pm to give sunny spells. NW’ly set in through the day with ever cooling air. Sleet falling at 7am
21st Cloudy with heavy burst of sleety rain at obs time. Sky quickly broke to sunny spells but a very cold wind. A cold night
22nd Sunny and sub zero to start after heavy overnight frost. Sunny spells through the day, the frost returning at 2.50am
23rd Sunny, frosty start with some alto cumulus. Cloud grew thicker with rain before midnight that was light through the early hours
24th Cloudy start but with light rain spreading in from 11.30am then stopping and staying cloudy. More rain overnight
25th Light rain to start, stopping at 9.40am then cloudy. Temp dropped through the day with sunny spells
26th Sunny start then turned more cloudy at 11am
27th Cloudy start. Some warm sunshine late morning then turned cloudier with strong gusty squall at 7.30pm. Clear spells overnight that led to ground frost
28th Sunny start, clouding over at 10.30am before light rain spread at 2pm and then gusty winds after dark
29th Cloudy and breezy most of the day thanks to Clodagh
30th Cloudy and breezy with occassonal drizzle
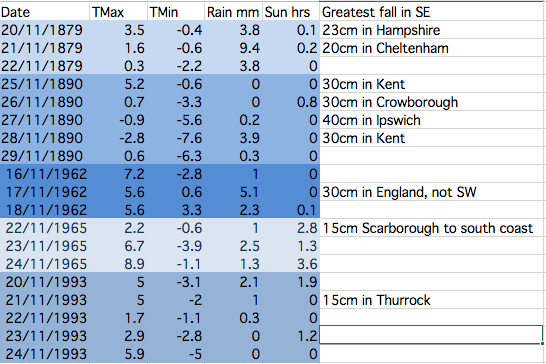
This table shows the stats for Greenwich during spells when there has been heavy snowfall somewhere in the south-east. The figures reveal that it is very hit and miss and that the associated air doesn’t stay cold for long. There is a link to UK-wide November snowfalls here: http://1drv.ms/1PjOB9H
November has produced some potent snowfalls in Scotland and northern England over the past 150 years. These brief shots of cold air, often direct from the North Pole, however very rarely produce anything that can sustain long-lasting low-level snow in London and the Home Counties.
With the GFS weather model occasionally hinting at a blast of polar maritime air I decided to have a look back through the records to see how frequently the capital has turned white during the eleventh month.
Anyone who is familiar with the Objective Lamb Weather Type (LWT) data series will know that there may be an increased likelihood of things turning colder at some point this month. Last month was the joint 5th most anticyclonic October in the LWT series data series that runs from 1871; resulting stats closely resemble both October 1946 and 1962 as being very anticyclonic. Another similar year is 1972.
November 1972 was mild till mid month and then turned much colder with snow in places. November 1962 was cyclonic till the 24th, and then anticyclonic, with a cold northerly outbreak from the 18th for a few days with snow, before turning rather mild. November 1946 in complete contrast to both years, was a mild, dull and very wet month.
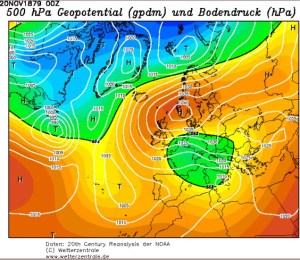
The most impressive November snowy spells seem to have occurred in the late 1800s. These two 500mb reanalysis charts show a cold feed from Scandinavia in both cases.
Snow and sleet falling in the London area is obviously much more common than snow lying. The snowiest Novembers were in 1919 and 1952 when snow or sleet fell for 10 days at Wallington and Hampstead respectively.
Kew saw snow or sleet on 8 days in 1919, while Heathrow and Northolt recorded snow or sleet on eight days in 1952.
This small article appeared on the front page of Reynold’s Newspaper in November 1890
The only decent snowfall that occured in London in my lifetime was November 1993 – and I was abroad for that. I remember my dad mentioning it in a letter written to me as I travelled round China. It arrived in the early hours of one Sunday morning and fell to a depth of five inches.
Given that was the last time London saw a decent fall I won’t be holding my breath that we’ll see any this month – though, if you live in Scotland, the odds are much narrower.
Before 1861 information on snowfalls becomes scarce – at least in terms of correct quantity. However, heavy snowfalls obviously did occur. On November 17, 1816, the Inverness Journal contained this report:
“The winter has commenced with a severity almost beyond example. Frost, rain and snow have been almost incessant during the last week and the greater proportion of corn still uncut or in stocks has suffered material injury.
“We regret to say that several lives have been lost. A postboy of Bennet’s coming from the south was obliged to leave his chaise on the road and would have been lost but for the lights shown from the windows of Moyhall which he reached nearly in a frozen state. The obvious advantage of keeping lights in stormy nights in the windows of houses in the country has thus been illustrated
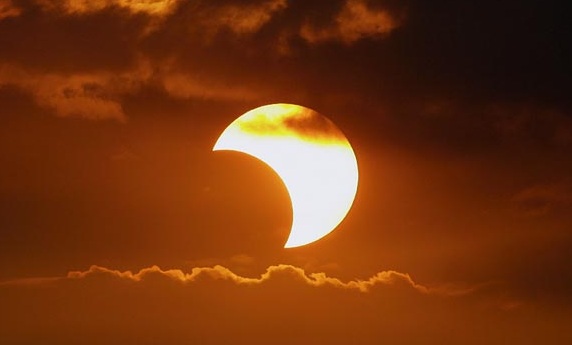
“The winter it appears has set in with extreme severity in the interior of the continent. At Augsburg on the 19th of November the eclipse of the sun was entirely obscured by a fall of snow which commenced at 7 o’clock in the morning and lasted till noon. The ground was covered with snow a foot in depth. There was a great fall of snow at Frankfurt on the same day and Reaumur’s thermometer showed at from 9 to 10 degrees below the freezing point.”
Perhaps the most impressive, modern day snowfall in the south of the UK occurred around November 18th 1972 when observers recorded 60cm of snow on Dartmoor. Synoptic charts and other data are attached below.
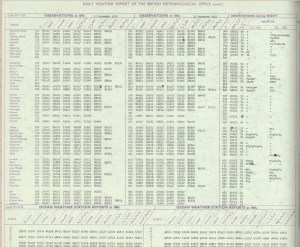
Image courtesy of the Met Office
Image courtesy of the Met Office
Image courtesy of the Met Office
Image courtesy of the Met Office
Inspiration for this piece came from Dr Richard Wild’s PhD study on snowfall which you can find here.
This October was the coolest since 2012 though the mean of 11.7C is just 0.1C below average – nearly 2C colder than the same month last year.
The last week of the month saw the leaves turning in earnest. The horse chestnuts, such as this one in Wanstead Park however, turned much earlier because of the leaf miner pest
A persistent anticylone around mid-month pumped quite cool air from the north-east for a time, prompting some cold nights. Though we have yet to experience an air frost this autumn the ground temperature fell below freezing on five nights – that’s five occasions more than last year: -2C was recorded during the early hours of the 8th.
The month was rather dry: some 46.8mm of rain fell which is 70% of what we can expect in an average October. The wettest day was the 27th when 19.4mm fell. The heavy rain in the early hours of the 28th was quickly replaced by sunshine and a stunning day followed.
Just over 91 hours of sunshine were recorded – that’s 86% of what we can normally expect in an average October.
What has November got in store weatherwise? The models today (November 1st) suggest this week will see a gradual decline in conditions overall as the ridge from Europe weakens and weak Low pressure edges up from the south and SW. Thereafter it looks like winds will settle SW’ly as high pressure relocates to the south of the UK, bringing this area mild temperatures and mostly dry and bright conditions – though a little rain will be possible at times. Overall the models continue to have little appetite to serve us up anything remotely cold and stormy.
My long range outlook method suggests that November will be average to rather mild temperature-wise, a mean of about 8.9C, at 56% probability. The next highest probabilities are for rather cold or cold, at 18% probability. The chance of a very mild month comes out at just 6% probability.
The highest probability for rainfall is 69% for something average to rather dry, between 37mm and 59mm. A wet November comes in at 20% probability.
My data for sunshine only stretches back to 1878. The signal is for something average, at 60% probability.
Looking beyond November it is notable that October 2015 was very similar to October 1997 – the year another strong El Nino occurred. A very mild winter unfolded from 1997-98, though I’m sceptical about how much influence ENSO has on our part of the world.
With the sun lower in the sky at this time of year there’s often a great opportunity for a decent sunset
My October outlook for temperature was good in that I estimated that there was a 44% chance of the mean being average. My rain estimation was way out in that a signal for a rather dry October was only a 22% probability – though bearing in mind that the probability for a wet October was only 33% it is not surprising the outcome was wrong.
Here follows the full weather diary for October…Full stats for the month here:http://1drv.ms/1rSfT7Y
1st Sunny with just a few wispy clouds. Heavy overnight dew.
2nd Sunny and clear all day and evening. Mist thickened overnight with fog elsewhere in the UK.
3rd Misty start and cloudy till midday. Evenutally cleared to leave sunny spells. Cooler than yesterday.
4th Sunny start but with a few cumulus developing during the day. Clouding over during the night with few drops of rain from high-level feature before obs time.
5th Cloudy start with rain spreading in after midday, this being steady on and off into evening before turning to drizzle late evening and lasting into early hours. Another outbreak of rain at 9.30am to obs time.
There were five ground frosts during the month of October
6th Rain to start, some of it heavy. Drying up a bit at 11.30am. More rain in the evening and overnight into the early hours. Rain again at 9.20 until obs time.
7th Cloudy start but with rain moving in again. This rain dried up a bit at 11am but then more rain at 2.30pm before petering out and clearing overnight to leave it cold.
8th Sunny, clear start with just a few cirrus. More cloud at noon and through the day. Cleared at dusk to give a cold night and heavy dew.
9th Sunny start but cloud bubbled up from noon to give cloudier periods.
10th Bright start though stayed mostly cloudy and cool. Milder overnight than of late.
11th Sunny start with a bit more of a breeze. Some alto-cumulus late on made for a stunning sunset. Cloud overnight held up temperature.
12th Cloudy start, some brightness at 11am.
13th Cloudy, cold start with cloud off North Sea making it feel colder. Cloud was very thick at 3pm with drops of drizzle.
14th Clearer periods overnight saw temperature fall sharply but too much wind for frost.
15th Sunny with just a few cumulus – very cold wind though. Cloud thick enough at times for brief showers through day. Quite overcast at night
16th Cloudy start though with some brightness. Strong easterly breeze.
17th Cloudy though warmer than past week. Felt a bit muggy.
18th Cloudy and breezy start, cloud persisting through the day.
19th Bright start and was more glimpses of sunshine than past few days. However, cloud returned with a vengeance last afternoon – felt like it was getting dark at 5pm.
20th Cloudy all day. Clearer overnight.
21st Cloudy start. This turn to long sunny spells and a pleasant afternoon.
22nd Rain to start which fell until 2.30pm. Then outbreaks of rain into the afternoon. Cloudy and damp overnight.
23rd Bright start though mostly cloudy through the day.
24th Cloudy all day. Feeling colder.
25th Cloudy start with light rain around 10.40am then intermittent. Very heavy burst of rain after dark before the skies cleared to leave a cold night.
26th Bright start with cloud breaking to long sunny spells – pleasant in the sun. Temp fell away quickly at dusk. Precip was dew accumulation.
27th Sunny start. Some cloud developed through the day but then largely melted away to leave a warm late afternoon.
28th Cloudy start. This broke to sunny spells into the afternoon in Rye. Light rain seen in Rye at 8pm – this turned heavier into the evening but most fell at dawn.
29th Bright start but quickly clouding over with rain in the evening and overnight.
30th Light rain and drizzle to start then cloudy all day and overnight.
31st Bright start, the cloud gradually clearing to leave a warm afternoon.
The partial solar eclipse taking place on March 20th left me wondering if there is any record of past events for this area.
Luke Howard‘s The Climate of London describes a similar such event that took place on September 7th, 1820. Howard describes how the thermometer fell from 68.5°F to 62.5°F. After making observations at his home in Tottenham at 10.30am Howard made his way to Stoke Newington to visit fellow scientist and Quaker, William Allen, to observe and record the eclipse.
From his account it appears that, though the weather was settled, there was a fair bit of cirrocumulus drifting across the sun during the eclipse.
As well as the fall in temperature Howard’s account describes the strange light: “The sunshine against the house was so dim as to be quite striking; and the view before us to south, which included the nearer parts of London, showed much the same as afterwards at six In the evening – dusky but not dark.”
Howard noted that the lowest temperature was observed about seven minutes after the greatest obscuration. He also mentions that his son noticed that spots of light falling through the shade of trees were in the shape of crescents, mirroring the lunar disc across the sun, rather than globular. He also states that Venus was very easily visible during the eclipse.
Though Howard’s account is by no means groundbreaking, it would be another hundred years before another eclipse proved Einstein’s theory of general relativity, it is fascinating how we are still just as fascinated by the sun as our forbears were.
I was in southern Turkey for the last solar eclipse which I believe was overcast in the London area. I had some data from my then AWS but I’ve misplaced it. That Oregon unit didn’t have the means of recording every minute.
Though I was outside the area of totality I still experienced the classic eclipse effects: the birds singing before going silent, reduced warmth of the sun and a very strange and eerie ‘blue’ light that is cast over everything. I’ve not experienced anything like it since and only hope that the sky on March 20th is a bit clearer than it was 16 years ago.
It is impossible to know what the weather will be like on the day at this range though a look back through my records to 1981 reveals that weather conditions on March 20th, the Vernal equinox this year, can vary greatly. In 2003 a high of 17.5C was recorded with 6.9 hrs of sunshine. However, two years earlier, the temperature reached just 4C as 8.2mm of rain fell.
It seems the media is working itself up into a frenzy over the eclipse, talking up the possibility that the event will cause a power surge that could interrupt supplies across Europe. However, the fact that solar accounts for just 10% of Europe’s renewable energy would suggest that such hyperbole is similar to the hysteria over the Y2K ‘Millennium Bug’ that failed to materialise?
* I will be revisiting this blog after the eclipse has happened to post results from my AWS readings.
** There’s a full account of Luke Howard’s eclipse here
Signals for winter have always been well reported by the media. Back in the 1980s weather anoraks across Britain would wait with bated breath to read Bill Foggitt‘s latest prognostications for the coming winter. Though Foggitt had some success his observations, among other weather ‘gurus’, often amounted to weatherlore that has only a slightly greater than evens chance of being right.
One popular myth is that very large blackberries mean a harsh winter. The fact that this has more to do with plentiful rainfall plumping up the fruit at harvest time is ignored.
Colin Finch’s 38F minus rule is altogether different and provides a very good guide to the kind of weather we can expect in January and February. For the rule to work the maximum temperature must be 38F (3.3C) or less for four consecutive days before Christmas Day.
Colin, an amateur meteorologist who passed away in 1991, spent much time researching his rule in the 1970s. He found that most of the coldest winters since the end of the second world war gave a hint of things to come in the weeks leading up to Christmas: the Decembers of 1946, 1955, 1962, 1968, 1969, 1978 were all followed by cold late winters. In 1984 and 1985 the cold spell arrived at Christmas. Other years to loosely follow the rule, 1986, and 1990.
A few weeks ago I was reminded about Colin’s findings and decided to have another look, using daily record data for this area stretching back to 1806.
The results were surprising. If there is a run of cold days (3.3C or less) around mid-month the chance of an average to colder than average January and February is 94% and 74% respectively. The chance of an average to colder than average March is 96%. Also notable is that the chance of a severe spell in January (4C colder than normal) is 30%.
So much for the figures. What are the chances of a run of cold days between now and Christmas Day?
Sunset Southwark Bridge
Up until this week the weather has been fairly quiet with little rain and cold, often frosty nights. But westerlies are now roaring back in from the Atlantic and could be a hint of what is likely to prevail later in the winter. However, the ‘crunch’ time for the 38F minus rule comes soon after the middle of the month. If a spell of Arctic weather develops at that time, even if it lasts only a few days, then the chances of a major cold spell after Christmas are much higher.
As I write this blog the models suggest that a run of cold days may just be possible. It is also notable that the likelihood of a sudden stratospheric warming event, argued by many to be a precursor for conditions that would favour the development of a cold spell, is increasing with a peak set for mid January.
We’ll see but Colin Finch’s findings all those years ago are fascinating and are still relevant today.
* The following obituary appeared in an edition of Weather magazine, a publication of the Royal Meteorological Society, in 1991.
“Colin Finch – The news of the sudden death of Colin Finch on Friday, 23 August 1991 at the tragically early age of 55 will be received with sadness by Members of the society and readers of Weather.
There is no doubt that Colin was one of the most enthusiastic amateur meteorologists that the Society has ever had and, without seeking publicity for himself, he was responsible for making many other amateur enthusiasts aware of the Society and encouraging them to join.
Colin’s interest in the weather began when he was a small boy and received a considerable boost during the snowy and very cold winter of 1946/47 when he was 10 years old. In 1949, at the age of 13, he began to take regular temperature and rainfall readings and gradually added more sophisticated equipment. His record of daily weather data was unbroken until July 1991 when he became too ill to continue.
When he left school in 1953 he joined the Meteorological Office as a Scientific Assistant at Kingsway and was trained under the keen eye of Dick Ogden. Later, after a spell at Heathrow Airport, he left the Office frustrated by his inability to develop a career because he didn’t have sufficiently good educational qualifications. Instead, he turned to a successful business career but his enthusiasm for weather observing and forecasting increased.
Each day he plotted and analysed synoptic charts compiled from short-wave Morse code transmissions which he took down by hand. In the 1960s and 1970s it was quite normal for him to spend Saturdays plotting a chart for the whole of the Northern Hemisphere from Morse broadcasts. Later he had facsimile and satellite-receiving equipment installed at home.
By the late 1960s he was liaising with local authorities and the police in Surrey, warning them of the likelihood of severe weather events. In 1970 he joined the then newly introduced BBC Radio London and every Friday morning he would discuss current weather events and give climatological background data about the week ahead. For these broadcasts he would get up in the early hours to plot a synoptic chart before he went to the studio.
After the broadcasts he would go to the City for a normal day’s work. He kept up this punishing schedule for several years. When the Society introduced the highly successful one-day Saturday discussion meetings in September 1972 Colin was one of the first amateur meteorologists to give a presentation and he was a regular contributor to these occasions. He was an imposing figure, 6ft 4in tall, and was easy to seek out at meetings.”
Christmas in Victorian London is often portrayed as very cold and snowy – picture perfect images of Yuletides past always scream out at us every year we open a box of Christmas cards.
The Temple, Wanstead Park, always looks that much more stunning with a covering of snow
But a look back through the meteorological records of the Royal Observatory at Greenwich reveals a very different reality.
The 1840s and 1850s, decades where most Christmas traditions marked today began, were often very mild, wet and windy – indeed before 2015 the warmest Christmas Day maximum temperature at Greenwich occurred in 1852 when the mercury reached 13.3C.
Like modern times, however, there were exceptions and 1840 was very cold – the record for Christmas Day mentions “trees coated with rime (ice) 3/8 inch thick”!
The following 20 years saw Christmas morning much milder – well over half had maxima of 6C or higher. In 1843, the year Charles Dickens first published A Christmas Carol and the public sent their first Christmas cards, the temperature reached a balmy 10.1C – though dense fog probably made it feel at least a bit more seasonal.
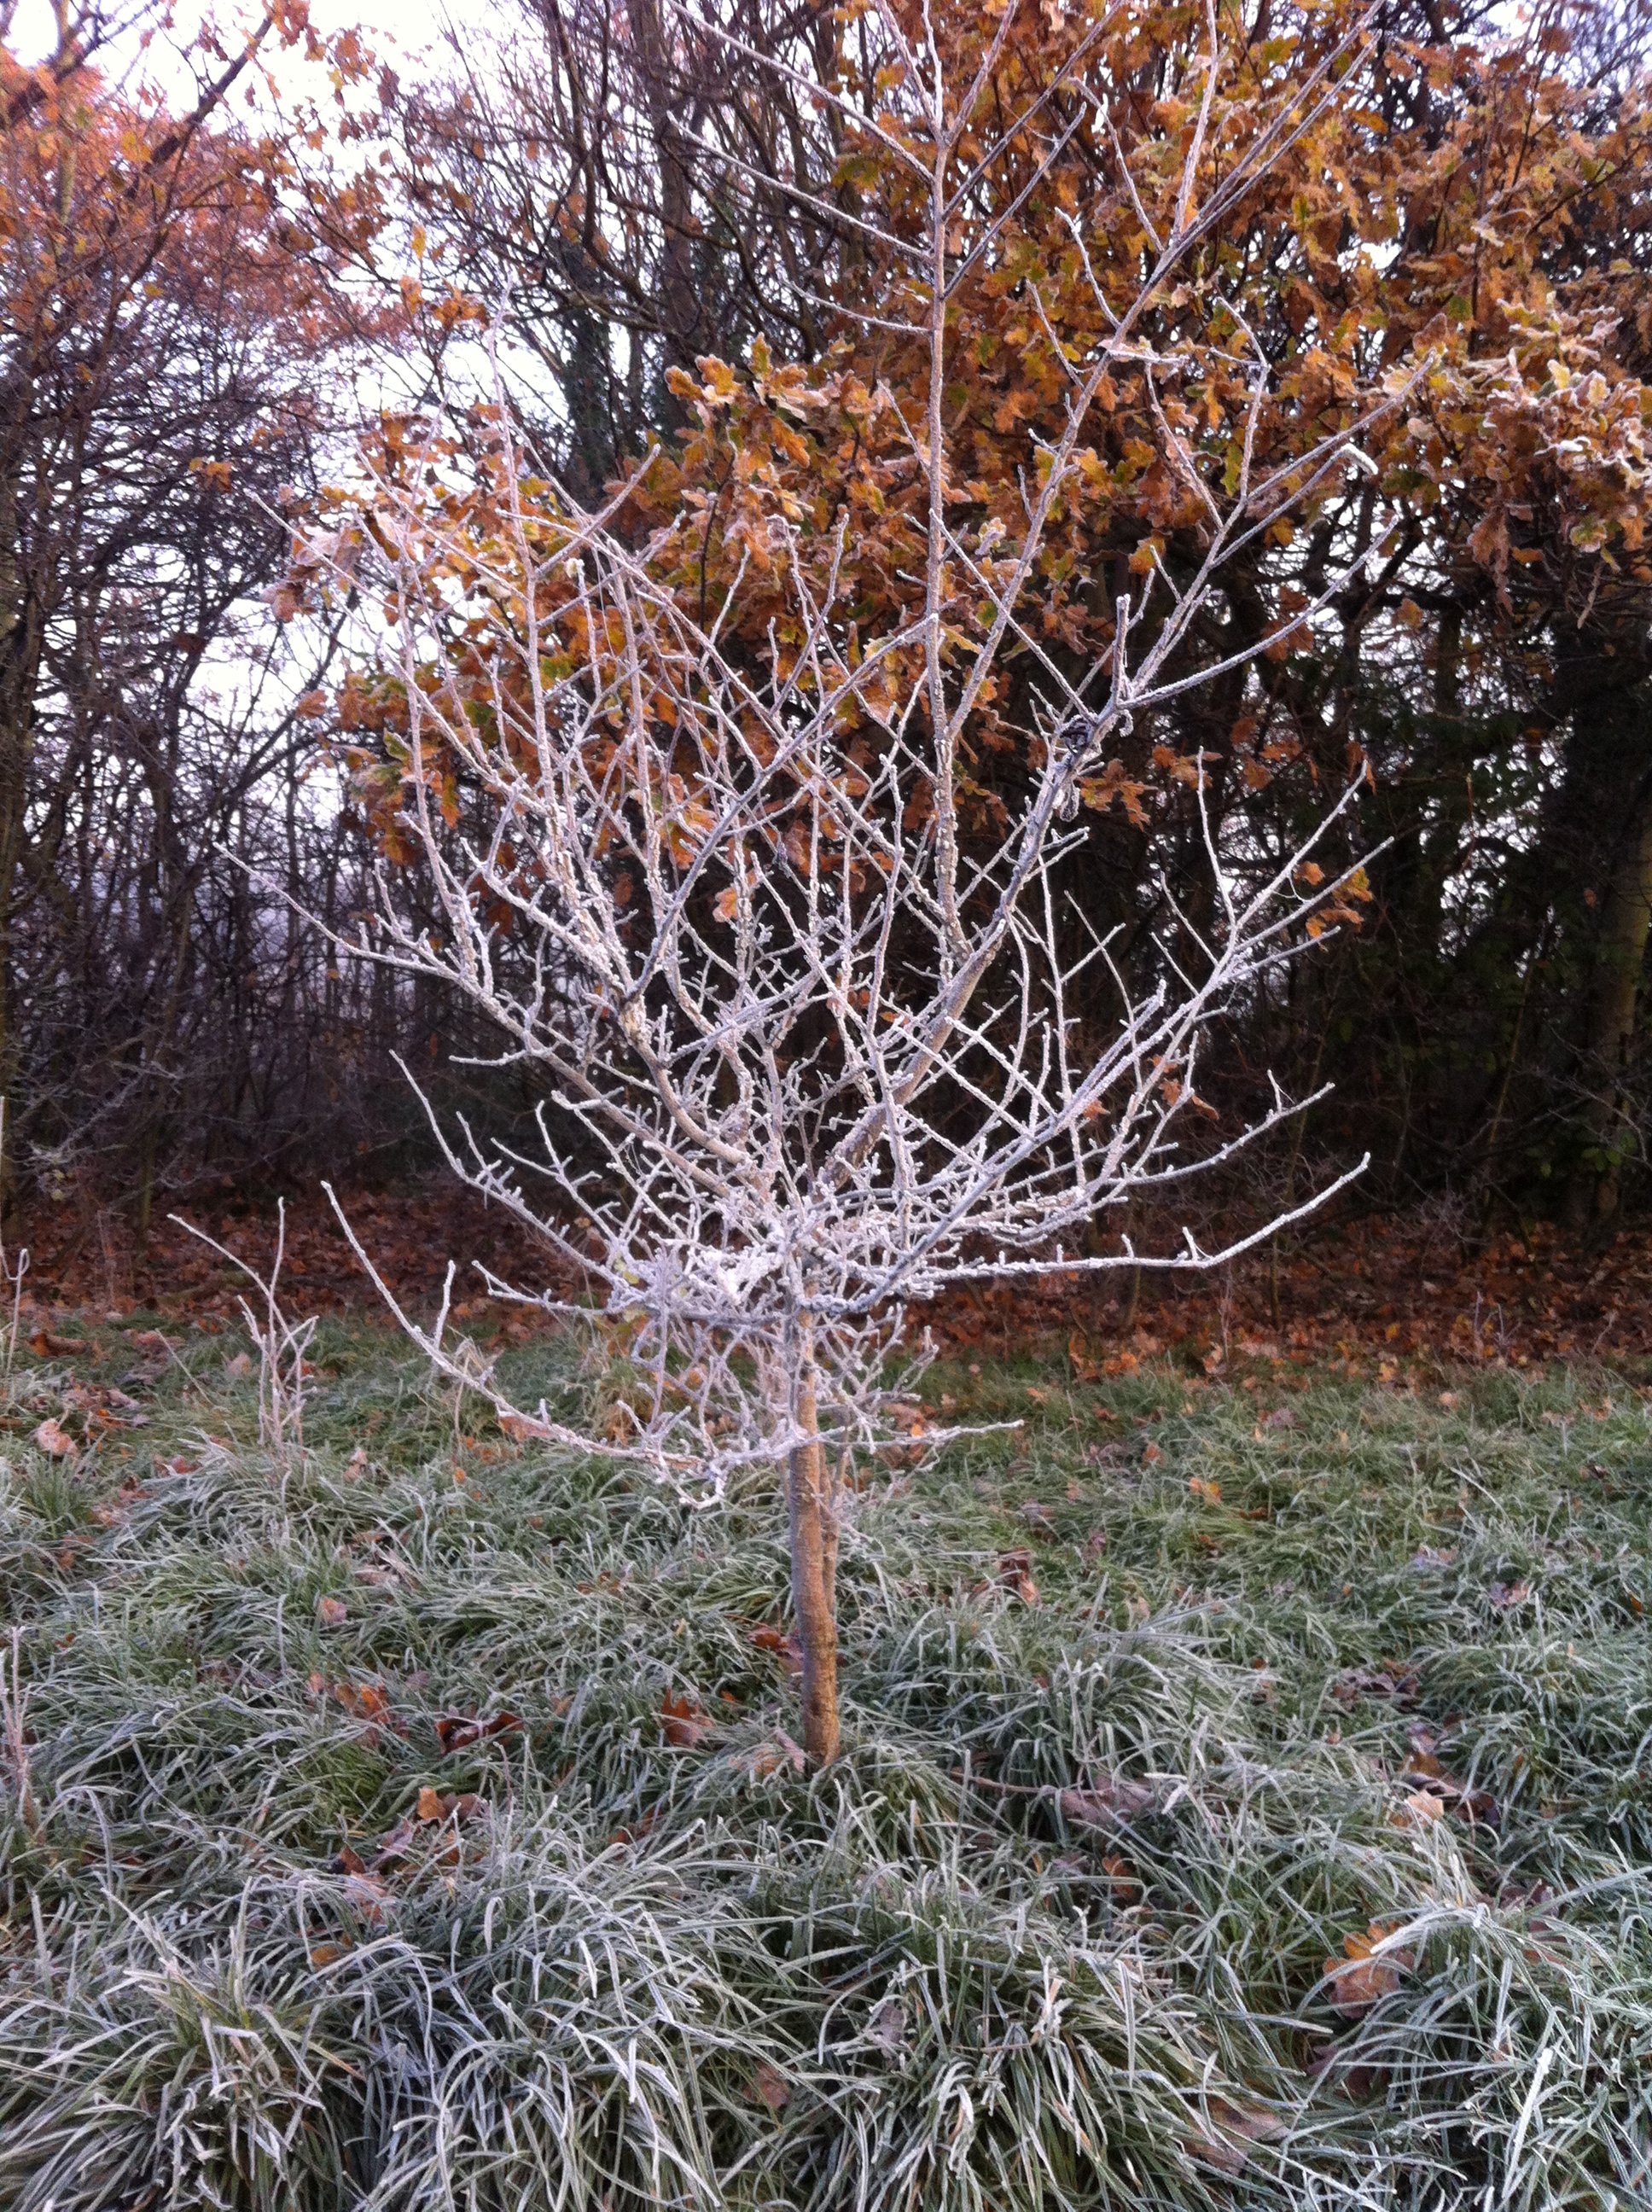
Frost is a common feature of Christmas Day
Four years later in 1847, the year the capital’s Tom Smith invented the Christmas cracker, things were a bit colder – a high of 4.2C and overcast with rain late evening. The following year an image of Victoria and Albert celebrating with their family around a Christmas tree appeared in the Illustrated London News. Like many things Royal down the years it really captured the public’s imagination of taking a spruce or similar evergreen into their living rooms and decorating it every Yuletide.
Christmas two years later, in 1849, was at least cold enough for something wintry to fall. London, however, was still coming to terms with its worst-ever cholera outbreak. With around 14,000 deaths from the disease Christmas was probably not a high priority that winter.
When Good King Wenceslas was first included in Carols for Christmas-Tide in 1853 the day was cold but there was still no “deep, crisp and even” snow or “rude wind’s wild lament”. The day stayed calm and clear.
Though the period either side of December 25th began to be marked with cold, snowy spells it would be another 11 years before London experienced its first official white Christmas in 1864. Sleet, which fell at the end of a 4-day cold spell, probably added to the drama of swimmers taking part in the first Christmas Day swim in the Serpentine, Hyde Park. With a high temperature of just 1.4C it’s quite feasible the few who braved it probably had to break the ice before they took the plunge.
Five years later London experienced another white Christmas with snow falling in a north-easterly breeze – the start of a four-day cold spell.
The joint-coldest Christmas Day on record followed in 1870 with a mean temperature of -7.2C. The building of the Royal Albert Hall was scheduled to be completed by December 25th but it was not until March 29th 1871 that it was officially opened by Queen Victoria.
The remainder of Victoria’s reign was marked with far more white Christmases, a period where nearly two-thirds of Decembers were marked with extended cold, snowy spells. Fog and frost were also frequent.
With a new century and new monarch Christmas-time turned milder and London would have to wait until close to the end of Edward VII’s reign in 1909 to see a ‘white Christmas’ – a poor affair with just a bit a sleet mixed in with the rain late morning. Many probably failed to notice it but it still counts as a white Christmas according to modern bookie’s standards.
Christmas Day can also be stormy
Four of the 26 Christmas Days of George V’s reign were white but the mean temperatures suggest they were all marginal affairs – the core cold weather happening either before or after the 25th. Of note also is the dominance of south-westerlies that brought mild and wet weather – nine out of ten Christmas Days in the 1920s saw rain falling – far in excess of the average for rain on Christmas Day which is 47 per cent.
Just one Christmas was white during George VI’s reign, a ‘good covering of snow’ was recorded by observers at Greenwich in 1938 – the snow falling at the end of a 7-day cold spell.
Sunshine was not a dominant feature of Christmas Day prior to Queen Elizabeth II coming to the throne – the average total in Greenwich from 1877 to 1951 was just under 0.8hrs. Yet the average sunshine total for Christmas Day for the first four years of Elizabeth’s reign jumped to 5.2 hours. The 6.5 hours on Christmas Day 1952 is a record that still stands today! It is remarkable that this record was set just over a fortnight after the Great Smog contributed to the deaths of 4,000 people though other studies put the figure at 12,000 people.
The Clean Air Act 1956 ironically saw the return of dull Christmas Days – though 1956 was a white Christmas with a light covering of snow and a maximum of zero Celsius.
White Christmas Days that followed included 1957 (showery sleet), 1964, 1968 (sleet), and 1970.
Christmas Day 1976 was the last time snow actually fell on Christmas Day in this area though, officially, the last white Christmas was 1996 when a few sleety flakes fell in the early morning.
Christmas Days since then have been mostly mild affairs in London. Of course we had a taste of what a Dickensian Christmas Day was like four years ago when the mean temperature for the day was -1.9C. There were still small patches of snow in our gardens but these were leftovers from a previous dump, so it doesn’t count as a white Christmas. Frustratingly, there has been snow on several Boxing Days in Wanstead (1995 and 1996) and in the weeks running up to Christmas, but not on Christmas day itself.
The warmest Christmas Day in this area occurred in 2015 when a maximum of 15.2C was recorded. Warm air sourced from off the west coast of Africa sent dew points soaring, the minimum on Christmas Day night into Boxing Day did not fall below 13.5C, another record.
The synoptic chart for 0000z Christmas Day 2015 shows ever-warmer air being pumped northwards over the British Isles.
It is surprising how varied the weather can be on Christmas Day – we always think that Yuletide in the ‘Olden Days’ was a cold affair but a look back to 1840 reveals there were times when it was just as mild as it has been in recent years.
Christmas Day morning 1927: the wettest with some 24.9mm recorded
* Statistics for every Christmas Day since 1840 can be found here.
** The definition of a white Christmas used most widely – notably by the bookies – is for a single snowflake, even if it lands in the midst of heavy rain, to be observed falling in the 24 hours of 25 December at a specified location recognised by the Met Office.
*** In the past 170-odd years there has only been 19 white Christmases: in 1864 (sleet), 1869, 1876, 1878, 1884, 1895, 1909 (sleet), 1916, 1919, 1925, 1927, 1938, 1956, 1957 (sleet), 1964, 1968 (sleet), 1970, 1976, 1996 (sleet)


 With so much rainfall overall sunshine was affected with only 451 hours recorded, just 80 per cent of what can be expected in an average summer.
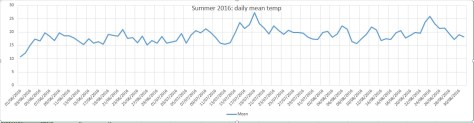


You must be logged in to post a comment.