Tag Archives: East London weather statistics

Halfway through winter: where’s the snow (again)

Five years ago I blogged about the lack of snow at the midway point through winter. This winter there has been a similar total lack of snowfall though this time it is benign anticyclonic conditions that have characterised the past 45 days rather than the raging zonality of the winter of 2013/14 which ended completely snowless in this area.

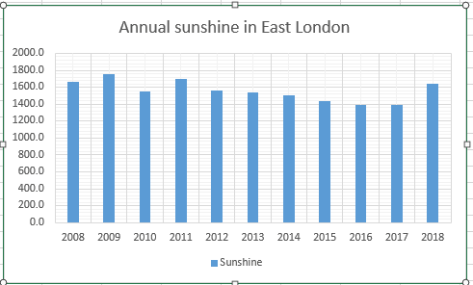
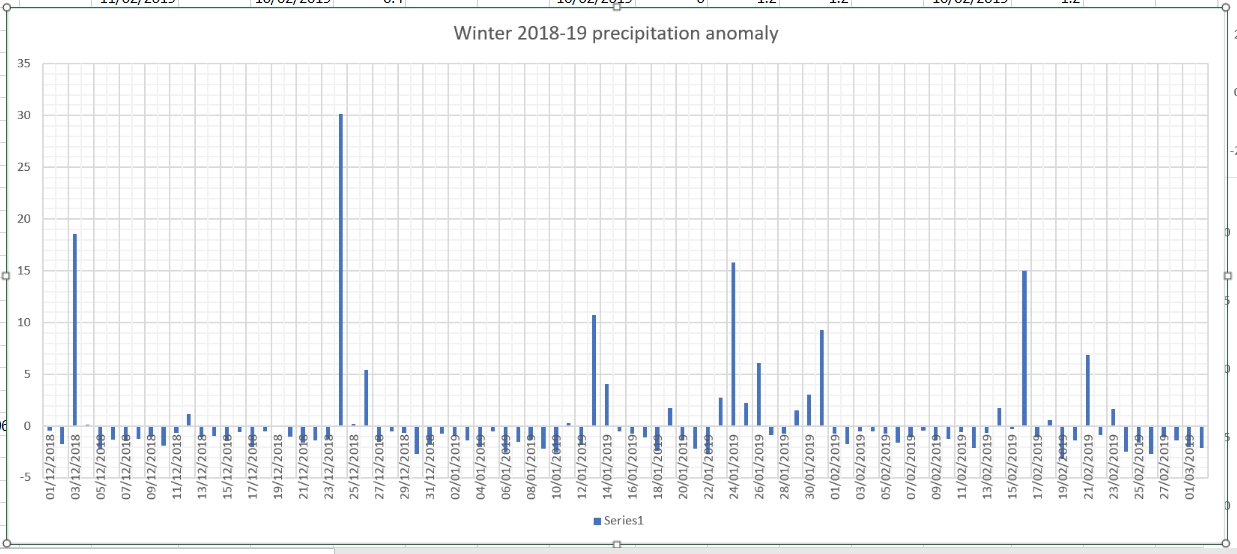
A look at the statistics reveals that the midway point of winter is the mildest for 3 years and the 6th mildest since 1960. There has also been around half the rainfall that we had to this point in 2018. Sunshine is similar and below average.

Since December 1st, Wanstead has recorded just 7 air frosts – 5 fewer than last year. The coldest night was just -2.5C. The current mean temperature this winter to January 14th is 6.9C with rainfall 60.6mm.

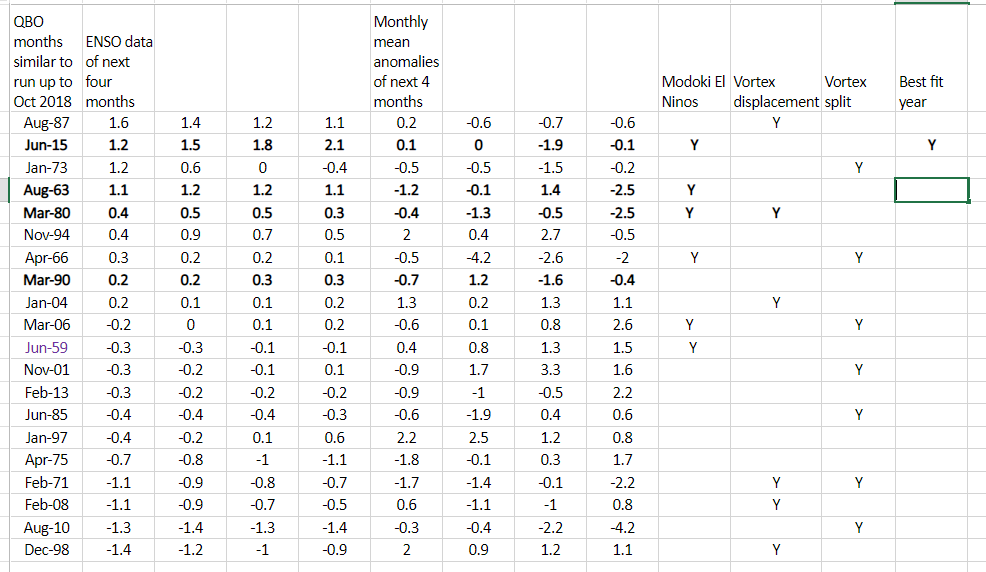
Further scrutiny of stats for the Wanstead area reveal few years were similar to this winter. Using my method for finding patterns stretching back over 50 years to forecast this winter I picked out years that were +/- 10% of the 2018/19 rainfall total. From these I then weeded out the seasons where the mean was within +/- 10% of the this year. This gave a list of three winters with similar temperature and rainfall.

50%

The other winters weren’t anything special with ‘snow lying’ days below the median for this area of six.

nevis
Snow go: just patches of snow were visible on the upper runs of Nevis Range at the weekend on Jan 12th

As I write there are signs that the weather is going to turn colder this week. Whether it will be cold enough for snow remains to be seen though the ECM model is hinting at a rise in pressure around Greenland. A situation that *could* be conducive for something colder long term.

In summary, the probability at this point of at least one fall of snow before the end of February could be put at 100 per cent. Whether it will be abundant or merely a dusting is impossible to tell.

Elsewhere in the UK it has been similarly lacking in snow. During a visit to Fort William at the weekend locals told me that there has been no significant snow since October / November and that even frosts were few and far between. The lifts around Nevis Range looked forlorn against a green backdrop. And it wasn’t until I got to the summit of Ben Nevis and Aonach Mor that I saw any of the white stuff.


A winter drought

Rain today (January 16th) is the first meaningful fall since before Christmas, putting an end to the 23-day long dry spell.

This meteorological drought, rare given that it spanned Christmas and New Year Storm singularities, these having 84 and 86 per cent probabilities respectively, was the 3rd equal longest winter drought.

The only other similar droughts in a list that dates back to 1887 were 19/12/2008 – 03/01/2009 and 17/12/1972 – 02/01/1973.

winter droughts

The last precipitation I recorded was from a weak occlusion that followed a cold front on the evening of December 23rd.

This synoptic set-up was followed by a build in air pressure that peaked on the morning of January 3rd; 1043.8mb was the highest reading in this area for at least 10 years and is the highest pressure I have measured.

A fuller version of London droughts in all seasons can be found here.

Wanstead Weather: 2018 review

This year finished as the 7th warmest on record – some 0.8C warmer than the 1981-2010 average.

Only two months of 2018 were more than 1C below – the means of April, May, June and July were at least 2C above average.

Rainfall was less remarkable with the year finishing 97 per cent of average. The total of 584.4mm puts it as the 81st driest since 1797, just over 20mm wetter than 2017.

It was a sunny year with 1,641 hours of sunshine recorded. That’s 111 per cent of average, the 23rd sunniest since 1881.

weather stats 2018


mean 2018

rain 2018

sunshine 2018

For a review of each month, click JanuaryFebruaryMarchAprilMayJuneJulyAugustSeptemberOctoberNovemberDecember

You can read the national review of weather events at the Met Office blog here.


December 2018: average and benign

December was most notable for benign weather, totally in contrast to last December which saw snowfall.

The mean temperature finished 7.3C, 1.7C above average, the mildest December for three years though still over 3C cooler than that record breaking December

Some 60.4mm of rainfall was recorded, 114 per cent of the 1981-2010 average, over 20mm less than last year.

Some 39 hours of sunshine were recorded, that’s 97 per cent of average, duller than last year.

Five air frosts were recorded though only one was colder than -1C.

To view full stats follow this link:http://1drv.ms/1kiTuzv

Summary for December 2018

Temperature (°C):
Mean (min+max)   7.3
Mean Minimum     4.4
Mean Maximum     10.1
Minimum          -2.5 day 24
Maximum          15.5 day 2
Highest Minimum  11.5 day 06
Lowest Maximum   4.1 day 14
Air frosts       5
Rainfall (mm):
Total for month  60.4
Wettest day      11.4 day 20
High rain rate   20.1 day 20
Rain days        14
Dry days         17
Wind (mph):
Highest Gust     26.6 day 21
Average Speed    3.0
Wind Run         2223.4 miles
Gale days        0
Pressure (mb):
Maximum          1036.8 day 31
Minimum          980.4 day 01
Days with snow falling         0
Days with snow lying at 0900   0
Total hours of sunshine        39.0
december 2018

November 2018: average and rather sunny

November was most notable for the amount of sunshine. Some 79 hours were recorded, that’s 135 per cent of average, the sunniest November for two years.

The mean temperature finished 8.4C, 0.4C above average, the mildest November for three years.

Some 72.5mm of rainfall was recorded, 122 per cent of the 1981-2010 average, the wettest November for two years.

To view full stats follow this link:http://1drv.ms/1kiTuzv

november 2018

London winter forecast 2018-19

Long range modelled forecasts have been all over the place of late and, looking at the underlying signals, it is easy to see why.

When I’ve produced these forecast in the past, in terms of QBO and ENSO data, there’s usually a lot of analogues to compare with. This year, however, seems to be an exception.

Considering QBO first I looked back over data to 1950 and found nothing similar for October. However, looking over the whole series the cyclical nature of this circulation may give some clue.

bestfit

Some 20 months were revealed, ranging from June 1959 to June 2015.  Using NOAA’s  Niño 3.4 region I narrowed this list down to the few that had an ENSO value of around +1 with a rising trend. With NOAA’s forecast of a Modoki El Nino (one that occurs in the central Pacific) this narrowed the list to just 1 period: June 2015. Considering maxima anomalies this would give the following winter.

winter 2018-19 max anomaly.PNG

The above would suggest there being a general cool down through December with a cold spell starting just before Christmas into the new year? And another cold spell end of January into the first week of February?

winter 2018-19 precip anomaly

The above precipitation anomaly chart would suggest a wetter than average December,  January and February, though February by much less so.

It’s been a very busy autumn so I’m keeping this short.

The below figures, particularly January and February, may be different in the event of an SSW occurring. In all then.

The mean:
December: +0.8C
January: -1.2C
February: -1.7C
Overall: -0.3C (broadly average)

Precipitation:
December: 158%
January: 155%
February: 120%
Overall: 134%


East London’s highs and lows of the last 60 years

The chart below shows every maximum and minimum temperature recorded in this area since January 1st 1959, some 21,860 days!

The extremes range from -12.7C recorded on January 31st 1972 to 37.5C on August 10th 2003.

After peaking in 2003, summer maxima seems to be in decline. Winter minima, by comparison, has been increasing since 2012

maxmin

October 2018: average and rather sunny

October was most notable for the amount of sunshine. Some 136 hours were recorded, that’s 127 per cent of average, the sunniest October for six years.

The mean temperature finished 11.6C, 0.2C below average, the same anomaly as September. And 1.6C cooler than October last year.

Some 52.1mm of rainfall was recorded, 78 per cent of the 1981-2010 average, the wettest October for four years.

To view full stats follow this link:http://1drv.ms/1kiTuzv

October 2018 max.JPG

Perfectly average months are extremely rare

Readers of this blog know that I often described a month as fairly average – a look at local statistics shows that many months come in very close to the monthly mean.

But when you combine mean temperature with rainfall that is 100 per cent average it becomes very rare and non-existent with 100 per cent sunshine hours considered.

Of the 2650 months since 1797 just one, February 1972, saw a mean temperature and rainfall precisely average. However, sunshine hours were just 40 per cent of the 1981-2010 average.

To extend the data I included monthly rainfall totals that were between 90 per cent and 110 per cent of average. Even then just five more months were revealed: September 1806, February 1876, January 1883, October 1886 and March 1972.

Although on paper February 1972 was perfectly average a look at the weather for the month reveals typically variable weather. The website London Weather explains:

The maximum temperature was only 3C on the 1st as mild Atlantic air slowly displaced the very cold continental air eastwards. There were outbreaks of rain, and during the remainder of the first week, although mild, it was often dull and wet. During the second week, active frontal systems crossed the country bringing strong winds but with sunshine between the rain bands. After mid month, east winds returned, and although not cold, it was frequently dull.

Considering the Met Office forecast the mean for this month, October 2018, is set to finish precisely average. However, rainfall looks set to finish well under the average for the time of year.

First frosts in East London since 1959

Although many parts of the UK have already recorded their first air frost this part of the capital, being so built up and close to the City, remains frost free.

Although many may think that frosts are getting later a look back through local statistics to 1959 shows these events are very random.

The scatter graph below illustrates this.

first frost in east london a

Taking out the winters of 1974/75 and 2002/03, which didn’t see frosts until February and January respectively, the scatter can be seen better here.

first frost in east london b

The median for the first frost is November 6th with an average minimum of -1.4C.

October frosts can be a precursor to a mild winter much in the same way that heavy October snowfall in the Alps has lead to an awful season. But there are exceptions, as happened in 2008/09.

* To record an air frost the temperature must fall to -0.1C or lower.