
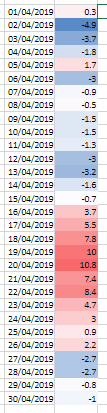
June 2019 saw no high temperature records broken but a jump in anomaly, produced on the 29th by the 3rd hottest June day back to 1959, is higher than any I can find back to that year..
The only phenomena similar that I can find, albeit in the other direction, is the Beast from the East in March 2018 that sent temperatures plummeting.
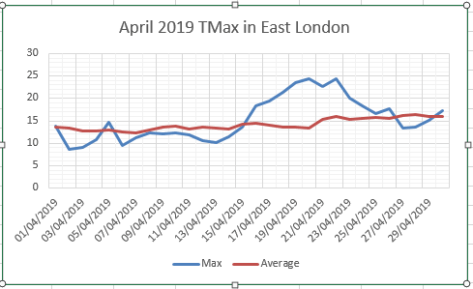
The month finished a little above average though the final figure, like May and April, masked cool warm spells.
The mean temperature finished 16.9C that’s 0.8C above average, the coolest for 3 years.
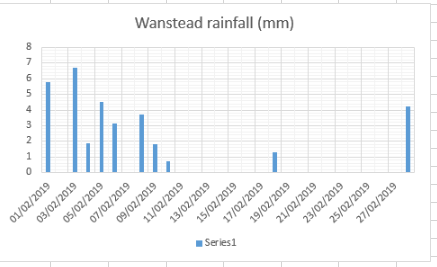
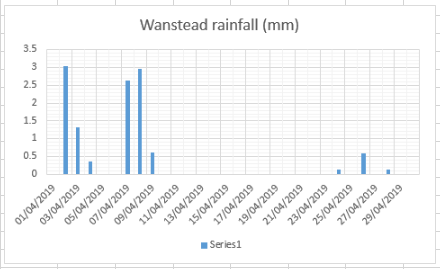
Rainfall was 63mm, 123% of average, the wettest for 2 years. Sunshine was 158 hours, 88.7% of average, and dullest for 3 years.
A timelapse of the longest day can be found here.
To view full stats follow this link:http://1drv.ms/1kiTuzv


The 12 month rolling rainfall total, thanks to a wetter than average month, has moved above 500mm again.
Summary for June 2019


You must be logged in to post a comment.