Damage from Storm Ciara was a lot less notable than further north though the relentless wind saw three records broken locally. Though the gusts were nothing like the St Jude storm in October 2013 the sustained wind blew at its greatest 1, 2 and 3-day rate since this particular automatic station was reset in November 2012.
Over the 3 days the wind direction was locked in a south-westerly, from 199 to 203 degrees.
In my search for some winter weather a tweet by Amy H Butler about dynamic final warmings piqued my interest.
According to the atmospheric scientist a winter where there was no major disruptions of the polar vortex (SSW) we are more likely to see a dynamic early final warming. A table published by Wiley shows the final warming dates.
* means there was a SSW, bold means late FW (after the mean date of April 15).
So what could this mean for the weather in the London area? Considering all the above years with no SSW gives an average date of April 19th for a dynamic final warming.
I then looked at the TMax anomaly for those years for 60 days following a DFW and came up with the following graph.
The results suggest temperatures in April will be heading down in the final week for a cold end. The average to cool theme continues into May before temperatures lift in the final week for a warm end, with anomalies up to 5C above average. June, however, looks shocking with temperatures nearly 6C below average by the 16th.
This winter has so far been very similar in type to 1990. The dynamic final warming that year was among the latest in the list and led to a cool and dull June with anomalies in the second week nearly 7C below average!
The December monthly mean finished 6.3C, that’s 0.7C above average, making it the ninth month of 2019 where the monthly mean temperature finished above average.
The wet theme of October and November carried on into December; the 111.1mm collected was 209 per cent of the 1981-2010 average, the wettest since 2002.
Some 51hrs of sunshine were recorded, 126 per cent of average, the sunniest for three years.
The November monthly mean finished 6.4C, that’s 1.6C below average, the coldest November since 2010. It was the third month of 2019 where the monthly mean temperature finished below average.
The wet theme of October carried on into November; the 68.5mm collected was 116 per cent of the 1981-2010 average, slightly drier than last years.
Some 59.7hrs of sunshine were recorded, 102 per cent of average, the dullest for four years.
There were six air frosts.
You can find my thoughts on how winter is going to pan out here.
For this year’s winter forecast, because of time constraints, I am sticking purely to what the local analogues reveal.
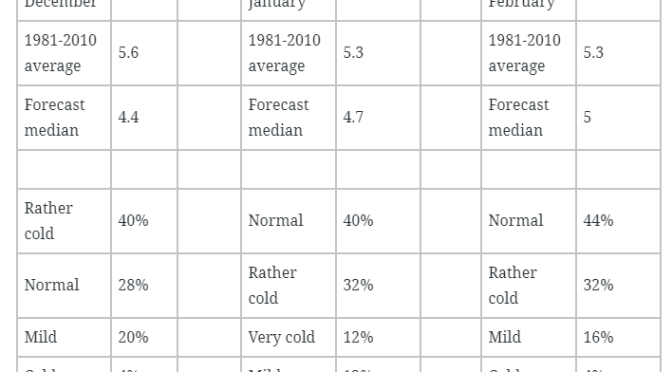
Meteorological autumn was the wettest for 18 years and the coolest for 6 years, revealing some interesting similarities with past climate. Considering data back to 1797 I was able to make the following suggestions on how the next 90 days may unfold.
December is most likely to be on the cold side with rainfall slightly below average.
January is most likely to finish average temperature-wise and wetter than December.
London’s February extremes temperature also look average overall and the precipitation signal also creeps up in comparison to the first two winter months.
Best chance for snow? Impossible to pin down but the coldest weather is likely to be at the beginning of February, the third week of January and just after Christmas.
The warmest period looks to be around January 10th while there’s also a signal for that often phenomena of milder temperatures just before Christmas day.
Most of the probabilities in the above statements are relatively low and are explained in the table below.
It’s been a while since this region has seen a sustained colder than average period. Though the past few weeks have seen colder than normal weather we have to go back to the beginning of 2015 where at least three consecutive months were colder than the 1981-2010 average.
The spell, which coincided with winter, was unremarkable with just one day of lying snow. The season finished 55th out of 73 of the most recent winters, the anomaly for the 90-day period was -0.3C. For deep, lasting snowfall events a monthly mean temperature must be at least 2C colder than average.
For anything ‘snow-worthy’ you have to go back seven years to a 10-month long colder than average spell that began in September 2012 and coincided with probably the last winter I can remember that had more than one cold spell with snow that lasted longer than a few days. The average mean for this spell was -1.3C.
The most potent cold period occurred during the winter of 1984/85, a winter where snow lay nearly a foot deep by the end of January and where seven ice days were recorded – these days we’re lucky to record just one ice day per winter! Only just behind was the 3-month period January to March 1987.
As with previous blogs I have devised a way of ranking these cold periods, by dividing the mean with the length in months. The first nine months of 1986 achieved the highest ranking, a period that included the 5th coldest February in this area since 1797.
And in chronological order…
It is looking like the mean this November will finish below average, making it the second month in a row, something that hasn’t happened since March last year. Will December make it three in a row and a new addition to the list?
The wet theme of the final week of September carried on into October; the 100.3mm collected was 150 per cent of the 1981-2010 average, the wettest 10th month for 15 years.
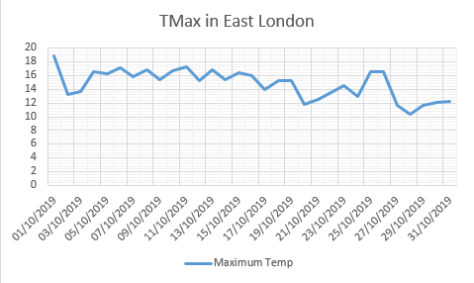
The monthly mean finished 11C, that’s 0.8C below average, the coldest October since 2012. It is only the second month of 2019 where the monthly mean temperature finishes below average.
Only 72hrs of sunshine were recorded, 68 per cent of average, the dullest October since 2002.
The area’s first frost arrived 10 days before the median date back to 1959. And 3 days earlier than last year. A shower with >5mm hail was observed on the 9th.
Two hundred years ago this October the extremely rare phenomenon of lying snow in October was recorded in London.
A likely plunge of Arctic air on the 21st saw rain turn to snow which lay nearly 8cm deep by the morning and remained for nearly a week.
The month started dry and warm. On the 1st Luke Howard recorded 75°F at his laboratory in Stratford. The warmth remained into the second week with 77°F recorded on the 10th, 11th and 12th.
The values from Luke Howard’s Climate of London.
The wind swung into the north on the 18th and with it arrived the first hoar frosts that were cold enough to kill garden plants.
On the 21st the cold air further dug in and with it rain that turned to sleet. Howard said: “It began to snow about noon falling in very large flakes thick and rapidly for an hour and covering the ground. Some rain followed.
“In the evening the wind rose and it blew hard in the night from NNW. At midnight came a second heavy fall of snow which continued till 6am and though at first much of it melted it lay in the morning a full three inches deep.”
Howard adds that the surroundings ‘took on appearance of mid winter with the single exception of the foliage still remaining on the trees which mingled with an enormous burden of snow presented a very singular and grotesque appearance’.
The weight of the snow was also enough to break off large limbs from fruit trees.
The snow was still lying on the 23rd and, probably caught out by the earliness of the polar plunge, swallows were seen at Stamford Hill. On the 24th a very white frost was observed with a low of 31°F recorded at Tottenham.
The event was covered in the national press. The Imperial Weekly Gazette mentions impassable roads in to London, including at Walthamstow.
More wintry weather followed in November, December and January.
Could snow fall here again in October? The probability is very low but it is not impossible, given the right synoptic conditions. Recent cases of notably positive and negative anomalies following in quick succession somewhat mirror the weather of Howard’s day.
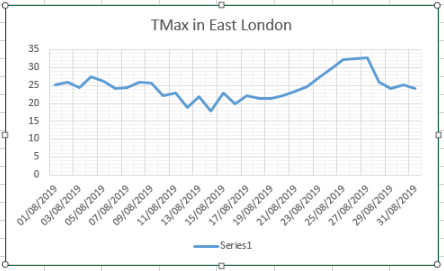
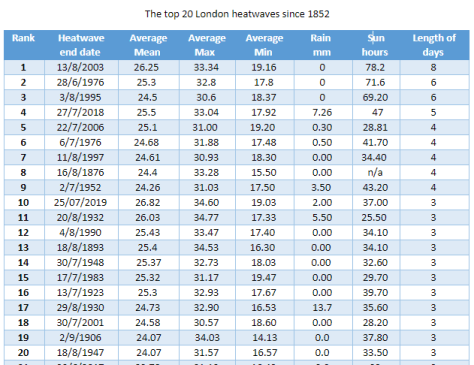
Last month’s heatwave was the hottest three-day event recorded in this area since 1850. It bettered a similar event in 1932 by 0.8C to take 10th in my all-time list of heatwaves.









You must be logged in to post a comment.