
This month marks the 30th anniversary of the Great Storm. Some 18 people were killed as winds gusting to nearly 100mph affected London and the South East. Around 15 million trees were lost with Sevenoaks in Kent losing six of its seven historic trees.
The rapid development of ‘Low M’ took forecasters by surprise, the favoured outcome was for the low to move up through Brittany, remaining in or to the south of the English Channel.
I was living in a fairly sheltered corner of the London borough of Havering in 1987. I remember heavy rain just before midnight, around three hours before the storm reached its height, was heavy enough to send water trickling into my room, thanks to an overflowing roof valley. I thought it strange that Michael Fish hadn’t mentioned its severity in his lunchtime forecast.
I was awoken around 3.30am by a loud crash. Looking out the window I saw two dustbins flying down the road. You could sense each gust building in strength – the next dislodged a roof tile, sending it crashing on to the family car. By this point my mum and sister had awoken, my sister swearing she could feel the whole house moving: Mum ordered us downstairs. By this point the power had gone off and we sat listening to a small battery-operated transistor radio. We listened to updates from BBC Radio London where, like most other people, nobody knew what the hell was going on. The storm continued and first light gradually revealed the damage in the garden – a couple of trees over and next-door’s shed on its side; nothing compared to the rest of the region. But the disruption meant I didn’t attend school that day.
The storm was obviously a weather nut’s dream, and following so close on the heels of the coldest January I can remember. John Hall, of Surrey, can remember the storm well: “I’m not normally a very heavy sleeper, but I somehow managed to sleep through the worst of it (in Cranleigh, then as now).
“It was still windy when I woke around 7 am, but presumably not nearly as much as it had been earlier. By some miracle we still had mains power, and it was only when I switched on the radio and there was no sign of Radio 4 that I realised that something was up. (I assume the transmitter must have been damaged.) I walked the half-mile to the centre of the village to get my morning paper and then to catch the bus to Guildford station for my journey to work.
“It was only then that I learnt from the newsagent that there were no papers and wouldn’t be any buses, as every road in and out of the village was blocked by fallen trees. So I went home, switched on the TV and learnt all about what had happened.”
Dave Cornwell, of Laindon, south Essex, said: “Quite exciting but scary for me at home in Laindon. I awoke probably around 3.00 am to the sound of a metal dustbin lid (remember those?) flying down the street.
“Things sounded pretty bad and my sixth sense told me this was no ordinary windy night. I got up and looked outside and there was stuff flying by and lots of strange noises. One was my plastic gutter blown down and banging against the side of the house. I can’t be certain of the timings but we awakened our two young daughters and took them downstairs as I was worried as they slept in a room with a flat roof dormer window and there was a tall brick chimney stack directly above it. I heard more crashing sounds which unfortunately turned out to be a couple of roof tiles landing on my car roof which was parked in the drive. Of course with no internet then I did what a lot of people did and tuned into the police FM radio network. This gave me a better realisation that it was serious as they were describing the carnage on the roads and all of the emergency calls they and the fire brigade were getting.
“At about 5.30am I ventured out into my driveway to see if there was any serious damage but the storm was still raging and I can honestly say I couldn’t stand up and was unable to keep my balance so went back indoors. I think the wind speed was probably over 100mph at this point being funneled down the side of the house which runs south-north.
“By 8.00 o’clock I was getting ready for work and although by then people were being advised to stay at home I worked in a fairly essential service so thought I would give it a try. I managed to get to East London but there was debris everywhere and I saw a car completely crushed by a one of many trees that were blocking some side roads.
“Another thing I noticed that evening was my south facing windows had a layer of salt on them which must have been blown in from the south coast 60 miles away. It was a sight I’ll never forget and to this day I don’t like strong winds (had a scary flight at Heathrow in a severe gale as well) and always get a nervous feeling if I hear the wind getting up. Probably the most dangerous weather I have experienced anywhere in my lifetime.”
Much has been written about the storm, a ‘once in 500 year event’, including this summary by the Met Office. There is also an excellent paper by Bob Prichard published in Weather. The synoptic charts below show how Low M develops from 1200 on the 15th to 1800 on the 16th.


Because of widespread power cuts many television viewers didn’t see this recording of ITV’s Good Morning Britain at the time of transmission. A round up of the immediate aftermath of the storm, including comments from Jack Scott, can be seen in this edition of Thames News.
The following Daily Weather Report was published by the London Weather Centre:
An intense, and almost certainly exceptional, depression crossed the coast of south Devon soon after midnight, moving quickly, and deepening rapidly, with a track across the Midlands and out towards the Humber Estuary, leaving the United Kingdom land area around 0700 hours.
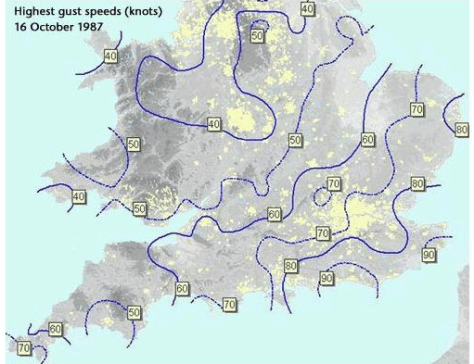
Some very severe conditions due to storm force winds were generated around the southern and eastern flank of the low, with gusts from approximately 0200 hours well in excess of 70 knots, and reaching a peak in the period 0300 hours to 0700 hours, with gusts to 90 knots reported from Herstmonceux and St Catherine’s Point in the early hours, and similar value gusts from the Channel Islands. The very stormy conditions were accompanied by some heavy rain, this rain pushing into Scotland and parts of Northern Ireland after dawn.
Clearer weather, on westerly winds, swept across southern Britain, pushing the worst of the stormy winds away into the North Sea. During the afternoon the country settled down to a blustery westerly with some heavy and thundery showers developing in clusters, running especially into western and southern coastal regions and parts of southeast England.
Across Scotland and northern England the skies remained cloudy, with outbreaks of mostly light rain, but troughs enhanced the showers in the northwest later in the evening with heavy rain. It was a rather cold day in most places, although the temperatures were near normal in the southeast.
The storm remains the most severe I have experienced in this part of the UK. The Burns’ Day storm in 1990 brought severe gale force winds in the London area but the low pressure was centred much further north.

The most recent severe windstorm in the London area, the St Jude Day storm of 2013, brought strong winds but nothing on a par with 1987.


The anniversary of the storm, complete with a question and answer session attended by Michael Fish, will be marked at the Royal Met Society’s WeatherLive event in November.


You must be logged in to post a comment.