A blog that tries to make sense of how the UK's national climate translates into local weather for Wanstead and the surrounding regions of east London and west Essex.
Check out my twitter feed @wanstead_meteo for local weather forecasts, stats, records and phenomena for the east London areas of Wanstead, Aldersbrook, Leytonstone and Stratford. And anything else weather
At the beginning of December the opening par for my forecast for winter read:
The mean temperature for winter 2017/18 is looking average overall with average precipitation. While that doesn’t sound exciting for anyone looking for colder weather and snow I think the figures mask frequent 3 or 4 day-long cold snaps from the Arctic interspersed with milder interludes from Atlantic incursions; typical characteristics of a pattern driven by the troposphere. For anything longer term we have to hope for a warming of the stratosphere, a sudden stratospheric warming over the Arctic, that downwells into the troposphere, reversing the general westerly circulation. We are overdue an ‘SSW’ event but, even if one were to happen, its effects wouldn’t be felt until much later in the winter.
Figures generated using QBO statistics in the run up to December were identical to the outcome of 5C. It is figures generated using ENSO statistics, however, that produced the best results considering December, January and February alone.
It would seem that the winter was most influenced by the ENSO variable up until February when the effects of the SSW were enough to overcome it?
A few years ago I devised a winter index to try to decipher how modern winters ranked against legendary seasons, such as 1947 and 1963.
With the media hyping conditions last week, which were severe in many parts of the country, it is very difficult for many to gauge just how conditions compare with previous winters.
My findings show that this winter so far stands 27th. It is possible that further snowfall that results in lying snow at 9am between now and April will boost the position higher though, given recent years, this would seem unlikely.
Last week’s cold spell, while containing some impressive statistics, is put into perspective when it is compared with other severe spells since 1960. A decent cold spell but no record breaker in the form of a 1962/63.
Perhaps it is the advent of social media, the plethora of constant updates of the latest feet-deep snowdrifts and instant tales of heroism in the face of icy adversity, that has made this cold spell seem far more severe than it actually was in the minds of many; February / March 2018 was the first truly social media-driven cold spell.
The winter of 2017/18 will probably be remembered as much colder that it actually was – the exceptionally severe spell right at the end was only at its halfway point by the time the meteorological winter was over.
Like a scene from the Pathfinder movie
The mean temperature for the season finished 5C, that’s 0.5C below average and the coldest for five years.
Rainfall was above average: 180.8mm fell, that’s 124 per cent of average and the wettest for four years.
Sunshine was just over average: 174.4 hrs is 104 per cent over average and the sunniest for tree years.
As so often with winters at this latitude the average for three months makes it look a non-descript season – it is only when you look at the detail that compelling facts emerge.
The coldest day of the season occurred on the last day of February when the maximum failed to rise above -1C, the first ‘ice day’ for five years and the coldest day since 2010. It was also the seventh equal coldest February day in a local record going back to 1959.
Perch pond, being deeper, took longer to ice over
The coldest night of the winter was in the early hours of the 28th when a low of -6.9C was recorded. The temperature would have been far lower were it not for a shower that moved in at 3am.
The warmest day of the winter occurred on December 30th with 14.2C recorded. The warmest night was on January 28th when the temperature fell to just 10.8C.
The wettest day of the winter occurred on January 2nd when 15.3mm was recorded.
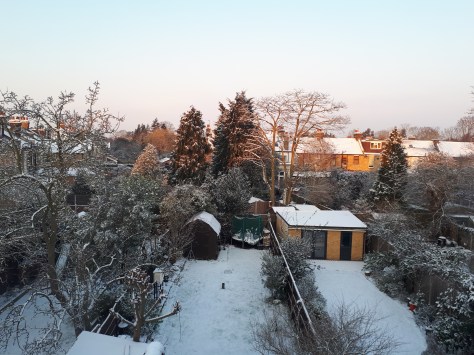
Snow arrived at the start of winter and at the very end: seven days of snow falling and four days of snow lying over the three months is below average.
This slideshow requires JavaScript.
The daily mean temp yo-yo’d throughout December, January and February
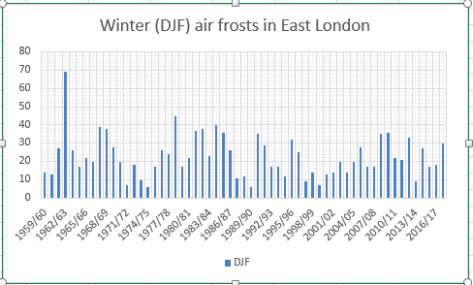
There were 30 air frosts during the three months, eight above the 1981-2010 average.
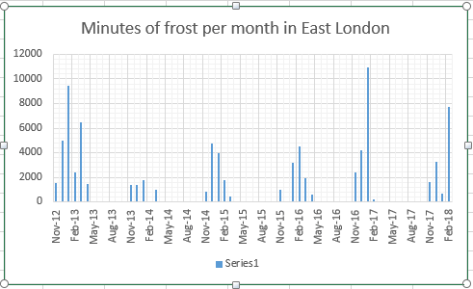
There were 11,680 minutes of frost over the winter, less than last year, though 66 per cent of those were recorded in February. Considering the past 6 Februaries this year’s frost hours were 170 per cent greater than the next highest, February 2016!.
Temperature (°C):
Mean (1 minute) 5.2
Mean (min+max) 5.0
Mean Minimum 2.0
Mean Maximum 8.0
Minimum -6.9 on 27/02/2018
Maximum 14.2 on 30/12/2017
Highest Minimum 10.8 on 28/01/2018
Lowest Maximum -1.0 on 28/02/2018
Air frosts 30
Rainfall (mm):
Total for period 182.2
Wettest day 15.3 on 02/01/2018
High rain rate 28.2 day 02/01/2018
Rain days 52
Dry days 38
Wind (mph):
Highest Gust 45.0 on 02/01/2018
Average Speed 3.7
Wind Run 8059.5 miles
Gale days 0
Pressure (mb):
Maximum 1036.4 on 22/12/2017
Minimum 970.3 on 10/12/2017
Days with snow falling 7
Days with snow lying at 0900 4
February 2018 saw the start of the first decent cold spell since 2013 with thick (by modern standards) snow cover, deep cold air and bitter winds.
February 2018 is marked by the steady downhill temperature trend from the 18th.
It was the coldest February since 1991, the mean temperature of 2.8C was just over 2.5C below average. The month was ‘cold’ though it was the 19th onwards that really dragged the value down.
Precipitation was just below average; just over 34mm is 87% of average.
It was a sunny month, the sunniest February since 2012 and the 12 sunniest in a local record going back to 1881. Some 87.9 hours were recorded, 120% of average. Of that top 12, eight have occurred since 1988! A mix of changes in weather patterns, industry and council action?
Air frosts: 16. Ground frosts: 19. Snow falling: 6 days. Snow lying: 3 days (greatest depth 8cm 28th)
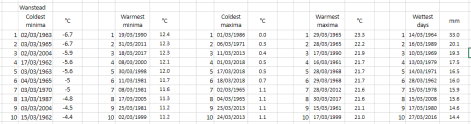
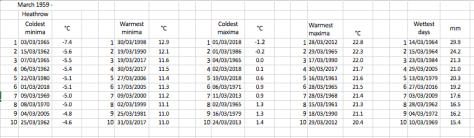
I’ve put together a few top 10s of stats for Wanstead, St James’s Park and Heathrow for the month of March.
The month, the first of the meteorological spring can offer really contrasting weather; perishing cold and very pleasant warmth are both very possible, as the values show.
Probably most notable in the list is the cold March of 1962 which was the coldest of the 20th century and 11th coldest in a local list going back to 1797. March 2013 was also very cold. Strong winds from deep depressions often feature as does the odd blizzard.
Marches in the 1960s also appear to often start very cold and end very warm; the term ‘In like a lion, out like a lamb’ being very appropriate.
•Though this blog only covers extremes back to 1959, thanks to Met Office digitised data, I’ve unearthed records prior to this. Both W.A.L Marshall’s A Century of London Weather (covering 1841 to 1941) and J. H. Brazell’s London Weather (covering 1841 to 1964) confirm the coldest March day as the 13th in 1845 when 25F (-3.9C) was recorded at Greenwich.
The coldest March minimum was 4/5 in 1909 with 9F (-12.8C) at Epsom. Greenwich and Hampstead recorded 14F (-10C)
This week has the potential to see new temperature records set or matched as very cold air moves in off the continent.
Whilst amounts and location of snow are very difficult to estimate at more than 24hrs to 48hrs away there is no doubt that the incoming air is very cold indeed.
In the early hours of Wednesday one weather model is showing extremely cold air (496-504 DAM ie very low thickness) just off the coast of Scotland. In the last 60 years there have been only three occasions where air approaching this thickness (500 DAM and lower) has been recorded in the UK:
February 1st 1956: Hemsby, Norfolk
February 7th 1969 at Stornoway, Outer Hebrides January 12th 1987 at Hemsby.
Radiosonde (weather balloon) ascents will make very interesting reading this week
With the deep cold air in place the potential for snowfall comes once the air starts to become unstable. East London, and much of the east coast, best falls come where convergence lines ‘streamers’ form.
One example of a streamer is forecast to occur on Tuesday
If persistent, these ‘Christmas tree’ features are capable of producing snowfall accumulating at the rate of 5–7cm per hour in especially cold
outbreaks, albeit often very locally. The steep thermal contrast between the very cold air and the current warm anomaly in the North Sea could make any snowfall very heavy indeed.
Streamers during the cold spell of January 1987 saw 30cm fall widely with some up to 65cm in Kent and 45cm in south Essex. Parts of Cornwall saw up to 40cm.
During a cold spell in February 2009 thundersnow was recorded – the favoured spot this time being parts of Surrey which saw 30cm.
Personally the most snow I have recorded during a cold spell was in February 1991. A very deep cold pool, not unlike what is forecast this week, covered much of the south. in air approaching 500 DAM. Days and days of snow followed dumping knee-deep powder in my local park in suburban East London. Reported depths included 20cm at St James’ Park in the centre of London, and 38cm at Rettendon, Essex.
There is a very good paper on cold pools and snowfall here.
‘This cold spell is rubbish compared to what we used to get!’
Every winter when weather model hype builds expectation for many, often days in advance, the outcome never seems to quite match the hype.
This expectation among weather nerds is inflated even further when the tabloids cotton on and build anticipation further only for it all to end in a ‘damp squib’.
I’ve lost count of the number of times when excited enthusiasts proclaim that an incoming cold spell is going to last at least three weeks; the reality being that the intensity of the cold has gone after four or five days. Cold spells since 2008 often arrive as a ‘blob of cold air’ from the continent that eventually gets ‘warmed out’; it’s been a very long time since we had a cold spell that’s been fuelled by a continual feed of air off the continent.
In 2018 the really cold air aloft had warmed after 5 days
To illustrate my point I had a look back at every cold spell in this area of suburban east London since 1960. I weeded out the feeble efforts of the last few years by only considering spells where the maximum didn’t exceed 2.8C. The results spanned from the most recent very localised cold spell of December 2022 to the mammoth 31-day Siberian blast that began on Boxing Day 1962.
In another blog I remarked how similar the 2018 pattern was to February 1962. This cold spell began on the 26th and lasted 9 days. Some 7cm of snow fell, this drifting in the wind, possibly making it seem worse with only 4 hours of sunshine which would have maintained any snow cover.
One of the snowiest cold spells happened in February 2009, eight days after an SSW event that lead to a polar vortex split. This four day spell saw a total of 26cm of snow fall.
The last week or so has been agony for model watching coldies wishing for a snowy end to winter.
The Synoptic chart for February 27th which saw 4 inches of snow in Stratford, east London
Solutions have often flip-flopped between a mild and cold outlook. Even this morning at 6 days out the GFS and ECM model temperature outcomes differed by some 20C, a choice between spring and deepest winter!
Sometimes you have to try and second guess what is going to happen by looking at previous patterns from years past.
Yesterday at Philip Eden‘s funeral I spoke to Woodford Green resident Ron Button. He pointed out how much this February reminded him of February 1962, a month that was non-descript for the first three weeks before turning very cold and snowy. Ron, who has kept a meticulous record of the weather ever since his interest was prompted by the severe winter of 1947, produced diaries of 1962 when he was living in Stratford. The entry for 26th / 27th read: “4 inches of snow with drifting”!
The March that followed was the coldest of the 20th century, ranking 10th in my list back to 1797, and 0.3C colder than March 2013. The fact that the monthly sunshine in 1962 was only slightly below average is testament to how cold the source of the air must have been. March 2013 was very dull by comparison!
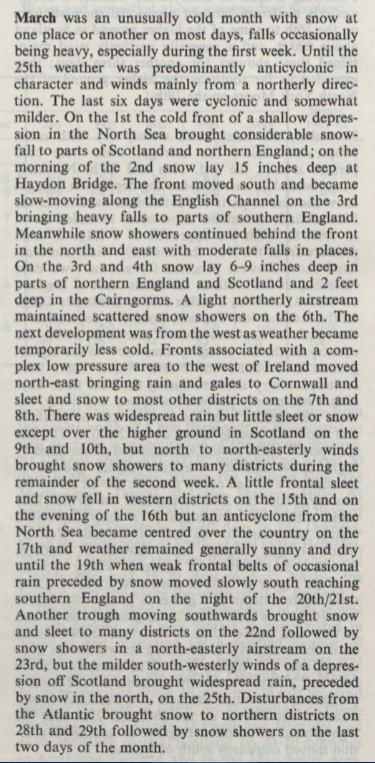
An entry in London-weather.eu reads that March was colder than any of the previous 3 winter months: “The first three weeks were mostly mild and dry. It was often breezy which resulted in fewer than average night frosts. Frontal systems off the Atlantic passed through the London area, most of them weak though on the 12th, nearly 8mm of rain fell with southwesterly winds gusting to 57 knots. During the last week of the month, it became much colder, and on the 26th snow fell with the temperature not rising above -0.3C all day.”
The winter of 1961/62 ranks only 14th in my list of worst winters, mostly because the core of the cold happened in March which is considered spring in meteorological circles
The Snow Survey of Great Britain also makes interesting reading with these entries for February and March.
Wanstead has a new automatic weather station to complement the one set up in November 2012.
The new AWS, situated in the grounds of Wanstead Golf Club, comes thanks to Friends of Wanstead Parklands. Data from the unit, which is sited very close to where Wanstead House once stood, will be used to help monitor the levels of the park’s lakes.
The sensor unit, 750m NNE of the weather station wansteadweather.co.uk on the Aldersbrook estate, is much better exposed and will hopefully offer more accurate wind and sunshine readings. It will also provide a chance to further investigate the area’s microclimate.
The station has already shown that the golf course is warmer on a radiative cooling night than the Aldersbrook Estate.
There’s been much anticipation regarding the forthcoming sudden stratospheric warming (SSW) event with many hoping that a resultant split vortex will result in unseasonably cold weather in the UK and… copious snow in the low-lying south-east.
An SSW event, which reverses winds high up in the atmosphere from a westerly to easterly, can downwell into the troposphere, bringing weather from a (usually) cold continent instead of the warm Atlantic.
While a split PV event is usually more conducive for cold weather in the UK, as opposed to a ‘displaced vortex’, which usually favours only the eastern US, it is by no means a guarantee of a cold pattern subsequently evolving.
Using results published in the paper Tropospheric Precursors and Stratospheric Warmings (Judah Cohen and Justin Jones), along with meteorological data for east London, I set out to find what influence past warmings had on the weather in the capital.
Looking 45 days either side of the central date for vortex splits gave the following, chaotic graph.
But every year is different. And there appears to be more likelihood of an SSW making a difference, in terms of prompting a colder pattern, the earlier in the winter it occurs.
The SSW in 1985 was followed by a 45-day mean temperature anomaly of -3.8C! If you look at a shorter timescale, 15 days after a split PV and the anomaly is -10C on January 16th: -4.9C is the second coldest January day in Wanstead of the past 60 years.
At the other end of the scale the SSW event on March 23rd 1965 was followed by a POSITIVE anomaly of 3.4C. Perhaps solar influence this late in the year can override any SSW? Elsewhere, however, according to the website london-weather.eu: “3rd March – A combination of deep snow cover and clear skies allowed minimum temperatures to fall below -21C in northern Scotland.”
During another SSW in 2001 results in London were fairly unremarkable though heavy snow fell in Ireland.
This graph shows a general downward trend in the 15 days following an SSW event
The other result to consider is the influence from ENSO. It seems that when La Nina is ‘too negative’ this can ‘overcook’ proceedings and actually leave our part of the UK with a positive anomaly, as this table shows. It should be noted, however, that thicker Arctic ice in the 1960s would also possibly have had more influence than now.
There hasn’t been a full SSW event for years. The impact this one will have on our weather in London, a tiny part of the globe, is impossible to quantify. Though the latest model output is encouraging for anyone looking for a chilly end to winter.


 Using results published in the paper


 The other result to consider is the influence from ENSO. It seems that when La Nina is ‘too negative’ this can ‘overcook’ proceedings and actually leave our part of the UK with a positive anomaly, as this table shows. It should be noted, however, that thicker Arctic ice in the 1960s would also possibly have had more influence than now.


You must be logged in to post a comment.