Murphy’s winter and weather prophets

It is 180 years ago this month that Patrick Murphy shot to fame after successfully predicting one of the coldest Januaries on record.

murphy
anon, “The Modern Phenomenon of a Murphy the Gullcatcher of 1838” London Saturday Journal

The month, which had started mild, completely changed during the weekend of the 8th as a SE’ly wind set in. Hard frosts and snow became a daily feature with considerable falls across Scotland, disrupting mail and causing hardship for people and livestock.

By the 20th some of the lowest temperatures of the 19th century were recorded in London. At Greenwich -16C (-11C at midday) was reported at sunrise, while Blackheath saw -20C and Beckenham -26C. By the 27th the Thames at Greenwich was completely covered with ice at high water and elsewhere in the estuary ice floes were reported.

In some parts of northern Scotland, snow was noted to fall on most days between January 8th and May 3rd. Snow was also noted in upland areas of NE Scotland in June.

‘Murphy’s Winter’ as it became known made the astrologer from Cork a small fortune from the sale of an almanac, the contents of which also successfully listed the actual date when the frost would be at its most severe.

It was possibly the first long-range weather prediction that people through the ages seem to love, whether they are right or wrong.

Many characters have emerged over the years. Yorkshire’s Bill Foggitt, who used natural signals and animal behaviour during the previous autumn, was popular in the 1980s especially when he made a prediction of a harsh winter.

Others, including the Daily Express, who probably shouldn’t be mentioned in the same breath as Foggitt, are more about the clicks they hope to generate for their publishers than any earnest attempt at being right.

  • The mean temperature locally in January 1838 was -1.5C, the second coldest January in a series going back to 1797, and as cold as January 1963.
  • mean


The cold spell of January 1826

This weekend marks the start of a cold spell that brought widespread wintry conditions across Britain.

Entries in Luke Howard’s Climate of London detail several instances of the wintry weather reported nationwideScreen Shot 2018-01-06 at 01.41.17.

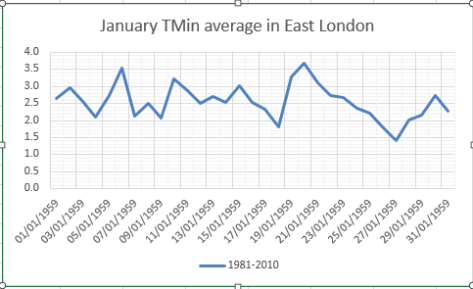
In London the freeze lasted 10 days, briefly losing its grip on the 19th, before returning in the final week. At its lowest on the night of the 14th the temperature fell to 10F (-12C). Despite the intense cold their was little precipitation in this area. However, across the country came reports of deep snow and hardship for shipping.

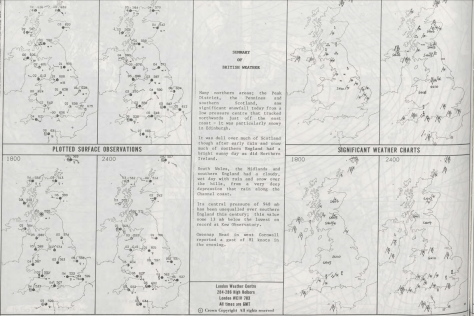
Gale force easterly winds were reported in Plymouth, Falmouth, Liverpool and Portsmouth on January 7th and 8th. On January 9th a ‘hard ENE’ly gale’ was reported at Deal, Kent.

A report reads: “It has continued blowing strong from the eastward all this day. On Thursday morning between one and two o’clock as a person was passing through Paternoster Row he observed the watchman on that beat in a state of complete paralysis and insensibility occasioned by the frost.

“He had him immediately removed to the watch house of Farringdon, within where he had not long arrived when a fellow sufferer was brought in by two of the patrol who found him in his box in Stationers Court, Ludgate Hill, absolutely frozen and unable to articulate a syllable.

“Both were immediately placed near the fire the influence of which combined with the administration of warm cordials shortly restored their suspended faculties. The thermometer at the Royal Exchange yesterday at 12 o’clock stood at 28F.”

An entry on January 14th, nearly a week into the freeze, reported a Thames “choked up with ice”.

“The river is so completely choked up with ice that the fishing boats with fish dare not come higher up than Limehouse. Putney Bridge arches are choked up with ice formed by the ebbing and flowing of the tide to a great height. At one o’clock yesterday afternoon (16th) the fog in the city was as dense as we ever recollect to have known it.

“Lamps and candles were lighted in all the shops and offices and the carriages in the streets dared not exceed a foot pace. At the same time five miles from town the atmosphere was clear and unclouded with a brilliant sun.

“Fahrenheit’s thermometer stood at 14F at 8 o’clock in the morning.

Around Britain

Newcastle: on Sunday morning last a severe frost set in here and has continued since. A considerable quantity of snow has fallen during the week.

Sunderland: the river Wear has been frozen over for the last four days down to Hilton Ferry within four miles of this town. The navigation above that place is entirely suspended.

Carlisle: a smart frost set in here on Monday morning and has continued gradually increasing up to this day Friday in severity. The river Eden is more than half frozen over near the bridge and many persons are diverting themselves on its surface. On Tuesday we had a partial fall of snow which still continues.

Westmorland: on Stainmore the weather has been more severe during the last week than it has been known for four years past. The frost is not only more than usually intense but the snow lies in fearful drifts and the wind on Friday and Saturday blew a perfect hurricane rendering it extremely difficult if not dangerous to travel.

Chester: the frost during the last week has been intensely severe and the wind is gentle and blowing almost constantly from the eastward. The thermometer on Saturday morning stood at 17F or 15F below the freezing point.

Manchester: on Friday last the temperature in the city was as low as 16F and this in the very centre of the town where the crowded buildings and immense fires kept in the manufactories must have had some effect on the atmosphere. On the 18th of January 1814 the extreme temperature was 22 below the freezing point. On the 21st of February 1810 it was the same.

Liverpool: the weather during the last week has been intensely cold, the thermometer for the last few days having been lower than during the past five years. A self registering thermometer denoted the extreme of cold on Saturday night to have been 19F and yesterday, Sunday morning at half past seven, it stood at 20F. It is very probable the present weather may continue several days as it commenced with the new moon.

Bridgewater: our river is so completely frozen over as to impede the navigation fortunately there is a good supply of coals in the town.

Canterbury: On January 17th the river Medway is frozen over and the navigation is stopped. The merchants have advanced the price of coals six shillings a chaldron.

The Royal Military Canal being now completely frozen over numerous parties are daily skating thereon. It is not unusual to take a breakfast at Hythe, a luncheon at Rye (about 20 miles glide) and return to Hythe to dinner.

On the continent

Elsineur:  the sound is full of ice and the navigation suspended. (January 14th ).

Hamburg: the frost is very intense and every appearance of its continuance. Extract from a private letter dated ‘Cadiz Jan 24’: ‘We have had terrible gales at this place so violent that upwards of two hundred and fifty vessels were driven on shore.

Rotterdam: We have had frost again from the 25th but very moderate and the ice has but little increased. The wind prevails from the eastward and there is no appearance of a thaw.

Antwerp: the river continues full of drift ice. An easterly wind took place on the 25th January. The ice decreases very fast (31st) and if the thaw continues for which there is every appearance the river will be navigable in two days.

The mean temperature for the month finished 0.7C, the 14th coldest January in London back to 1797. Just 5.1mm of precipitation was recorded, the second driest January in the series. Screen Shot 2018-01-06 at 22.31.39

Wanstead Weather: 2017 review

This year finished as the 10th warmest on record – some 0.7C warmer than the 1981-2010 average. Screen Shot 2018-01-05 at 12.54.53

Only three months of 2017 were roughly average – the means being within +/-0.7 every month, bringing the mean temperature to 11.9C.

Rainfall was less remarkable with the year finishing roughly average. The total of 607mm (101% of 1981-2010 average) puts it as the 119th wettest since 1797, just over 40mm wetter than 2016.

It was also a slightly duller than average year with 1,391.2 hours of sunshine recorded. That’s 94 per cent of average, the 91st sunniest since 1881.

Screen Shot 2018-01-05 at 13.45.16


For a review of each month, click January, FebruaryMarchAprilMayJuneJulyAugustSeptemberOctoberNovember, December

To view full stats follow this link:http://1drv.ms/1kiTuzv

You can read the national review of weather events at the Met Office blog here.

Screen Shot 2018-01-05 at 14.23.28


Screen Shot 2018-01-05 at 14.25.44


London’s January extremes since 1959

I’ve put together a few top 10s of stats for Wanstead, St James’s Park and Heathrow for the month of January.

Probably most notable is just how impressive the depth of cold was during the cold spell of 1987. When considering St James’s Park the temperature on the 12th never rose above -6C: nearly 4C colder than any January day in 1963, the coldest winter in modern times.

My winter forecast for the London area can be found here.

Screen Shot 2018-01-03 at 21.26.39

Screen Shot 2018-01-04 at 14.47.01

sjp

Some national UK January values according to TORRO

Hottest: 18.3C Aber, Gwynedd – 27th 1958
Coldest: -27.2C Braemar, Grampian – 10th 1982
Wettest: 238.4mm Loch Sloy main adit Strathclyde – 17th 1974

Climatology

Here’s a couple of graphs showing the maxima, minima and rainfall. Notice the spike  which reflects the singularity which has an 84 per cent probability.

jan av tmax

jan av min

jan av rain

December 2017: average temps, wet

December 2017 was a wet month. Just over 83mm of rain was recorded, 157 per cent of average, the wettest December since 2012 and the 38th wettest since 1797.

Screen Shot 2018-01-03 at 19.30.21
The snow depth on December 10th reached 5cm at its maximum

The monthly mean finished 5.6C, precisely average and the coolest December for five years.

Some 48 hours of sunshine were recorded, 120 per cent of average, slightly less than last year.

The most notable event was the on December 10th which produced the best snowfall in 5 years

Air frosts: 10. Ground frosts: 14. Snow falling: 2. Snow lying: 1.

January (on the 3rd) is looking like it may produce more snowfall events similar to December though, with models suggesting a build in heights to the north. A look at the output, including GFS and ECM, suggests the UK will be in a battleground between a cold airmass to the east and warm Atlantic air to the west.

It would seem to back up my winter forecast and also the December analogues with nothing warmer than average.

Average: 33%
Rather cold: 17%
Cold: 17%
Very cold: 0%
Severe: 33%

Screen Shot 2018-01-03 at 19.29.51

Full stats for December here:http://1drv.ms/1rSfT7Y

Summary for December 2017
Temperature (°C):
Mean (1 minute)  5.8
Mean (min+max)   5.5
Mean Minimum     2.8
Mean Maximum     8.3
Minimum          -3.7 day 11
Maximum          14.2 day 30
Highest Minimum  9.8 day 21
Lowest Maximum   2.4 day 10
Air frosts       10
Rainfall (mm):
Total for month  83.7
Wettest day      14.6 day 10
High rain rate   12.1 day 31
Rain days        21
Dry days         10
Wind (mph):
Highest Gust     25.1 day 30
Average Speed    3.5
Wind Run         2570.0 miles
Gale days        0
Pressure (mb):
Maximum          1036.4 day 22
Minimum          970.3 day 10
Days with snow falling         3
Days with snow lying at 0900   1
Total hours of sunshine        48.3 (120%)
Screen Shot 2018-01-03 at 19.30.41

Record low pressure of February 25th 1989

The low pressure system that brought widespread rain and snow on Wednesday reminded me of another event where very low atmospheric pressure helped many low-lying areas experience heavy snowfall.

The unusually deep depression ran along the Channel on February 25th 1989.  Its central pressure of 948mb has been unequalled over southern England since, the value was some 13mb below the lowest on record at the Kew observatory.

Though temperatures reached around 6C in the morning they fell away as the day progressed. This and falling pressure helped turn the rain to snow.  Accumulations were fairly wet in the London area but further north over East Anglia some notable falls were recorded.

greenwich

MetO 25021989
Courtesy of the Met Office

GFS 25021989

summary 25021989
Courtesy of the Met Office
summary2 25021989
Courtesy of the Met Office

Hyperlocal forecasting of snow

The knife-edge situation for snowfall across England today set me off wondering if there was a way to forecast snow locally to a given location.

Temperature, dew point and altitude are all crucial to forecasting snow, as is precipitation intensity that can lower the wet bulb temperature, the ‘rain turning to snow’ scenario. Less well known is the role air pressure plays in these events, such as the one on December 10th which caught many forecasters by surprise by its intensity.

While various models continually improve in their skill at warning us of impending rain / snow events that often cause chaos, their resolution can still struggle and especially when the event more or less becomes a nowcast.

In the International Standard Atmosphere (ISA) there is a 1 hPa difference for each 30 feet vertical change in height in the lower levels.

If we take a forecast pressure as 970 hPa, the difference between standard conditions (1000 hPa) and 970 hPa is thus: 30 hPa

30 hPa * 30 = 900ft height variation.

You then consider local altitude: in my case 18m (59ft)

So 59ft – 900ft = 841ft  (256m)

A simple table, therefore, to consider air pressure is thus.

1000 hPa = 0m
995 hPa = 27.6m
990 hPa = 73.3m
985 hPa = 119.1m
980 hPa = 164.8m
975 hPa = 210.5m
970 hPa = 256.2m
965 hPa = 301.9m
960 hPa = 347.7m
955 hPa = 393.4m
950 hPa = 439.1m

Looking at the system today the pressure rose quickly after the centre passed, leading to a 1hr (at best) window of snow falling. As the pressure rose, and the temperature picked up only slightly the snow turned back to sleet and then rain.

pressure
Pressure rose quickly on the 27th, far more rapidly than the 10th – the pressure on this day stayed below 976mb from 8am until 3pm, allowing snow to accumulate. Temperature on the day was also around 0.5C cooler


pressure 10122017
Pressure fell to its lowest point 970.3mb at 1159z on the 10th

temperature

temp trace 10122017
The temp and dew point hardly moved from 9am

wet bulb

chilterns

http://weatherfaqs.org.uk/node/152

http://aeropowerflightschool.com.au/how-to-calculate-pressure-heightaltitude/


Snow for day after Boxing Day?

The models are showing another knife-edge situation for snow – similar to the ‘rain turning to snow’ event earlier this month. But there are a number of factors working against it this time round, at least for most of us who live between sea level and 30 metres.

Screen Shot 2017-12-26 at 08.43.38
The highest resolution model AROME shows snowfall rate but I would expect that only high ground (100m +) will see any accumulation

The low level supply of air off the continent is much milder this time round. Hamburg and northern Germany on the 9th was some 5C colder than currently.

The air pressure, crucial to bringing that snow line down lower, is forecast to be around 10mb higher this time.

And even if we see settling the soil temps, after the recent mild spell, are still 5C – 10C down to 10cm… Screen Shot 2017-12-26 at 11.46.19

wet bulb

chilterns

London Grimness index

The last three months in east London have been sunnier than average – hard to believe as we move into a regime of easterlies that will bring showers and anticyclonic gloom.

Screen Shot 2017-12-21 at 21.30.14
A sunless outlook from the Met Office last December

With no sun and short days  it is no surprise that many are probably already feeling short-changed in the solar stakes.

A blog by XMetman on a ‘grimness index’ got me thinking how London fairs in terms of sunshine, temperature and rain in any given winter season.

Using the same criteria, and assuming that most people welcome sunshine, it can be seen that since the least grim winter of 2007-08, the season, over the past 10 years, has been growing steadily worse.

Screen Shot 2017-12-21 at 21.51.54
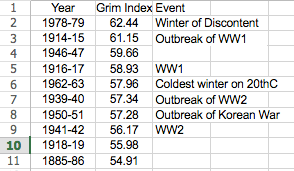
The grimmest winter, considering statistics back to 1881, was, ironically, the 1978-79 ‘Winter of Discontent’ when, again ironically, ‘Sunny Jim’ Callaghan was in Downing Street as widespread strikes coincided with the coldest winter for 16 years. On looking at the Top 10 of grim winters it is striking how most coincide with depressing world events, the Great War, World War 2 and the Korean War!

grim index

The Tory ‘Crisis? What Crisis?’ campaign was probably my first memory of a general election broadcast.

Wanstead fairs well in London cold rush

Since the early hours of Sunday I’ve been tracking official sites around London to see how Wanstead fairs in terms of retaining cold temperatures and snow.

temp trace

The results, comparing hourly obs over 62 hours, show that Wanstead was a degree cooler than St James’s Park, half a degree cooler than Heathrow and marginally cooler than Northholt. Only Kenley, with its whopping 170m of altitude, was cooler.

While half a degree doesn’t sound much it can make all the difference, as we saw at the weekend when some areas recorded inches of snow while others barely a centimetre.

Though the snow has pretty much vanished now it was evident yesterday that the area was far more wintry neighbouring Forest Gate, Leyton and Stratford which had pretty much lost all their cover.

A report on the snow event can be found here.

* For anyone who has a fascination for the weather and whether their back garden in the Counties Estate is colder than their mate’s in the Warren Estate I notice that weather stations are now even cheaper and you don’t need to connect to the net via a dedicated PC. A unit from Ventus (the W830) allows you to connect to the amateur weather network Wunderground. The internet dealer Weatherspares has them on offer. (NB. I am not on commission but would be happy to offer anyone advice who wants to buy and set one up.)

wanstead
Wanstead, Aldersbrook, the Flats and Wanstead Park are all part of a ‘green island’ in east London that tends to hold the cold better than surrounding built up areas

Meteorology-based musings about east London and beyond