
September in recent years has often been a more summery month than August. But this month in some years can see a rapid onset of autumn.
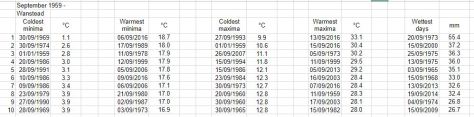
I’ve put together a few top 10s of stats for Wanstead, St James’s Park and Heathrow for the month of September.


Some national UK September values according to TORRO
Hottest: 35.6C Bawtry, South Yorkshire – 2nd 1906
Coldest: -4.5C Dalwhinnie, Highland, – 26th 1942
Wettest: 190.7mm West Stourmouth, Kent – 20th 1973
In terms of climatology September maxima, considering the 1981-2010 average, shows a slight decrease through the month, though around the 1st and the 22nd there is often a spike. This would reflect the September singularities; early September warmth occurs in 82 per cent of years while the ‘Old Wives Summer’ has a 64 per cent probability.

The average rainfall graphic shows that downpour amounts are variable through the month. A tendency for dry weather to the 8th prevails before the trend increases, the wettest days usually 13th and 19th.


3 thoughts on “London’s September extremes since 1959”