This winter is looking mild or very mild overall with slightly above average rainfall.
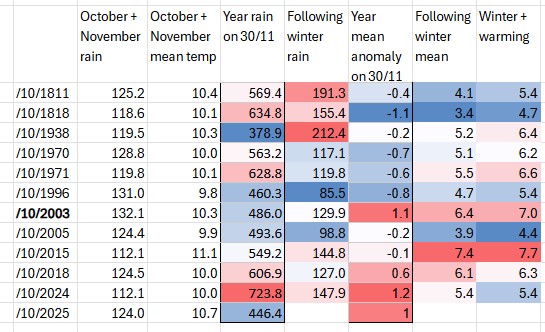
This year I’ve added to my previous method of forecasting by also considering the 12-month rolling rainfall statistics on November 30th together with the January-November mean anomalies.
This gave the following list.
Thus, in terms of chances:
Above average
>6.2
46%
Average mean (C)
5.2-6.2
36%
Below average
<5.2
18%
And for rainfall:
>125%
195
18%
Average (mm)
156.1
64%
<75%
117
18%
The ‘line of best fit’ appears to be the winter of 2003/04 which, after a cold snap in late December that delivered a maximum snow depth of 7cm on December 29th, it turned out to be yet another mild winter.
The coming winter is likely to be mild and wet overall thanks to a predominant south-westerly Atlantic regime.
While that may sound grim for any snow and cold lovers reading this I would suggest that the possibility of brief cold snaps this season are higher than they have been during the last few winters.
This year I have tried to improve my statistical method by adding warming on to previous years to, hopefully, give better results.
In terms of rainfall and mean temperature a total of eleven years were similar to this October and November, spanning 1826 to 2021.
The probabilities for the following DJF winter were thus.
Mean temperature
Probability
Rainfall
Probability
Very mild
46%
Wet
33%
Average to mild
33%
Average
37%
Below average
21%
Dry
30%
London winter forecast 2024/25
Looking deeper into the stats I had a look at the Oceanic Niño Index; no years were similar to this one though the index only goes as far back as 1950 – so no real help.
The prognosis for snow at this point seems bleak – though chances may be heightened should we experience a stratospheric sudden warming in December / January. Though, as seen in 1987 where a vortex ‘split’ was recorded, this would still not guarantee wintry weather.
Looking at the data month to month would suggest the best chance of a cold snap around December 22nd through Christmas before warming up in the New Year. Beyond that I would suggest that the chances of another cold snap in January are higher than they have been for the last few winters. February, however, looks very mild and possibly very wet.
This winter is most likely to be on the colder side of average with near normal rainfall.
While the modelled prognosis for the first half of December looks unsettled with an Atlantic influence evolving from the current chilly NW’ly to a mild SW’ly, local analogues of the climate of London suggest the season could be a bit of a rollercoaster with spells of wet, windy and mild weather alternating with dry, calm and cold.
A large factor to consider this winter is the presence of a slight La Nina that is forecast to evolve cooler.
Given the uncertainties involved with the influence of ENSO I’ve decided to stick with analogues found in local data that stretches back to 1797.
Overall then the probabilities for the next 90 days are.
Mean
Probability
Rainfall
Probability
Mild (>5.9C)
14%
Wet (>178mm)
19%
Average (5.1C – 5.9C)
38%
Average (107-177mm)
62%
Cold (<5.1C)
48%
Dry (>107mm)
19%
The above table doesn’t reveal a great deal in that extremes can be hidden in a month or season that finishes broadly average. So I decided to look closer at the winters that were revealed in the analogues.
December
The first month, as already mentioned, looks like it will be on the mild side with possibly a notable storm off the Atlantic before things calm down over Christmas – the period between Boxing Day and New Year’s Eve possibly presenting the best chance of any lying snow in this region.
The below graphs are a smoothed representation of the years revealed in the analogues most similar to this autumn.
What is probably most interesting is that the analogues that shared a similar ENSO / La Nina index to this autumn tended to ‘turbo charge’ any yo-yoing in the weather type, be that super-mild or abnormal cold.
December probabilties for maxima: Mild: 48% Average: 19% Cold: 33%
And precipitation. Wet: 33% Average: 29% Dry: 38%
So, the month overall will be mild and slightly dry
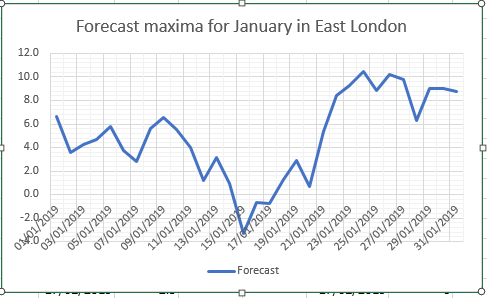
January
The first month of 2022 probably represents this region’s best chance of lying snow this winter. A mild start perhaps with a falling off of temperatures in the final third of the month and a cold spell of a week or so. As with December the influence of La Nina could tend to boost the swings in the pattern.
January probabilties for maxima: Mild: 33% Average: 10% Cold: 57%
And precipitation. Wet: 19% Average: 43% Dry: 38%
Greatest chances for January, then, are cold with average precipitation.
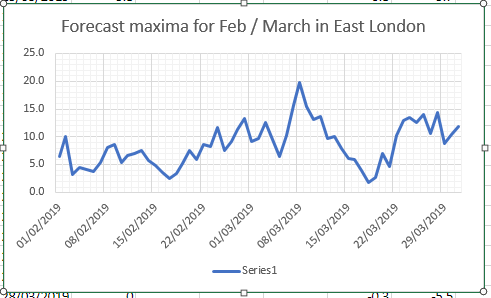
February
The second month may see a slight return of the cold spell in January before temperatures recover for a mild and wet spell in the second half.
February probabilities for maxima. Mild: 33% Average: 15% Cold: 52%
And precipitation. Wet: 38% Average: 38% Dry: 24%
The stats suggest on the cold side overall with average to above average rainfall. Perhaps the depth of the cold skewing any very mild second half of the month?
The extremes that no-one can forecast
As well as the very mild winter of 1989/90 the analogues also revealed the very cold winter of 1978/79. There were others but their occurence makes the probability of a repeat at either extreme at less than 10 per cent.
Lots of hype regarding winter at the moment with contradictory model output being released almost daily.
My early take on this is based on the current state of the El Nino Southern Oscillation (ENSO) index which is currently -0.6 and trending more negative (La Nina).
Using analogues from previous events would suggest that the coming winter in the south-east of England will be broadly average in terms of mean temperature and wetter than average.
Looking more closely at each year suggests the following.
Further scrutiny of the local statistics suggest that the mean temperature for November could be lower than average, some 1.7C below average with rainfall around 20 per cent below average.
I should be noted, however, that in the years that were most similar to this September and October (1958, 1961, 1967, 2001, 2005, 2019) the ENSO index was much closer to neutral than it is now. In other words what happens next month could be vastly different to what happened in those years.
Years prior to those mentioned above add intrigue as ENSO statistics are not available.
1802 (cold January 1803), 1849 (severe January 1850 with ice in the Thames) 1862, 1865 (heavy snow southern England 10/11 January) 1874 (notable December storm)
Obviously a lot can change atmospherically in the next few weeks; this is an early take on my usual winter forecast which will be released on December 1st.
The best chance for lying snow this winter looks like being at the end of the second week of January.
A combination of local analogues and global atmospheric factors including the El Niño-Southern Oscillation suggest that the coming season will be colder than recent years. Though that’s not saying much considering just how mild winters of the past decade have been.
Meteorological autumn was the warmest for 5 years and slightly drier than last year’s wet autumn. Though it shares some similarities with 2015 the external influences are thankfully different to that season which produced the warmest December on record. Considering data back to 1797 I was able to make the following suggestions on how the next 90 days may unfold.
December is most likely to be around average temperature-wise with rainfall also about average. Possibly stormy at the end of the first week. Any snowfall events are likely to be marginal – bad news for anywhere below 70m above sea level. In terms of Christmas a white one in London looks unlikely. There may be interest in the week running up to the big day but I wouldn’t be surprised to see that inexplicable warm up that often happens just as the 25th arrives. Mean: 5.8°C (5.6°C 1981-2010 average) Rainfall: 57.1mm (53.2mm 1981-2010 average)
January is the month most likely to see any lying snowfall, particularly during the first half of the month, with the mean temperature about 1C colder than average. Rainfall is likely to be above average. Mean: 4.1°C (5.2°C 1981-2010 average) Rainfall: 63.8mm (53.2mm 1981-2010 average)
February looks wet and mild overall. Mean: 6°C (5.3°C 1981-2010 average) Rainfall: 55.6mm (39.2mm 1981-2010 average)
Overall the mean for winter: 5.3°C, a little below average. And rainfall about 120 per cent higher than average.
Looking in closer detail reveals that the coldest period is most likely to be between 13th and 19th January, with anomalies sufficiently low enough for lasting lying snow.
The extremes that no-one can forecast
As well as the extreme December 2015 the analogues also revealed the severe season of 1822-23 which saw ice on the Thames by late December. February 8th saw a great snowstorm in northern England where people had to tunnel through the snow.
Another was 1950-51 which was very snowy at high levels. There were 102 days of lying snow at Dalwhinnie (1000ft), exceeding the 83 days set in 1946-47. December 15th saw 15in of snow in Shanklin, Isle of Wight in 3.5 hours.
For this year’s winter forecast, because of time constraints, I am sticking purely to what the local analogues reveal.
Meteorological autumn was the wettest for 18 years and the coolest for 6 years, revealing some interesting similarities with past climate. Considering data back to 1797 I was able to make the following suggestions on how the next 90 days may unfold.
December is most likely to be on the cold side with rainfall slightly below average.
January is most likely to finish average temperature-wise and wetter than December.
London’s February extremes temperature also look average overall and the precipitation signal also creeps up in comparison to the first two winter months.
Best chance for snow? Impossible to pin down but the coldest weather is likely to be at the beginning of February, the third week of January and just after Christmas.
The warmest period looks to be around January 10th while there’s also a signal for that often phenomena of milder temperatures just before Christmas day.
Most of the probabilities in the above statements are relatively low and are explained in the table below.
Weather models are continuing to struggle in the aftermath of the stratospheric sudden warming on January 1st. The GFS and ECMWF have flip-flopped: on one run decent northern blocking extends southward only for the dreaded European high to appear on the next.
Using a combination of QBO and ENSO data featured in my winter forecast and statistics from previous SSWs (including 2013 and 2018) achieved the following results shown in this graphic.
Although some days in the next week or so will be cold it is not until the 14th that conditions start to bite, the start of a week-long cold spell that will probably be more notable for cold than snowfall.
The rapid recovery in temperature would suggest that the Azores / European high making a return. With the MJO moving back and forth between phase 7 and 8, and looking at the behaviour of previous cold spells, this would make sense.
The GFS has been churning out some very strange charts of late
As for February, unless there are further SSWs to disrupt the polar vortex, and depending on its recovery, it is unlikely we will see a repeat of the winter of 1984/85 that I hinted at last month. The graphic below, however, would suggest another cold spell in the third week of February.
Long range modelled forecasts have been all over the place of late and, looking at the underlying signals, it is easy to see why.
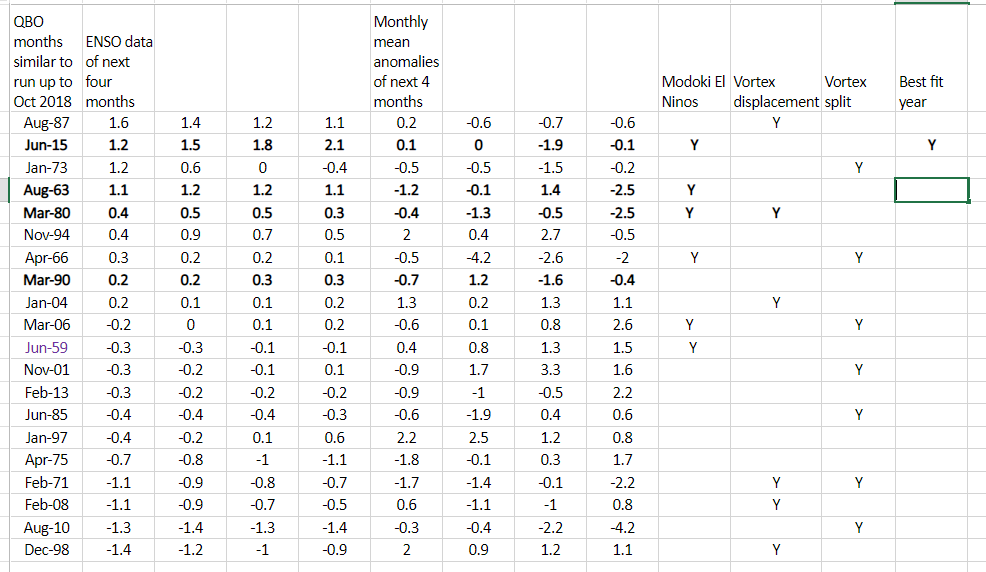
When I’ve produced these forecast in the past, in terms of QBO and ENSO data, there’s usually a lot of analogues to compare with. This year, however, seems to be an exception.
Considering QBO first I looked back over data to 1950 and found nothing similar for October. However, looking over the whole series the cyclical nature of this circulation may give some clue.
Some 20 months were revealed, ranging from June 1959 to June 2015. Using NOAA’s Niño 3.4 region I narrowed this list down to the few that had an ENSO value of around +1 with a rising trend. With NOAA’s forecast of a Modoki El Nino (one that occurs in the central Pacific) this narrowed the list to just 1 period: June 2015. Considering maxima anomalies this would give the following winter.
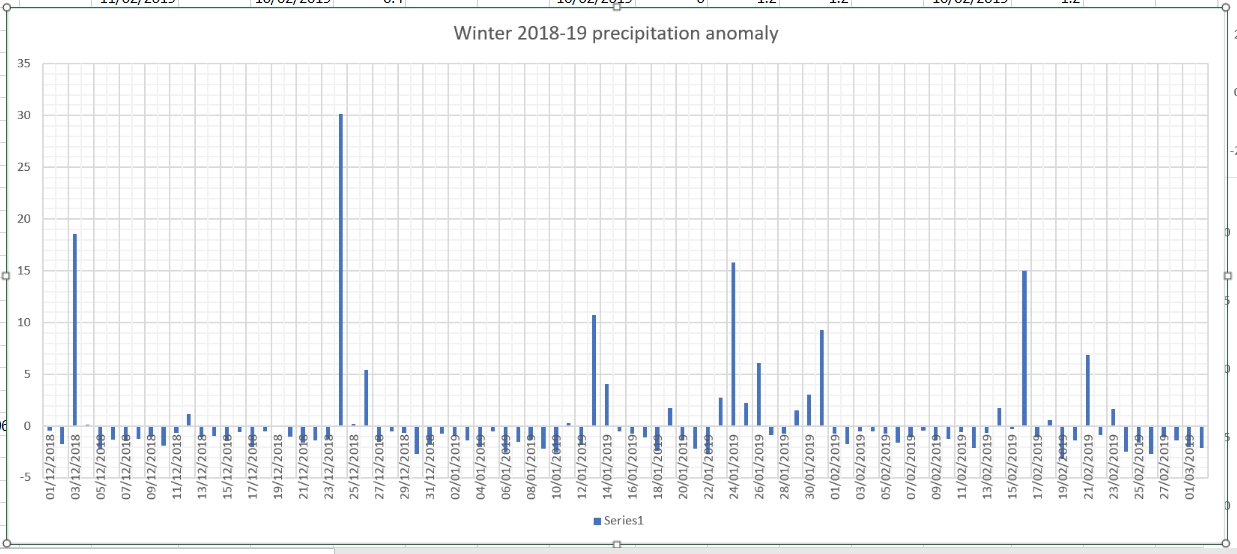
The above would suggest there being a general cool down through December with a cold spell starting just before Christmas into the new year? And another cold spell end of January into the first week of February?
The above precipitation anomaly chart would suggest a wetter than average December, January and February, though February by much less so.
It’s been a very busy autumn so I’m keeping this short.
The below figures, particularly January and February, may be different in the event of an SSW occurring. In all then.
At the beginning of December the opening par for my forecast for winter read:
The mean temperature for winter 2017/18 is looking average overall with average precipitation. While that doesn’t sound exciting for anyone looking for colder weather and snow I think the figures mask frequent 3 or 4 day-long cold snaps from the Arctic interspersed with milder interludes from Atlantic incursions; typical characteristics of a pattern driven by the troposphere. For anything longer term we have to hope for a warming of the stratosphere, a sudden stratospheric warming over the Arctic, that downwells into the troposphere, reversing the general westerly circulation. We are overdue an ‘SSW’ event but, even if one were to happen, its effects wouldn’t be felt until much later in the winter.
Figures generated using QBO statistics in the run up to December were identical to the outcome of 5C. It is figures generated using ENSO statistics, however, that produced the best results considering December, January and February alone.
It would seem that the winter was most influenced by the ENSO variable up until February when the effects of the SSW were enough to overcome it?
I’ve been doing these written winter forecasts for five years now but this year I’ve never seen such a spread of probabilities as to how winter may pan out. So, if by the end of reading this you are none the wiser, you’re not alone!
The mean temperature for winter 2017/18 is looking average overall with average precipitation. While that doesn’t sound exciting for anyone looking for colder weather and snow I think the figures mask frequent 3 or 4 day-long cold snaps from the Arctic interspersed with milder interludes from Atlantic incursions; typical characteristics of a pattern driven by the troposphere. For anything longer term we have to hope for a warming of the stratosphere, a sudden stratospheric warming over the Arctic, that downwells into the troposphere, reversing the general westerly circulation. We are overdue an ‘SSW’ event but, even if one were to happen, its effects wouldn’t be felt until much later in the winter.
The current cold snap follows the recent disruption of the polar vortex. The ‘displaced polar vortex’ regime seems to be becoming more common as the Arctic gets warmer and maintains more open water during winter. This leads to anomalous ridging over the Arctic, which results in a displaced or bifurcated vortex, which leads to somewhere in midlatitude getting persistent anomalous cold. There was very cold air around last year but the UK missed out; the heart of the cold plunging down far to our east with snow falling on beaches in Crete!
This week’s cold snap looks like it will be short lived though the ‘displaced vortex’ could be an early sign of yet another pattern transition in the troposphere. Looking at the latest model output it is uncertain how long the next polar vortex perturbation will be.
So, whether we see any cold, snow-worthy, air this winter is a lottery – though I think our chances are a lot better than they have been for the past 5 years.
Because October and November have been so dry I’ve had very little to work with in terms of stats to try to find if the current pattern is similar to previous autumns. Instead I’ve looked in depth at ENSO, QBO and local meteorological data.
ENSO
The El Niño–Southern Oscillation (ENSO) is a periodic variation in winds and sea surface temperatures over the tropical eastern Pacific Ocean. It is forecast to be mildly negative (La Nina) over the coming winter. Many doubt whether it has an impact on our winter but there seems to be a connection with strong La Ninas and very mild winters. Because it is forecast to only be mildly negative it’s impact may be very small. I had a look at similar years were ENSO was -0.4 in September and came up with the following.
QBO
I also had a look the quasi-biennial oscillation (QBO), the quasiperiodic oscillation of the equatorial zonal wind between easterlies and westerlies in the tropical stratosphere. This produced the following table of probabilities.
Singularities / patterns
My traditional method of looking back for similar patterns of weather in the autumn produced this table.
So, considering all three tables together, would suggest, probably bizarrely given the cold start to this month, a rather mild December followed by an average January and February.


You must be logged in to post a comment.