Category Archives: Weather

Front loaded rainfall months

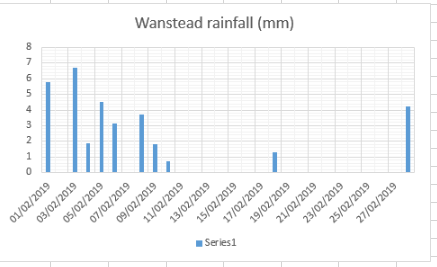
Since February most of this region’s rainfall has been falling during the first half of the month.

feb

February: 86%

march

March: 134%

april

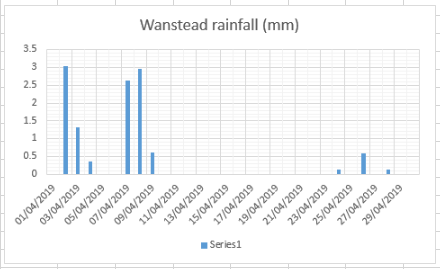
April 28%

may

May (to 26th) 54%

With only one of these months wetter than average the long-term, rolling trend continues to head downwards.

rolling

Considering past rainfall patterns it can only be a matter of time before the graph heads upwards again. Looking further back at rainfall data to 1961 reveals the extremes were higher and that the jump from dry to wet can be sudden.

The wettest 12-month rolling period ended mid way through May 1975 with a total of 873mm. However, just 16 months later, at the end of the hot summer of 1976, the rolling 12-month average was just 302mm, that’s less than half of our average annual rainfall!

average rain


The climatology of Zermatt

Zermatt and the surrounding Valais area in Switzerland has a varied Alpine climate. But a study of weather data back to the beginning of 2011 reveals distinct seasonal patterns in terms of air pressure and precipitation.

Although these patterns can’t be relied on completely in terms of planning a wintersport or summer climbing trip awareness of the extremes can be a big help. Knowing when pressure is usually highest can help mountaineers pick that ideal week in summer to tackle 4,000m peaks. Similarly pinpointing weeks with lowest pressure and highest precipitation is the holy grail for those hunting for powder snow.

Looking at the averages pressure is highest on December 23rd. Further scrutiny of rolling weekly averages shows this date coincides with the week commencing December 20th. Anyone who’s been to the Alps at Christmas time will know that this period can be very unreliable for deep snow cover. In terms of summer pressure is highest on August 21st.

Pressure is lowest on February 2nd. Again this date often coincides when the deepest snowfalls often arrive after weeks of dry weather. Despite the unsettled pattern at this time annual precipitation is usually greatest at the end of October / beginning of November. I’ve lost count of the number of times the press interpret these early snowfalls to be a sign of a bumper season ahead only for the skies to clear at the end of November and, sometimes, the arrival of unseasonably warm weather.

The second wettest period is usually the end of April / beginning of May. Again, this past week has seen some parts of the Alps record the best snowfalls this season.

zermatt pressure

zermatt rainfall

April 2019: average and dry

April finished average though the final figure masked cool and warm spells.

The mean temperature finished 9.7C that’s 0.1C below average and 2C cooler than last April.

Only 11.9mm of precipitation were recorded,  28 per cent of the 1981-2010 average and almost as dry as April 2017.

Some 170 hours of sunshine were recorded, that’s 106 per cent of average.

Four air frosts were recorded.

To view full stats follow this link:http://1drv.ms/1kiTuzv

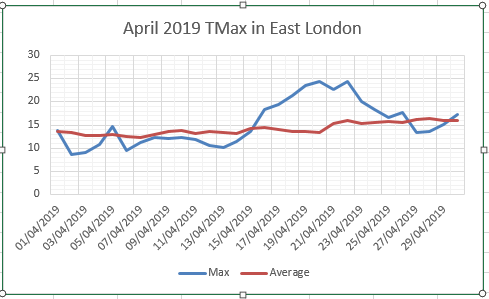
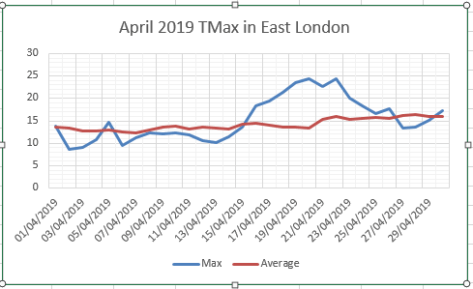
april2019max
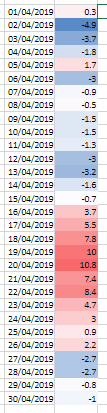
‘Feels like’ maxima.
april 2019
April 1981-2019 maximum anomalies
april 1981-2019

Where’s east London’s rain coming from?

April 2019 was yet another dry month. Just under 12mm was recorded, that’s 28 per cent of average.

There has been rain around but the prevailing wind has not been conducive for great amounts to fall here. Last weekend, over a period of 5 days, just 0.9mm fall. Yet Capel Curig in Snowdonia, 200 miles northwest as the crow flies, recorded 130mm thanks to a NW’ly regime.

A look at rainfall in Wanstead back to July 2013 shows that of the 3,550mm recorded just 17 per cent has fallen when the wind was NW’ly.

Because of the topography of the area most of our rain falls when the wind is blowing between SE’ly and SW’ly, a total of 43 per cent.

A westerly is usually reliable for rainfall, however because this area is in the lee of high ground areas such as Hampstead westerlies have delivered just under 8 per cent of that 6-year total.

rain rose

How April has warmed in London since 1980

april 1981-2019

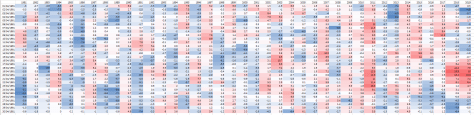
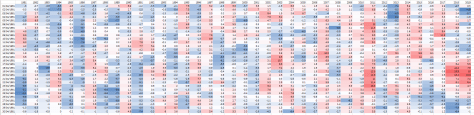
The above graphic shows maxima recorded in the month of April with shading to represent the anomaly of each day relative to the 1981-2010 average.

The last two years show the warm spells experienced in the second half of the month. The overall impression is that warming seems to have accelerated since 2011.


March 2019: mild and wet

March was mild, particularly compared with last year. And wet though, like February, the rain fell at the start of the month, leaving a dry end.

The mean temperature finished 9.4C that’s 1.7C above average and over 3C warmer than last March.

Some 54.5mm of precipitation was recorded,  134 per cent of the 1981-2010 average.

Some  109 hours of sunshine were recorded, that’s  precisely average.

Just one air frost was recorded.

To view full stats follow this link:http://1drv.ms/1kiTuzv

march 2019
‘Feels like’ maxima.
march 2019 feels like
key

Is it warm, cold or just normal?

Saying how warm or cold a day feels is subjective; one person’s hot day in spring is another’s ‘on the warm side’. Similarly when someone says the temperature on any given day is ‘normal for the time of year’ others will be exclaiming how cold they’re feeling.

The ‘heatwave’ in February was a case in point. Though many places recorded their warmest February maxima on record many were saying it was just a nice, warmer than normal spell of weather.

Some years ago the Met Office issued guidance on how warm or cold a day was relative to the anomaly. Earlier this month the table was posted on Twitter and I have plotted a graph for the spring period.

Today’s (March 22nd) maximum of 11.1C is therefore described as ‘normal’.

temp feel

cold hot warm


Data reveal windiest March for 4 years

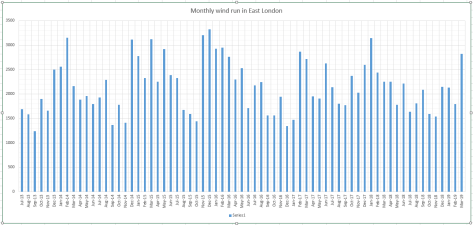
March 2019 has been a windy month so far. With 11 days to go it is already the windiest March for 4 years and the windiest month for over a year.

The windiest month recorded since 2013 was December 2015.

Looking at the data in general there seems to be a pattern of a windy month that is followed by a decline of between 10 and 13 months.

monthly wind run


Spring or still winter? Plants reveal all.

With the record warm spell last month and high sunshine totals you would think that the growing season is well under way. Spring bulbs have been out for weeks, trees are blossoming and many shrubs are on the verge of flushing.

But a look at the local temperature records over the last six years shows that things aren’t as advanced as previous seasons.

Considering the period from December 1st – in recent years a date when it is common to see bulb shoots beginning to emerge – to March 10th reveals the following table in terms of growing degree days.

growing degree days

The warm days of last month were cancelled out by cold, frosty nights, leading to little net warmth. And the last ‘growing degree-day’ was on March 2nd. Nevertheless growth is further on than last year that saw record cold in March. 

The season is a long way behind 2015-16, however, which saw a record-breaking mild December.

Looking at the list below, and the at best average outlook, we’ve still got a way to go before we’ll see most trees in full leaf…

plant development
This list courtesy of Wikipedia


February’s record diurnal temperature ranges

Last week’s warm spell not only saw national maxima records tumble but, locally, saw the February diurnal temperature range record shattered too.

Four days of near cloudless skies produced classic conditions whereby the maximum amount of solar heating by day was followed by clear nights allowing all that heat to escape with air frosts forming.

The spell saw five new entries in the ‘top 10’ of February diurnal temperatures since 1959, with both the 25th and 26th surpassing the record set in 1976 by at least 0.3C.

feb diurnal new
Top 10 February diurnal temp ranges

The diurnal ranges were not enough to make the annual list, however

top 10 diunrals
Top 10 diurnal temperature ranges since 1959