
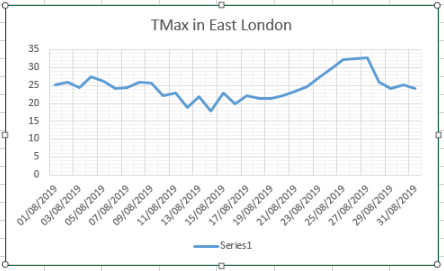
Apart from the hot four days in the last week August 2019 was fairly unremarkable.
Overall the monthly mean finished 19.9C, that’s 1.4C above average.
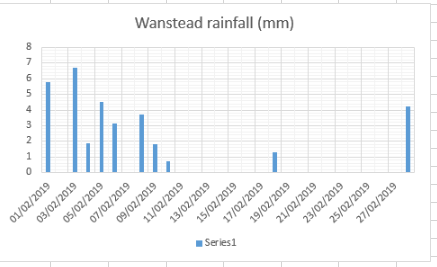
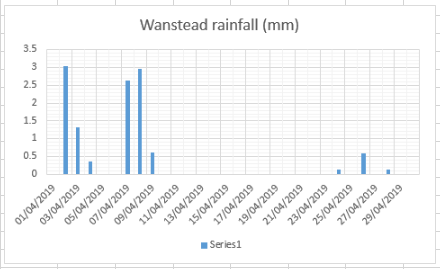
Rainfall at 37.7mm, was 75 per cent of average, the driest for 3 years. Sunshine, at 180hrs, the sunniest for 3 years.
To view full stats follow this link:http://1drv.ms/1kiTuzv
Summary for August 2019:
Temperature (°C):
Mean (1 minute) 18.9
Mean (min+max) 19.3
Mean Minimum 13.9
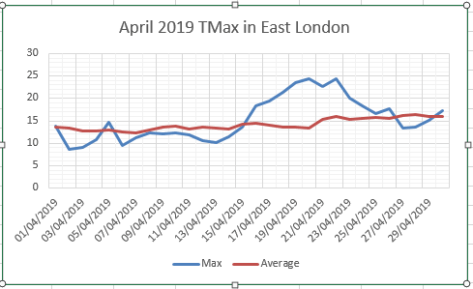
Mean Maximum 24.7
Minimum 8.8 day 20
Maximum 32.6 day 27
Highest Minimum 19.5 day 07
Lowest Maximum 17.9 day 14
Air frosts 0
Rainfall (mm):
Total for month 37.7
Wettest day 12.6 day 14
High rain rate 65.8 day 09
Rain days 11
Dry days 20
Wind (mph):
Highest Gust 22.1 day 10
Average Speed 2.6
Wind Run 1941.4 miles
Gale days 0
Pressure (mb):
Maximum
Minimum
Days with snow falling 0
Days with snow lying at 0900 0


You must be logged in to post a comment.