Category Archives: London weather

THE STORM OF MARCH 4, 1818

Early March often brings stormy weather, a singularity that has a probability of 88 per cent!

An example of just how long this singularity has been around can be found in the early 19th century

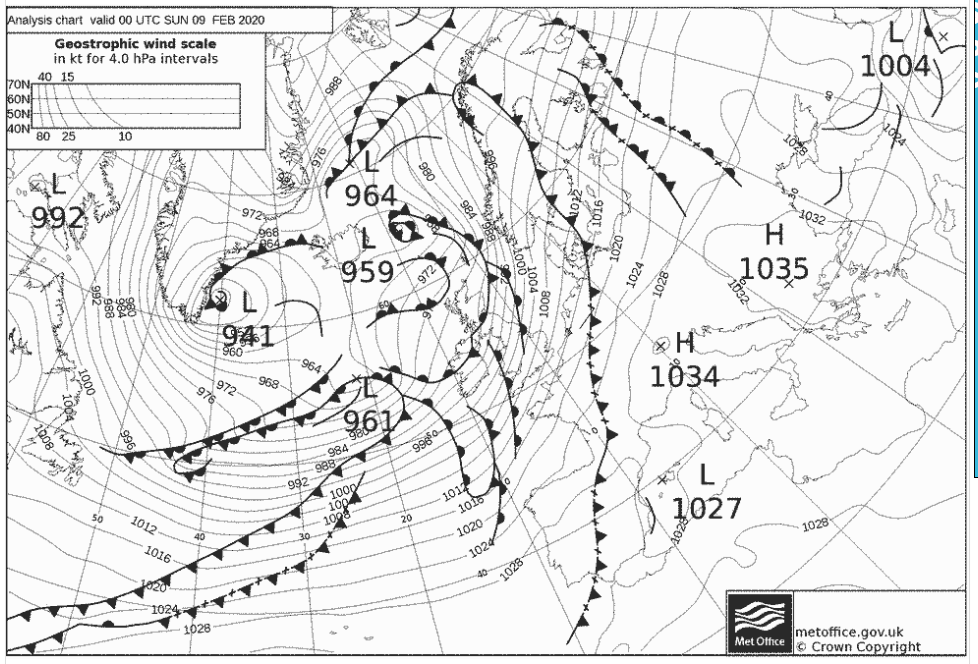
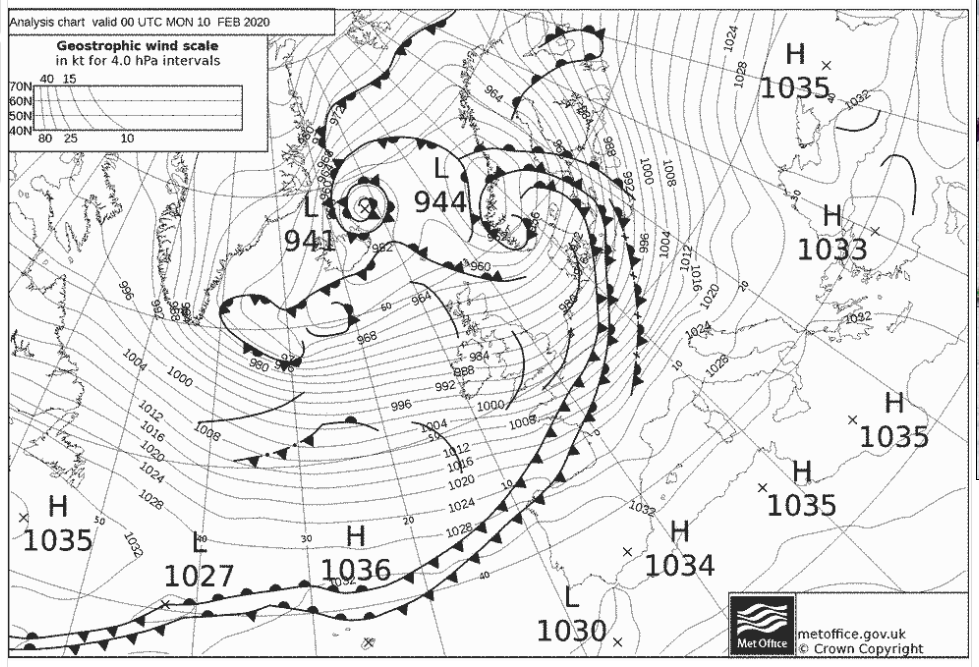
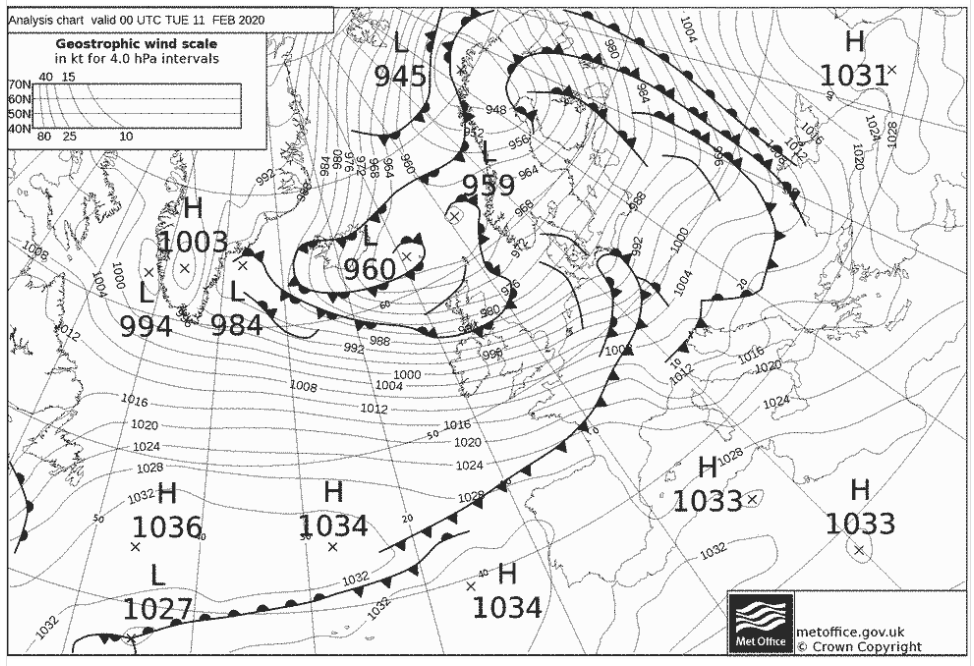
In his book The Climate of London Luke Howard mentions that the air pressure on March 4th was the lowest measured for some 37 years. The lowest point of 28.35 inches (960mb) is remarkable in that the lowest I’ve measured in Wanstead since 2012 was 969.8mb last December!

The storm brought devastation across a wide swath of southern England with loss of life on both land and sea.
Howard’s account of the storm mentions the barometer falling an inch in 15 hours with rain after dark with the wind “raging in violent gusts from SE and SW till past midnight when it abated after much thunder and lightning”.

His friend in Manchester, Dr William Henry, wrote a storm SW caused considerable damage, delaying the London mail in Macclesfield from 8pm until 3am on the 5th, the storm raging until 3am. The barometer fell to 28.2in (955mb) at Manchester.

Character of the period for the most part tempestuous with frequent rains the barometer running through a series of sharp depressions till near the close when it suddenly assumed the elevation of fair weather Almost all the showers from the first were more or less mingled with hail

Elsewhere in Britain public ledgers also reported the storm.

Yarmouth A most tremendous gale of wind from the S to the SE with rain came on about 8pm which continued with increasing violence all night and has done considerable damage to the shipping on this part of our coast.

Deal Last night it came on to blow a most tremendous gale from the south and continued nearly the whole of the night with unabated violence at midnight it blew a complete hurricane accompanied with thunder and lightning during which several vessels in docks suffered.

Portsmouth It blew a tremendous hurricane last night from S and SSE accompanied with the highest spring rides ever remembered.

Ryde One of the severest gales of wind that has been felt here for the last 37 years was experienced last night. It commenced about 4.30pm and continued with increased violence until past 11pm during which time the greater part of the pier and several houses were demolished. The supposed damage is estimated at between £4,000 and £5,000. No lives were lost nor any damage done to the shipping.

Dartmouth We experienced a perfect hurricane last night at SSE from 6pm to 10pm

Exmouth On the 4th instant between 7pm and 8pm we had a most tremendous gale of wind about SSE with dreadful rain thunder and lightning.

Falmouth At day light this morning the wind was from the WSW moderate. About 11am it strengthened to the S and from that to SSE and since that time until 10pm it has blown a hurricane with a heavy sea.

Penzance We had a very heavy gale here on Wednesday the 4th.

Milford On the 4th it blew a very heavy storm from SW to WNW.

Leicester Wednesday night was one of the most boisterous recollected for years past. Much damage has been sustained in this town and many parts of the county.

Hull At high water about 4.30pm the wind then blowing from the SW with moderate weather the tide flowed at the Old Dock Gates 18ft 6in. After the tide had fallen from 1 to 2in the dock gates closed as usual with the ebbing of the tide which then began again to flow to the height as near as can be calculated of four or five inches thereby opening the gates again and continued flowing. The tempestuous night of Wednesday ensued the wind blew a heavy gale still from the SW and at high water at 5am Thursday morning the tide was 14ft 1in being 4 feet 5 inches less than on the preceding evening although from the spring tides having put in the water ought according to the usual state of things to have flowed higher than on the Wednesday evening

Plymouth At the commencement of the winter a few large stones were placed by themselves on the top or finished part of the Breakwater to see if they would stand the winter gales they stood all but this last and this morning I found them washed from the top and lying on the North Slope There were three of them one of nine tons and the other two of five tons each they will be replaced as soon as possible for further trial Plymouth The effects of the late thunder storm of the 4th March on a fir tree belonging to W Langmead Esq at Elfordleigh in the neighbourhood of Plymouth are too singular to be omitted and perhaps the most extraordinary ones that ever occurred in this county on such an occasion The tree in question has been long admired for its size and noble proportions being more than 100 feet high and nearly 14 feet in girth but it exists no longer having been literally shivered to pieces by the electric fluid Some of the fragments lie 260 feet from the spot and others bestrew the ground in every direction presenting altogether a scene of desolated vegetation easier to be conceived than described.

The cold spell of February 2021

Valentines Day 2021 saw the cold spell come to an end in the London area. Maxima over the past 7 days never exceeded 2.3C on any day, the yardstick I use for a spell of cold weather to qualify.

Though some places did get a decent amount of snow precipitation in this area was very low ; lying snow at 9am at this station never exceeded 3cm. Very cold, dry air however was enough to preserve cover out of the sun.

As cold spells go it was two days longer than the median of 5 days, so slighter colder and drier but with double the amount of sunshine.

A couple of years ago I tried to rank cold spells in this area since 1960, with mixed results. I’ve since revisited the method and have achieved better results using the following algorithm.
(Number of days * total precipitation)*(mean temperature of spell)-(total sun hours). This gave the following list.

And the next 26 cold spells

A comparison of the upper air at the start of two cold spells

There’s been many images that define this spell but this post probably nails it in that I’ve never seen the ice thick enough on the marshes to tempt someone to ice skate.

London winter forecast 2020/21

The best chance for lying snow this winter looks like being at the end of the second week of January.

A combination of local analogues and global atmospheric factors including the El Niño-Southern Oscillation suggest that the coming season will be colder than recent years. Though that’s not saying much considering just how mild winters of the past decade have been.

Meteorological autumn was the warmest for 5 years and slightly drier than last year’s wet autumn. Though it shares some similarities with 2015 the external influences are thankfully different to that season which produced the warmest December on record. Considering data back to 1797 I was able to make the following suggestions on how the next 90 days may unfold.

December is most likely to be around average temperature-wise with rainfall also about average. Possibly stormy at the end of the first week. Any snowfall events are likely to be marginal – bad news for anywhere below 70m above sea level. In terms of Christmas a white one in London looks unlikely. There may be interest in the week running up to the big day but I wouldn’t be surprised to see that inexplicable warm up that often happens just as the 25th arrives.
Mean: 5.8°C (5.6°C 1981-2010 average)
Rainfall: 57.1mm (53.2mm 1981-2010 average)

January is the month most likely to see any lying snowfall, particularly during the first half of the month, with the mean temperature about 1C colder than average. Rainfall is likely to be above average.
Mean: 4.1°C (5.2°C 1981-2010 average)
Rainfall: 63.8mm (53.2mm 1981-2010 average)

February looks wet and mild overall.
Mean: 6°C (5.3°C 1981-2010 average)
Rainfall: 55.6mm (39.2mm 1981-2010 average)

Overall the mean for winter: 5.3°C, a little below average.
And rainfall about 120 per cent higher than average.

Looking in closer detail reveals that the coldest period is most likely to be between 13th and 19th January, with anomalies sufficiently low enough for lasting lying snow.

The extremes that no-one can forecast

As well as the extreme December 2015 the analogues also revealed the severe season of 1822-23 which saw ice on the Thames by late December. February 8th saw a great snowstorm in northern England where people had to tunnel through the snow.

Another was 1950-51 which was very snowy at high levels. There were 102 days of lying snow at Dalwhinnie (1000ft), exceeding the 83 days set in 1946-47. December 15th saw 15in of snow in Shanklin, Isle of Wight in 3.5 hours.

Hours of frost

Frost is a rare beast this year, even in the Wanstead Park frost hollow.

So far this year I’ve recorded just 82.5 hours where temperatures at 4ft (1.2m) were -0.1C or below. That’s just 37 per cent of what is recorded in an average year. And would suggest that frosts in December will be above average.

The lack of frost this year is even more remarkable given that the past seven years, especially the winters, have been so mild.

A closer look at the data shows that winter months are no guarantee of seeing temperatures fall below freezing. The record mild December 2015 and February 2014 are testament to that.

The fact that January 2017 looks the most remarkable month for frost reveals just how mild recent years have been.

Record rainfall in October 2020

The wettest October since at least 1797 was recorded last month with some 159.2mm collected, 238 per cent of average.

The month started wet with the daily October rainfall record also broken with 49.1mm on the 2nd, the wettest day ever recorded in the UK.

With all that rain sunshine was at a premium; the 51.6hrs recorded was the second lowest October total since 1881. Only 1894 was duller.

The monthly mean was 11.7C, 0.1C below average.

Does any of the above have any bearing on what we can expect this winter? Possibly, but there are so many variables to consider.

Looking at rainfall patterns alone would suggest mean temperatures in November being a degree cooler than average and December broadly average.

Rainfall in November average while December is slightly below.

Two warm April days 128 years apart

The synoptic pattern on Sunday, April 5th, was very similar to the pattern on Tuesday, April 5th 1892.

With so few planes in the sky because of the coronavirus lockdown it offered an ideal opportunity to compare temperatures and sunshine totals between now and then.

Sunday dawned sunny and clear and stayed that way until dusk, some 11 hours of sunshine recorded, exactly the same as 1892!

The temperature in Wanstead reached 22.3C, 0.9C cooler than what was recorded at the Royal Observatory, Greenwich, in 1892. This maximum was reached after an overnight minima of 5.3C, the same as the 41.5F recorded at Greenwich all those years ago.

Looking further afield, and at the spell over 3 days… markmpcc

4th

5thww

6th


London’s colder than average months

Last November was on the cold side prompting me to investigate whether we were about to record a third month in a row below average. December turned out to be mild and wet, the lack of snow especially stark in Scotland.

The findings of that study showed that any sustained period of colder than average months was more likely to happen during months of March, April and May, nothing unusual there, especially considering H.H Lamb’s weather types.

I decided to scrutinise further all the colder than average months in this area, considering the 1981-2010 average, back to 1981. This gave the below results.

neg anoms

The dataset covers 399 months, of which 200 were colder than average.

The overall picture shows that negative anomalies are becoming more and more rare, though with notable exceptions being March 2013, December 2010 and January 2010.

The only month that has showed any sort of consistent general decrease in negative anomaly is November.

*For good snowfall at this station needs a negative anomaly of 2C during the months of November, December, January and February.

Winter 2019/20 forecast review

For those interested my winter forecast this year was way out. A prediction of a mean of 4.7C was 2.3C too low. The chief culprit for the 7th mildest winter back to 1797 was most probably the strong polar vortex which has often been at record strength over the past three months.

Rainfall prediction was also over 100mm too low. The wettest winter for 25 years with 248.1mm recorded places it 13th in wettest winters. The only crumb of comfort I can take is that the stats indicated an uptick in precipitation in February! The 90.8mm recorded made it the wettest February for 10 years, just short of 2010. Before that you have to go back to 1951 to find a wetter February. It places 9th in wettest Februaries since 1797.

Over the past months I have looked into the method of seasonal prediction and found some interesting results. For example, the winter of 1989/90 – a winter that was very similar to this one – led to a prediction that was 2.7C too low. Similarly the winter of 2013/14 was predicted 2C too low.

Rainfall looks to be far more random. Though it is obvious that we are now in a wetter than average spell experience shows that it is impossible to tell how long this will last.

Pattern matching and singuarities can be helpful in long distance forecasting. The spanner in the works, however, can be a sharply positive or negative ENSO (El Nino / La Nina) or, as in this year, a very strong polar vortex.

You can find the original forecast here.

anom
The coldest anomaly was at the start of winter.


The relentless wind

Damage from Storm Ciara was a lot less notable than further north though the relentless wind saw three records broken locally. Though the gusts were nothing like the St Jude storm in October 2013 the sustained wind blew at its greatest 1, 2 and 3-day rate since this particular automatic station was reset in November 2012.

wind run

Over the 3 days the wind direction was locked in a south-westerly, from 199 to 203 degrees.

9th10th11th

Dynamic early final warming and spring

In my search for some winter weather a tweet by Amy H Butler about dynamic final warmings piqued my interest.

According to the atmospheric scientist a winter where there was no major disruptions of the polar vortex (SSW) we are more likely to see a dynamic early final warming. A table published by Wiley shows the final warming dates.

FW
* means there was a SSW, bold means late FW (after the mean date of April 15).

So what could this mean for the weather in the London area? Considering all the above years with no SSW gives an average date of April 19th for a dynamic final warming.

I then looked at the TMax anomaly for those years for 60 days following a DFW and came up with the following graph.

june cold

The results suggest temperatures in April will be heading down in the final week for a  cold end. The average to cool theme continues into May before temperatures lift in the final week for a warm end, with anomalies up to 5C above average. June, however, looks shocking with temperatures nearly 6C below average by the 16th.

This winter has so far been very similar in type to 1990. The dynamic final warming that year was among the latest in the list and led to a cool and dull June with anomalies in the second week nearly 7C below average!

1990