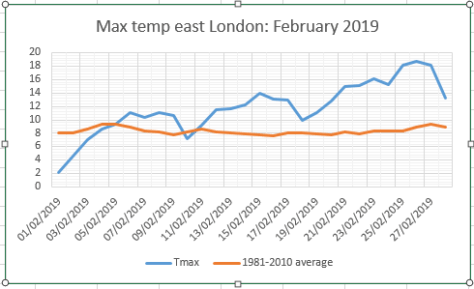
February was most notable for how mild daytime temperatures were in comparison with night-time.
The 27th and 26th saw diurnal ranges of 19.4C and 19.3C respectively, the highest range recorded in any February since 1959, helped by huge temperature anomalies brought by the synoptic conditions. Although the UK maximun temperature record for February was broken with Kew Gardens reaching 21.2C the February TMax record in Wanstead, 19.7C set in 1998 remained intact.
The mean temperature finished 7C, 1.7C above average, the mildest February for 5 years.
Some 33.7mm of precipitation was recorded, 86 per cent of the 1981-2010 average, about the same as last year.
Some 124.6 hours of sunshine were recorded, that’s 170 per cent of average, the sunniest February for 11 years.
Ten air frosts were recorded.
There was one day where snow fell and one day of snow lying, 1cm on 1st.
With the return of more seasonal temperatures February 2019’s heatwave already seems like a distant memory.
Looking back at the stats for this area the past eight days have seen an average anomaly of 7.7C, beating the previous eight-day long warm spell of December 2015, which returned a mean anomaly of 7C. That spell was quickly followed six-day long warm spell that had a mean anomaly of 6.6C. There appears no chance of the heat returning any time soon.
Wanstead missed out on breaking the February high temperature record. While Kew Gardens recorded a high of 21.2C, the local area reached just 18.7C, falling short of the record of 19.7C set in 1998.
St James’s Park, our closest official climate station, set a new top 3 of TMax values. , as did Heathrow.
The erratic onset of spring in some years often presents that problem of what to wear every morning. During the current warm spell I’ve seen all manner of attire on the school run; everything from T-shirt and shorts to full winter regalia topped off with hat and gloves.
The position of the sun is now bringing in to range the season when the gap in temperature between day and night can be at its greatest.
On Saturday (23/2), virtually unbroken sunshine and ‘thick’ air saw the temperature in Wanstead peak at 16.1C before clear conditions overnight saw the minimum plunge to just 0.2C. The gap of 15.9C represents the fourth highest diurnal temperature range for February in this area back to 1959.
Top 10 February diurnal temp ranges
Looking at the year as a whole the greatest range is 20.8C with the months of May and June the most likely to see the condition.
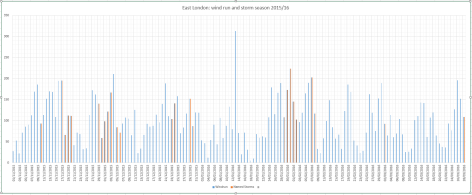
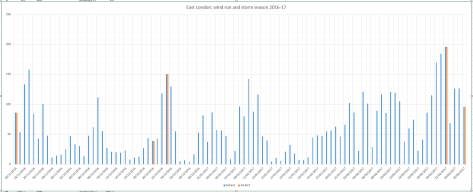
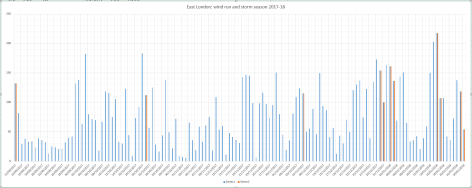
Since the Met Office introduced its system of naming storms at the beginning of the autumn season in 2015 the effects felt in the capital have been fairly limited.
Introduced partly in response to the devastation caused by the St Jude Storm in October 2013 every wind storm since has failed to live up to the hype, at least at a local scale.
This tree at the side of the road in Woodford Green was a victim of the St Jude Storm in 2013
Of course many storms have caused major disruption elsewhere, not least Storm Desmond, floods from which devastated Glenridding in the Lake District.
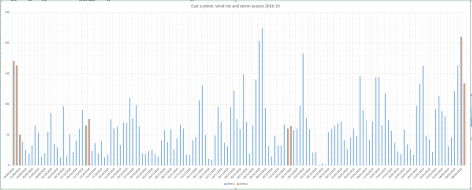
But closer to home many of these storms have been marked simply by a higher than average ‘wind run’, the number of revolutions of this weather station’s anemometer.
The windiest days in this locality coincided with Storms Gertrude, Fionn and Erik but these were minnows compared with St Jude and the most recent devastating storm in living memory, the Great Storm of 1987.
The graphs below also highlight the ongoing problem of naming storms in that some of the windiest days in this area occurred when there was no named storm.
The windiest day in the dataset was June 6th 2017 when a low pressure system saw Force 9 winds recorded in the Channel. Locally the day was very blustery and trees that were in full leaf were blown down.
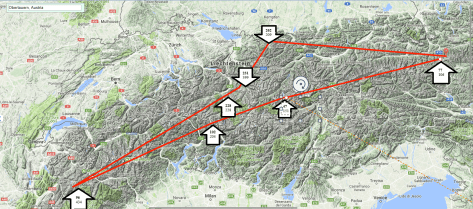
Earlier this winter there were many reports on how good snowfall had been in Austria. But on closer inspection it was clear that the weather pattern at that time only favoured certain resorts.
In contrast with last year the totals I’ve used in my cross section of the range don’t look that exciting; Bourg-St-Maurice, the jumping off point for Savoie resorts including Les Arcs and Val d’Isere, has recorded 96mm of precipitation this season, in stark contrast to the 433mm it recorded last season between Christmas Day and February 5th.
In Switzerland Arosa, a resort well placed to pick up snow from any direction, has recorded the same this season as last. Totals in Davos are well down on last season. Similarly San Bernardino has recorded about half the amount of precipitation than it did last season. Its location toward the southern side of the range has been sheltered from the prevailing winds this year. That said it did enjoy a big dump last week.
Going further south and east St Vallentin in Italy has recorded about a third what it did at this stage last season.
Mean temperatures overall are about 2C to 3C lower than they were last season.
30-day precipitation totals reveal that Bourg St Maurice recorded just 96mm, compared with last year’s 433mm while Obertauern in the east recorded 77mm, compared with 106mm the same period last year
It is 21 years ago this month that London and most of the southern half of the UK experienced a remarkably warm spell of weather during what had been a mild winter.
The spell, which saw the record warmest February day on the 13th (19.7C), satisfies the Met Office’s old criteria of a heatwave whereby the maximum temperature is 5C or more above average for five consecutive days.
While these spells are fairly common in summer they are very rare during a meteorological winter. During the last 60 years the only other periods to have experienced a heatwave in winter are December 1966 and 2015.
Weather charts for this week look remarkably similar though, according to the latest forecasts, values will be nothing like they were in 1998.
Since this was published this 2019 spell has satisfied the Met Office criteria. But the anomalies are not yet as impressive as 1998.
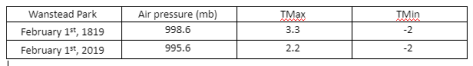
During a miserably cold and wet stroll around the golf course in Wanstead Park I happened upon the remains of Wanstead House – basically a deep excavation where the basement and kitchens once were.
As a freezing cold mixture of rain, sleet and snow fell, gradually thawing the remnants of last night’s snow, I wondered what the weather was like when this magnificent building last stood. Luke Howard’s entry in The Climate of London revealed that the weather on this day 200 years ago was remarkably similar.
Wanstead House around 1819 just before its destruction
February 1st 2019
As I stood and tried to imagine what the house must have looked like it occurred to me that 200 years is a mere blip in time in the history of the Earth. People come and go, buildings rise and fall but the weather goes on and on.
* There’s a fascinating extract on Wanstead from James Dugdale’s The New
British Traveller (1819) that you can find here.
** This video clip shows the site where Wanstead House once stood.
My winter forecast went a bit awry in December – I predicted a mean of +0.8C, the outcome was +1.7C. January has been much better, I predicted -1.2C, the outcome is -1.1C! Also… “And another cold spell end of January into the first week of February?”
For February I predicted a mean of -1.7C. The current pattern to continue and signs on the EC of a more robust cold spell with air supplied by a Scandinavian high?
More than three weeks have now past since the polar vortex split on January 1st.
London’s weather has turned colder and there’s even been a (small) fall of snow but the negative anomalies recorded so far are less than those experienced during the ‘Beast from the East‘ events last March.
In the graph below I have plotted the mean anomalies since the day of the PV split against the mean anomalies recorded from the day of the PV split in February 2018.
The effect this year is much less pronouced so far: over the last 24 days the average mean anomaly has been -0.7C, compared with -2.1C last February/ March.
The NOAA anomaly map for the week of January 13th-19th shows much of NW Europe has experienced a positive anomaly with any serious cold restricted to Norway and Sweden and Greece.
It has been mentioned that the variables with this SSW are very similar to 2004. Using the anomalies generated after the 2004 event resulted in the graphic below.
Taking it at face value would suggest that two more snow events could be possible at the beginning and middle of February – a cold but not severe pattern currently reflected in the models – but forget any repeat of last year’s Beast from the East.
Five years ago I blogged about the lack of snow at the midway point through winter. This winter there has been a similar total lack of snowfall though this time it is benign anticyclonic conditions that have characterised the past 45 days rather than the raging zonality of the winter of 2013/14 which ended completely snowless in this area.
A look at the statistics reveals that the midway point of winter is the mildest for 3 years and the 6th mildest since 1960. There has also been around half the rainfall that we had to this point in 2018. Sunshine is similar and below average.
Since December 1st, Wanstead has recorded just 7 air frosts – 5 fewer than last year. The coldest night was just -2.5C. The current mean temperature this winter to January 14th is 6.9C with rainfall 60.6mm.
Further scrutiny of stats for the Wanstead area reveal few years were similar to this winter. Using my method for finding patterns stretching back over 50 years to forecast this winter I picked out years that were +/- 10% of the 2018/19 rainfall total. From these I then weeded out the seasons where the mean was within +/- 10% of the this year. This gave a list of three winters with similar temperature and rainfall.
The other winters weren’t anything special with ‘snow lying’ days below the median for this area of six.
Snow go: just patches of snow were visible on the upper runs of Nevis Range at the weekend on Jan 12th
As I write there are signs that the weather is going to turn colder this week. Whether it will be cold enough for snow remains to be seen though the ECM model is hinting at a rise in pressure around Greenland. A situation that *could* be conducive for something colder long term.
In summary, the probability at this point of at least one fall of snow before the end of February could be put at 100 per cent. Whether it will be abundant or merely a dusting is impossible to tell.
Elsewhere in the UK it has been similarly lacking in snow. During a visit to Fort William at the weekend locals told me that there has been no significant snow since October / November and that even frosts were few and far between. The lifts around Nevis Range looked forlorn against a green backdrop. And it wasn’t until I got to the summit of Ben Nevis and Aonach Mor that I saw any of the white stuff.


You must be logged in to post a comment.