
The climate of London can vary greatly to figures revealed in the Central England Temperature series. Because this dataset covers an area of the UK enclosed by Lancashire, London and Bristol the resulting monthly mean temperature can often be quite a bit lower than what is experienced in the capital.
Though these anomalies are smoothed in the monthly series that stretches back to 1659 notable daily extremes that happen nationwide tend to get lost. One example was earlier this month when the UK’s November maximum temperature record was broken. Trawsgoed in Wales reached 22.4C on the afternoon of the 1st whereas a largely foggy east London recorded just 11.5C.
Comparing CET with data from Greenwich back to 1850 reveals a gradual decoupling between the two series, the warmth of London’s urban heat island effect an ever-growing influence.
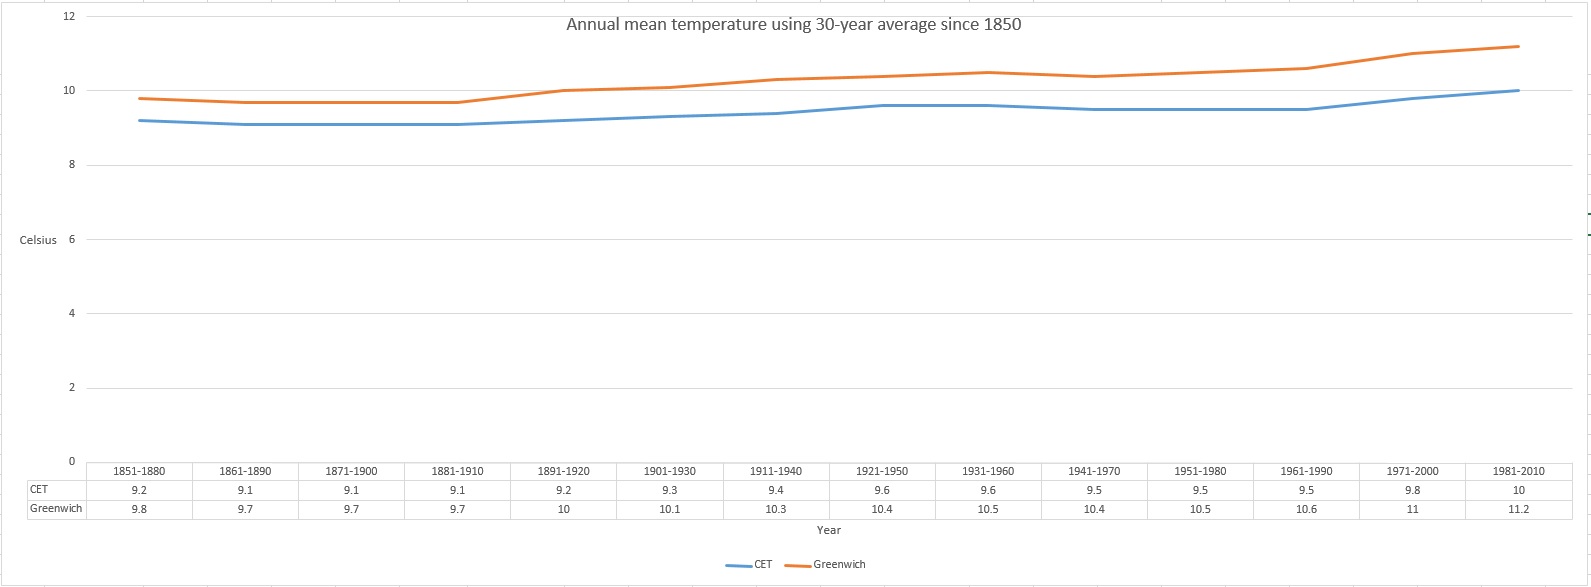
The 1851-1880 30-year average means show that Greenwich was 0.6C warmer than the CET series. By 1981-2010 this gap had widened to 1.2C – indeed the London series is today 1.4C warmer than it was in 1851-80 whereas CET has warmed by only 0.6C.
Delving further into the data reveals an increase in the number of times that the 30-year average mean is being breached by at least 1.1C. The period 1961-90 was the warmest in both cases with the mean being breached by 1.1C or more on four occasions in the case of CET and five in London. It is interesting to note, however, that the largest anomaly in the CET series is 1.3C in 1921, greater, albeit by only 0.1C, than the warm years of 1990 and 1999.
The largest anomaly in London, 1.6C, was set in 2011, 0.1C higher than 1999, 1997 and 1989.
The graph below shows the number of occasions that the 30-year average has been exceeded in each period by 1.1C or more. With 1961-90 being so warm it appears that CET warming has slowed though it should be borne in mind that we have another five years before the 1991-20 series can be released.

With reference to the London graph below showing the number of occasions that the 30-year average has been exceeded in each period by 1.1C or more merely confirms that the level of the anomalies have increased but, as already mentioned, there are probably far more outside influences affecting the outcome such as UHI, population growth, further industrialisation etc.
The accelerated warming is a worry in terms of how London would adapt should summer temperatures greatly increase, though, of course, it remains to be seen if the anomalies will advance even further from current levels.
Global temperatures are on the rise though our part of the globe may not be as adversely affected as elsewhere.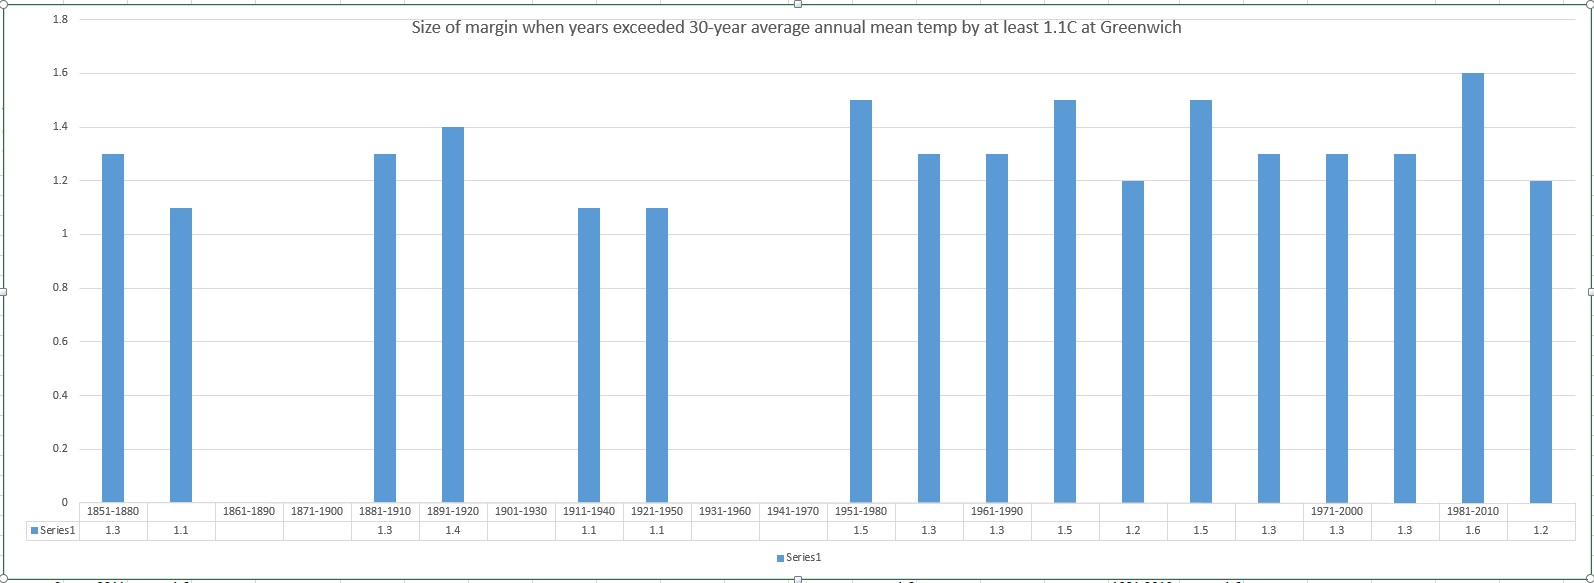 * The CET dataset is the longest instrumental record of temperature in the world. The mean, minimum and maximum datasets are updated monthly, with data for a month usually available by the 3rd of the next month. A provisional CET value for the current month is calculated on a daily basis. The mean daily data series begins in 1772 and the mean monthly data in 1659. Mean maximum and minimum daily and monthly data are also available, beginning in 1878.
For more information on CET follow this link.
