Tag Archives: wanstead

November: an Indian summer before turning cold?

With the mean temperature of both October and September finishing 0.2C below average it is probably safe to say that the weather is in an average kind of mood.

Conditions during the first part of November look changeable, according to the Met Office’s 30-day forecast . After mid month, however, the agency says the forecast is uncertain.

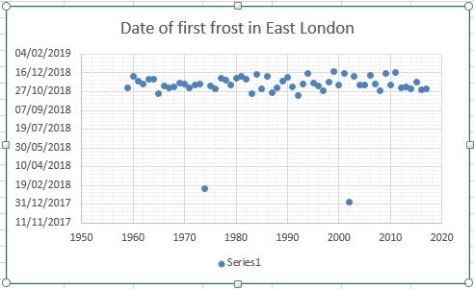
Now that much of the UK has had its first frost any warm spell in November will, correctly, be called an Indian summer. A singularity called the St Martin’s Summer occurs in 66 per cent of years, occurring between 15th and 21st and peaking on the 18th.

And, as if by magic, the GFS model today has this chart for the 16th, an Atlantic ridge of high pressure with daytime temperatures about 6C to 8C above average. Though warm during the day I would imagine there being a risk of fog forming at night

16th

Beyond that there could be a tendency for much more unsettled weather at the end of the month. The early December storms singularity occurs in 98 per cent of years, starting between November 24th and December 14th, often peaking on December 9th.

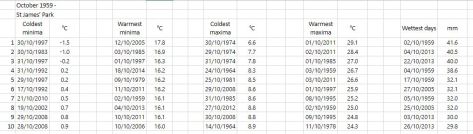
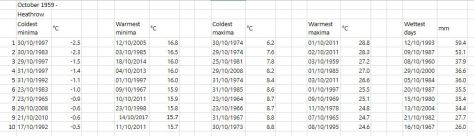
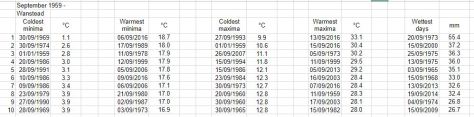
November, the last autumn month, can often surprise with its extremes, though it can also often be characterised by days of anticyclonic gloom. The warmest, coldest and wettest November conditions in London back to 1959 can be found here.


Perfectly average months are extremely rare

Readers of this blog know that I often described a month as fairly average – a look at local statistics shows that many months come in very close to the monthly mean.

But when you combine mean temperature with rainfall that is 100 per cent average it becomes very rare and non-existent with 100 per cent sunshine hours considered.

Of the 2650 months since 1797 just one, February 1972, saw a mean temperature and rainfall precisely average. However, sunshine hours were just 40 per cent of the 1981-2010 average.

To extend the data I included monthly rainfall totals that were between 90 per cent and 110 per cent of average. Even then just five more months were revealed: September 1806, February 1876, January 1883, October 1886 and March 1972.

Although on paper February 1972 was perfectly average a look at the weather for the month reveals typically variable weather. The website London Weather explains:

The maximum temperature was only 3C on the 1st as mild Atlantic air slowly displaced the very cold continental air eastwards. There were outbreaks of rain, and during the remainder of the first week, although mild, it was often dull and wet. During the second week, active frontal systems crossed the country bringing strong winds but with sunshine between the rain bands. After mid month, east winds returned, and although not cold, it was frequently dull.

Considering the Met Office forecast the mean for this month, October 2018, is set to finish precisely average. However, rainfall looks set to finish well under the average for the time of year.

First frosts in East London since 1959

Although many parts of the UK have already recorded their first air frost this part of the capital, being so built up and close to the City, remains frost free.

Although many may think that frosts are getting later a look back through local statistics to 1959 shows these events are very random.

The scatter graph below illustrates this.

first frost in east london a

Taking out the winters of 1974/75 and 2002/03, which didn’t see frosts until February and January respectively, the scatter can be seen better here.

first frost in east london b

The median for the first frost is November 6th with an average minimum of -1.4C.

October frosts can be a precursor to a mild winter much in the same way that heavy October snowfall in the Alps has lead to an awful season. But there are exceptions, as happened in 2008/09.

* To record an air frost the temperature must fall to -0.1C or lower.

September 2018: average, dry and sunny

September was most notable for the amount of cold nights. The record minimum was matched together with three further new entries into the top ten list of extremes back to 1959 – a rare occurrence.

The mean temperature finished 15.2C, 0.2C below average, ending a run of 5 months where the mean has been, at times, well above average.

Some 32.6mm of rainfall was recorded, 63 per cent of the 1981-2010 average. Some 183 hours of sunshine were recorded, 132 per cent of average and more than August!

For the first time in years the autumnal equinox period was very stormy, as shown by this graph.

wind run

To view full stats follow this link:http://1drv.ms/1kiTuzv

Summary for September 2018 to follow…


London’s October extremes since 1959

October is one of those months that can see both ends of the spectrum; from calm ‘mists and mellow fruitfulness’ and, rarely, frost, to wet and wild systems whistling in off the Atlantic, best known being the 1987 Great Storm and, more recently, the St Jude storm.

I’ve put together a few top 10s of stats for Wanstead, St James’s Park and Heathrow for the month of October.

october extremes

October SJP

Heathrow oct

Some national UK October values according to TORRO

Hottest: 29.4C March, Cambs – 1st 1985
Coldest: -11C Dalwhinnie 28th 1948
Wettest: 208.3mm Loch Avoich 11th 1916

In terms of climatology October maxima, considering the 1981-2010 average, shows a decline through the month, though around the 8th and 20th there is often a spike. This would reflect the October singularities; early October storms, between 5th and 12th, peaking on the 9th, occur in 67 per cent of years. St Luke’s summer, between 16th and 20th, peaking on 19th, also has a 67 per cent probability.
Mid-autumn storms occur between 24th and 29th October, with a 100% probability.

october average graph

The average rainfall graphic shows that downpour amounts are variable through the month. A tendency for dry weather around the 17th and 18th before the wettest days on the 20th and 21st.

October rainfall


The disappearing street trees of Wanstead

Street trees around Wanstead and the surrounding area have been disappearing at an alarming rate over the last few years. But it is not just the council’s technical policy of removing mature specimens that is to blame.

Changing rainfall patterns and poor husbandry have both contributed to the loss of some of the magnificent trees that once graced our roads and avenues.

A huge horse chestnut that once stood outside Wanstead High School first showed signs of distress in 2011. By 2017 it was completely dead and has since been chopped down.

One of the large limes on St Mary’s Avenue was a picture of health in 2015 but within two years it was completely dead and has also since been chopped down.

A huge old beech in the front garden of a property in Blake Hall Road was showing signs of distress in 2017 and came crashing down in 60mph winds from Storm Fion in January 2018.

Yet another huge old beech that stood proud in a front garden of St Mary’s Avenue has been dying since 2012. The second image reveals very thin foliage in summer 2017. The tree was chopped down a couple of weeks ago as it was clearly dead and posed an obvious safety risk, given what happened to the beech in Blake Hall Road in January this year.

The mature trees of Christchurch Green took a real hammering during the St Jude Storm in October 2013, among those lost were three gorgeous old limes. New trees have been planted but they will take decades to match the size of those lost.

Of course the loss of these trees and other could be attributed to bad luck and coincidence that many are reaching the end of their lives at the same time.

As a country we get a bit hung up on cutting trees down – in the near continent they are much more pragmatic and proactive through planning over a period of years in getting trees in the ground. So that when trees do die there’s not such a huge gap left in roads and parks.

On tree basesaying this there also needs to be more joined up thinking by councils in terms of looking after the existing tree stock. Far too many trees suffer because contractors are inconsistent with road and pavement repairs. Ideally the base of trees should have space for mulch to be applied but, too often, Tarmac is applied right up to the base.

Have you noticed mature trees dying suddenly recently? Please reply to this blog and I will add them.


When did September become a summer month?

The answer is around 1993. A look back at mean temperature and rainfall statistics for east London over the past hundred years reveals that the ninth month has, since that date, slowly become warmer and drier.

Putting all the arguments of meteorological and astronomical summer aside, many people of a certain age regard September as an autumnal month, but as recent years have shown it can very often be an extension of summer; September 2016 was the second warmest on record in the local area, warmer than many previous summer months!

Looking back even further, over the past 100 years, the September mean has trended upward, though many peaks and troughs reveal how the month has ebbed and flowed from being summery to autumnal.

The prognosis to the end of this month suggests that air pressure will be anomalously high – so the pattern in the south-east for settled, summery weather in September doesn’t look like ending any time soon.

sept means
The September mean trend has crept generally upward.
sept rainfall
A look at rainfall back over the last 100 years shows that wet Septembers have been on a general decline since 1994.

sept chart.gif

London’s September extremes since 1959

September in recent years has often been a more summery month than August. But this month in some years can see a rapid onset of autumn.

I’ve put together a few top 10s of stats for Wanstead, St James’s Park and Heathrow for the month of September.

september extremes

SJP september

heathrow sept

Some national UK September values according to TORRO

Hottest: 35.6C Bawtry, South Yorkshire – 2nd 1906
Coldest: -4.5C Dalwhinnie, Highland, – 26th 1942
Wettest: 190.7mm West Stourmouth, Kent – 20th 1973

In terms of climatology September maxima, considering the 1981-2010 average, shows a slight decrease through the month, though around the 1st and the 22nd there is often a spike. This would reflect the September singularities; early September warmth occurs in 82 per cent of years while the ‘Old Wives Summer’ has a 64 per cent probability.

september mean


The average rainfall graphic shows that downpour amounts are variable through the month. A tendency for dry weather to the 8th prevails before the trend increases, the wettest days usually 13th and 19th.

sept rain


August 2018: average temps, rain, sun

August was a big let down in a summer that saw the mean temperature nationally match the UK’s best-ever summers.

summer max 2018
Summer maxima took a real dip during the first week of August

The mean temperature finished 18.9C, 0.7C above average.

Some 69.5mm of rainfall was recorded, 139 per cent of the 1981-2010 average. Some 169 hours of sunshine were recorded, 87 per cent of average. Apart from being 1.5C warmer than average it was a carbon copy of last August.

To view full stats follow this link:http://1drv.ms/1kiTuzv

Summary for August 2018

Temperature (°C):
Mean (1 minute)  18.8
Mean (min+max)   18.9
Mean Minimum     13.8
Mean Maximum     24.3
Minimum          6.9 day 10
Maximum          33.1 day 03
Highest Minimum  19.1 day 03
Lowest Maximum   17.0 day 09
Air frosts       0
Rainfall (mm):
Total for month  69.5
Wettest day      13.6 day 16
High rain rate   48.3 day 10
Rain days        14
Dry days         17
Wind (mph):
Highest Gust     22.8 day 24
Average Speed    2.5
Wind Run         1841.7 miles
Gale days        0
Pressure (mb):
Maximum          1025.1 day 31
Minimum          1001.3 day 26
Total hours of sunshine        169


Summer 2018: second hottest since 1797

The results are in and statistics show that this summer was the second hottest in a local record going back to 1797. The mean temperature of 19.57C was 2.4C warmer than average, just six hundredths of a degree cooler than the summer of 2003.

A sustained period of heat that continued the theme of the hot late spring was enough to see a new entry into the hottest-ever list of heatwaves.  But the hottest weather was over by the end of July, August being very disappointing compared with the first two months of summer.

It was also the driest summer for 15 years. Just 87mm were recorded, that’s 60 per cent of average and just 7mm wetter than the historic summer of 2003, the year the UK’s highest temperature record was set.

It was the sunniest summer for 5 years: 663 hours of sunshine were recorded, over 100 hours less than 1976, the 24th sunniest summer since 1881.

Hottest day: 34.7C (26/7)
Coolest day: 17C (9/8)
Warmest night: 19.7C (26/7)
Coolest night: 6.4C (12/6)
Wettest day: 13.9mm (16/8)

summer max 2018

summer 2018 rain

Summary for period 01/06/2018 to 31/08/2018

Temperature (°C):
Mean (1 minute)  19.4
Mean (min+max)   19.6
Mean Minimum     13.7
Mean Maximum     25.5
Minimum          6.4 on 12/06/2018
Maximum          34.7 on 26/07/2018
Highest Minimum  19.7 on 26/07/2018
Lowest Maximum   17.0 on 09/08/2018
Air frosts       0
Rainfall (mm):
Total for period 86.9
Wettest day      13.9 on 16/08/2018
High rain rate   48.3 day 10/08/2018
Rain days        19
Dry days         73
Wind (mph):
Highest Gust     22.8 on 24/08/2018
Average Speed    2.6
Wind Run         5714.2 miles
Gale days        0
Pressure (mb):
Maximum          1029.9 on 21/06/2018
Minimum          1001.3 on 26/08/2018