Posts about thunderstorms are usually few and far between – the average number of thunderstorms in this part of the UK in a summer month (July) is just 3.5.
So experiencing four in four days must be very rare; the record for thunderstorms in a month is 12 in June 1982 though I’ve no idea how many of these were on consecutive days.
While the storms over the weekend were all about lightning this one was all about rain and loud thunder. Tuesday, May 29th, started cloudy and dull with some light rain. I was expecting some rain but it lingered and became heavier at 11.30am before turning torrential at 1pm, going against forecasts from BBC and Met Office – the trough was a lot further north than modelled. I pointed this out to the UKMO to be told that a yellow warning was in place for the whole SE region.
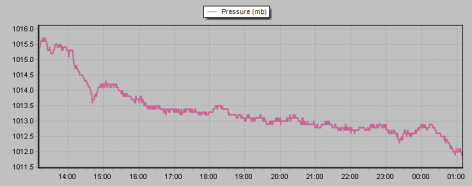
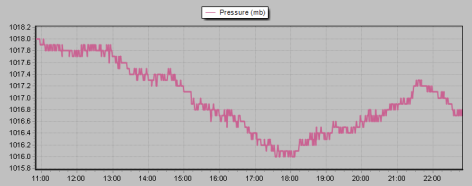
The bulk of the rain fell between 1pm and 2pmA marked drop in pressure coincided with a bright flash of lightning that was almost instantly followed by thunder that was as loud as cannon fire
Some 26.5mm fell in just over two hours bringing lots of surface water and flash floods around Leyton and Walthamstow. At 1pm, while driving in this area, a bright flash was quickly followed by cannon-like thunder. A further fall in the early hours brought the 09-09 total rainfall to 29.8mm, the 5th greatest May fall since 1959.
In the neighbouring borough of Barking and Dagenham it was reported that lightning struck a chimney which caused a fire in a terraced house in Rush Green at 2pm.
Local media pick up the story here, here and here.
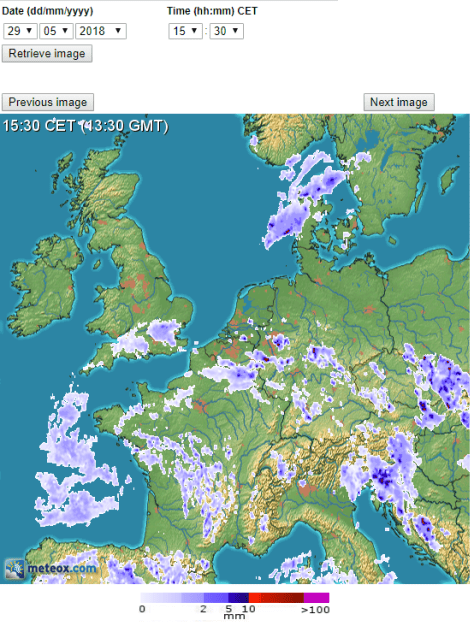
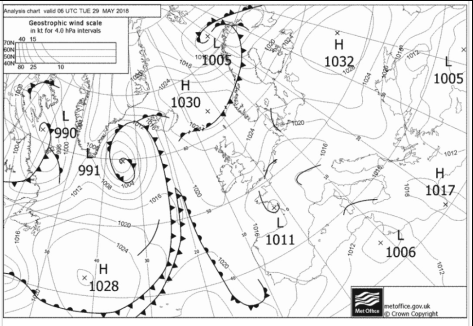
The position of the storm around the time of the loudest thunderSouth Access Road in Walthamstow suffered flash flooding as drains failed to cope with the volume of rainfallThe trough on this FAX chart suggested the heaviest rain would be slightly further south than it was
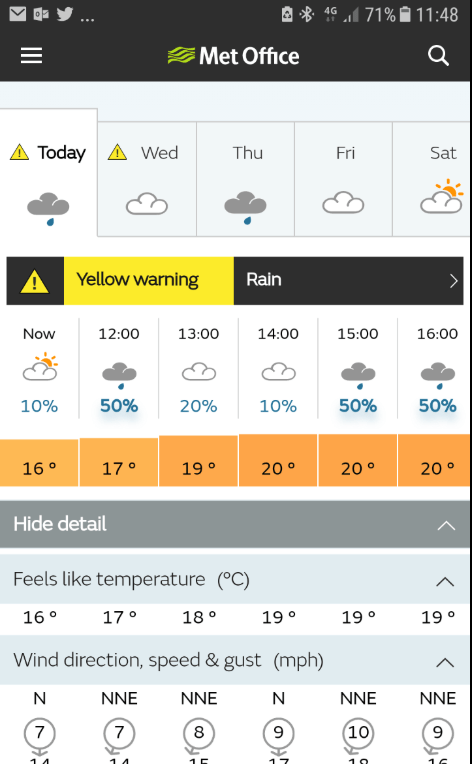
The Met Office forecast for Tuesday shows how useless auto generated apps can be, the 10-20% risk of rain between 1300-1400 contradicts the yellow warningPosted by Simon Cardy: “The large mature Cumulonimbus clouds over SE England (outlined purple on the map) are producing frequent lightning, very loud thunder and heavy rain. (credit: EUMETSAT).”
After the previous two days’ thunderstorm events it would be easy for this one to get lost in the ether. However, being super local and how quickly it developed and then died was enough to pique my interest.
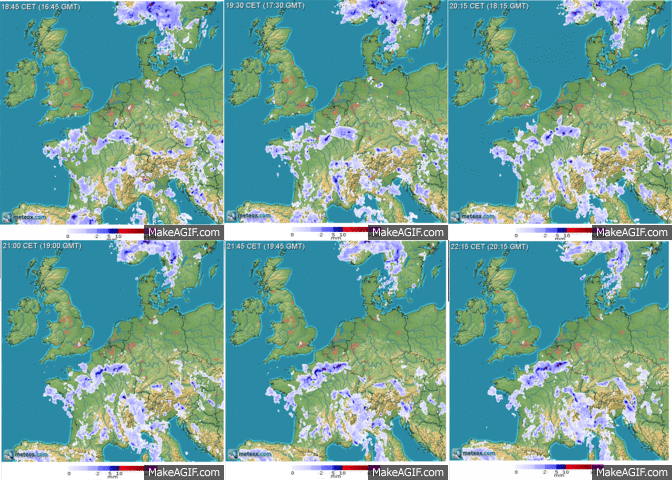
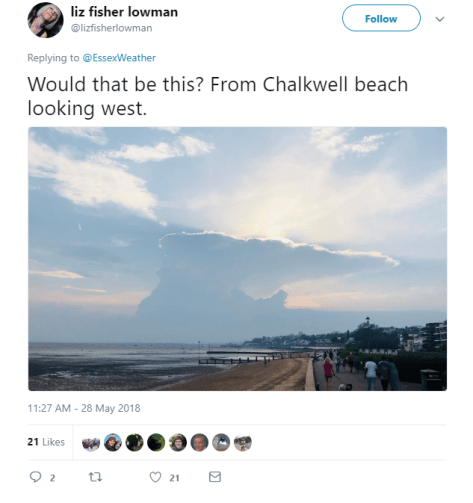
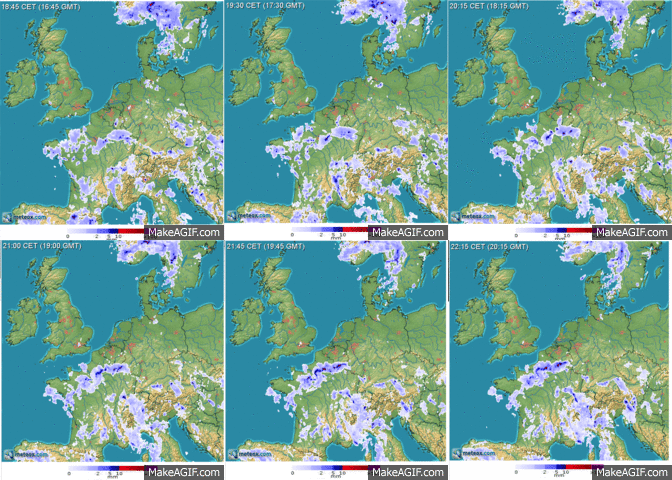
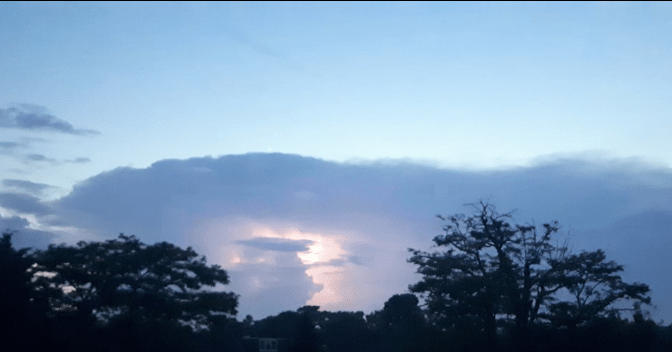
After a very warm and humid afternoon where the temperature peaked at 26.2C clouds began gathering to the east with the first rumbles of thunder at 6.45pm. The huge cumulonimbus could be seen from Southend.
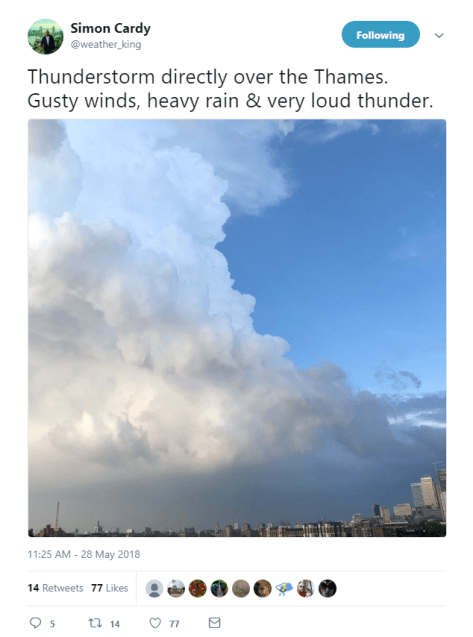
And Simon Cardy took an excellent shot from the other end of the Thames.
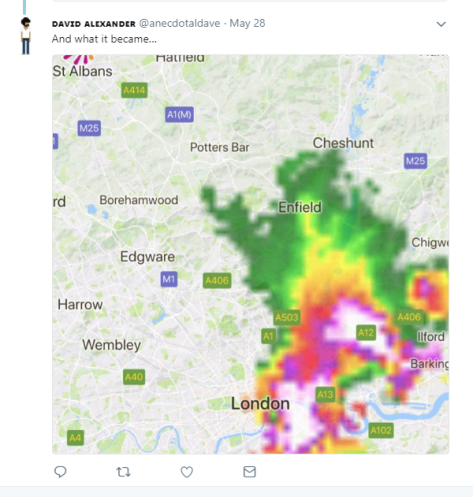
By 8.17pm the storm that had moved west had decayed markedly.
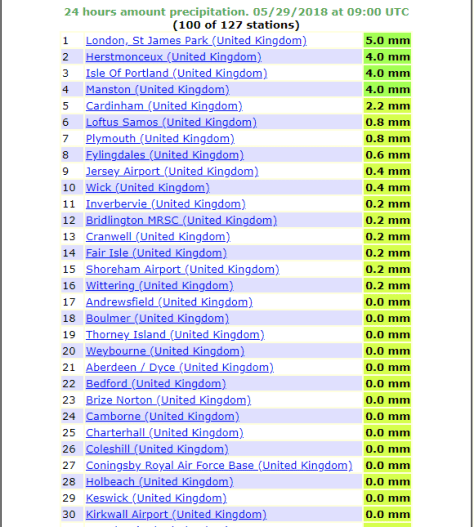
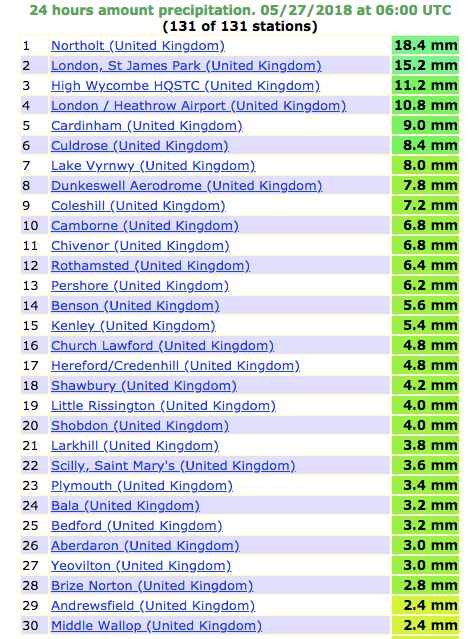
The 24hr rain totals at 09 on May 29th show how local the storm was. St James’s Park, 9 miles to the south-east, recorded half Wanstead’s total.
Timeline (BST)
1840 first peals of thunder heard
1847 first drops of rain
1856 downpour
1857 cloudburst
1901 16mm/hr 1.7mm
1903 very heavy
1909 burst of >5mm hail recorded. Rain rate 60.4mm/hr
1929 rain ceased (10.4mm in total)
Last night’s intense thunderstorm was probably most notable for its high-level sheet lightning than rainfall, thunder or fork lightning.
At my own station I recorded 4.8mm of rain which at its heaviest fell at a rate of 24.1mm/hr at 0046. To put that into perspective that’s just under a quarter of the rainfall rate during the thunderstorm at the beginning of last June. Rainfall in nearby Woodford Wells fell at a rate of 35.6mm/hr at 0040.
The rainfall was much heavier to the west of London.
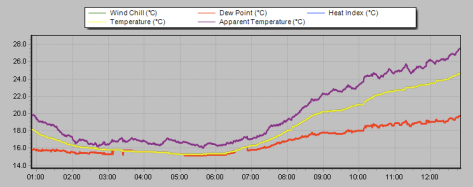
Also of note was how warm the night was. A low of 15.3C made it the 8th equal warmest May night since 1959.
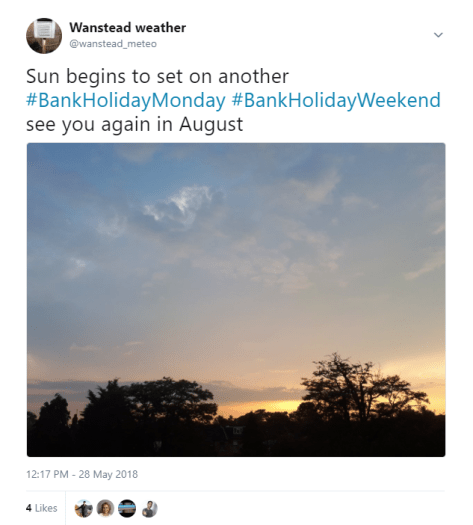
There’s probably going to be a few more storms this bank holiday weekend though it remains to be seen whether this is going to be a classic summer for storms.
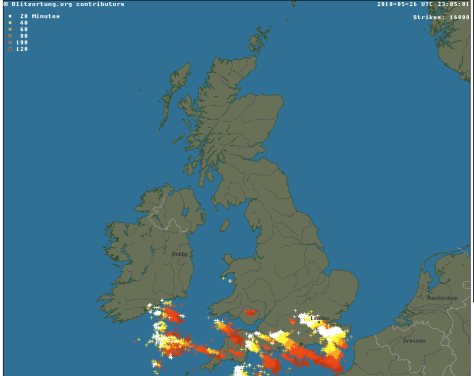
At it’s peak at 2305 there were 16800 strikes, according to Blitzortung.
Firefighters were called to a house fire after this house in Essex was struck by lightning overnight. Crews said the entire roof was alight pic.twitter.com/fUSt9jMSgN
The 27th was fairly quiet but with abundant sunshine and little wind it wasn’t long before more storms, this time homegrown, developed over the Midlands and the south. Severe flash flooding was reported in the Selly Oak area of Birmingham after a month’s worth of rain fell.
Reports of severe flash flooding across the city and beyond. This is the scene on Hubert Road in Selly Oak. Please only travel if it’s an emergency as the roads are becoming treacherous. (Video: Alexander Walters) pic.twitter.com/8gA0jjG03R
And as dusk approached a huge storm toward to the north-west of London and Chilterns. With little wind the storm stayed more or less in situ, expending all its energy with the most amazing lightshow – lightning within cloud that became more and more vivid as darkness approached.
Because these storms can reach heights of 29,000ft – roughly the height of Everest – they can be seen from over 40 miles away.
I had a go myself.
Not bad but the best footage I’ve seen was captured by Simon Cardy from east London and can be seen here.
Less than 24 hours after a spectacular lightning display, we have another one! pic.twitter.com/3qnZw9sIb3
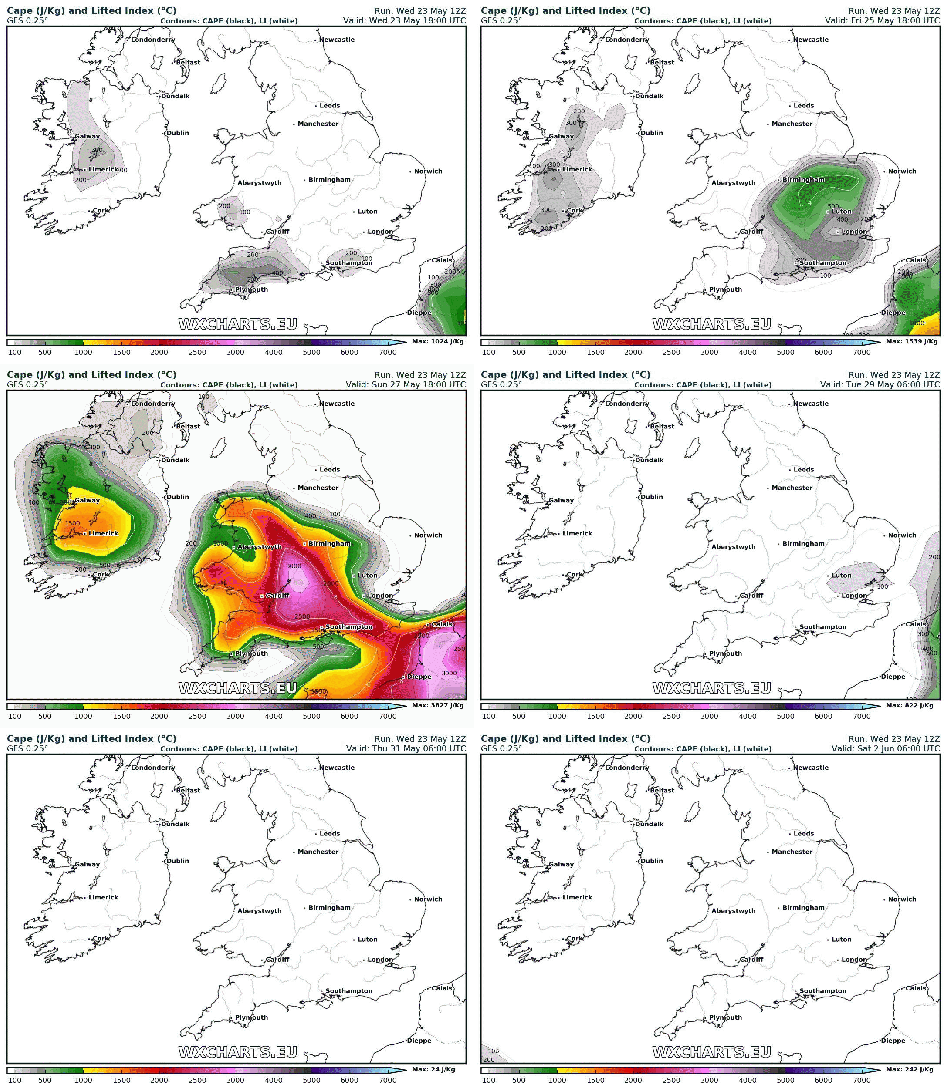
The coming bank holiday weekend is looking very warm, possibly hot on Monday. And with the heat comes the inevitable thunderstorms.
Looking at the CAPE forecast on @wxcharts the risk on Saturday looks like staying to the west of London. The best chance for east London looks like after noon on Sunday and Monday. There is no guarantee of thunderstorms here – some places could get hammered while just down the road it could stay dry – the potential is there.
Meteorologists will be keeping a close eye on Herstmonceux and Trappes ascents in the coming days.
Weather models are hinting that this coming bank holiday weekend could be very warm indeed, with one WX Charts animation suggesting that a positive anomaly of 12C could be possible on Monday.
A date record looks a formality and, unless there’s a downgrade, new monthly high temperature records at stations across the south-east look a possibility.
While it looks very warm it is too early to start talking about heatwaves. And, considering the pattern since late February, with hot and cold alternating weekly, a brief return to much cooler conditions at the beginning of June can’t be ruled out.
The British record high temperature for May is 32.8C, reached on two occasions:
Camden Square, London May 22nd 1922. The same station recorded this value again on May 29th 1944, along with Regents Park, Horsham and Tunbridge Wells.
The national date record for the 28th, according to TORRO, is 30.6C at Camden Square.
Locally the highest temperature recorded in this area in May is 32.1C on May 27th 2005. The date record I recorded is 26.5C in 2012.
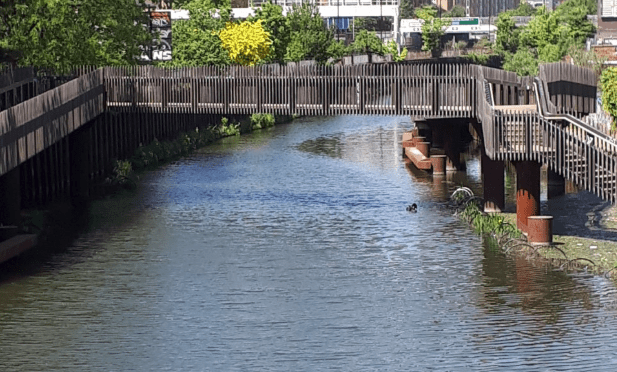
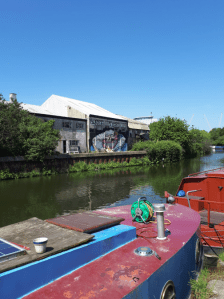
The tow paths along the river Lea have provided generations of Londoners a place to escape – the route coming into its own following the legacy of London 2012 and the creation of the Queen Elizabeth Olympic Park.
The river Lea near the Bow flyover is roughly where Luke Howard’s chemical factory was situated
It also provided a means for Luke Howard’s commute to work when he moved his family from Plaistow to Tottenham in 1812.
Seven years earlier Howard set up his pharmaceutical laboratory on the banks of the Lea in the area where Bow flyover now stands. From this vantage point, as the factory produced chemicals including quinine, Howard kept a meticulous record of the atmosphere later publishing results in The Climate of London, among the first texts to discuss urban meteorology.
Development in the region was in its infancy and it would be years before the river banks became covered by factories and warehouses, these now fast making way for luxury flats and restaurants.
The river is lined with canal boats, breweries, old factories, residential development and street art
I’ve often wondered what his journey to and from the factory was like so on Tuesday, tempted out by cloudless skies and a warm 23C I grabbed my bike and headed to the Olympic Park. Despite numerous visits I still got lost in the myriad paths in the park, turning into dead ends and finding myself on the ‘wrong side’ of canals.
Anyone familiar with Bow Flyover will know it’s not the most inspiring place; it probably represents the low point of the way north.
It was at this point in 1809 that Howard noted that the river had swelled to a width beyond a mile wide. Five years later Howard also noted how the Lea had become choked with ice following a bitterly cold winter, the year the last Thames’ Frost Fair was held.
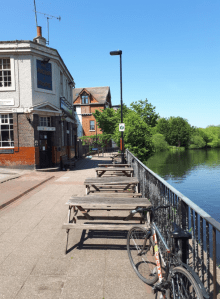
Anchor and Hope: a good spot to stop for a pint
As you ride north the familiar sites of the Olympic Park hove into view on the right while, if you look left, beyond the cacophony of the A12, the old Bryant & May match factory can be seen. Opened in 1861 the factory, which was one of the first east London renewal projects to feature luxury flats, is yet another landmark that simply wasn’t there in Howard’s time.
Just after Old Ford locks is a canal that turns left. This ‘cut’, called the Hertford union canal or Duckett’s canal, was in the process of being dug when in July 1829 lightning during a thunderstorm killed three workers. Howard, in one of many weather-based accounts in the The Climate of London, takes up the story:
A tremendous storm of thunder and lightning broke upon the metropolis about 1 o’clock on Saturday morning. The sky had been lighted up the whole evening by vivid electrical flashes and so late as half past twelve the stars were visible when a dark cloud suddenly arose and in a few minutes one of toe heaviest showers of rain and hail ever witnessed fell in torrents from its bosom.
Peals of thunder soon followed and continued rolling with scarcely any intermission for upwards of two hours accompanied with awful bursts of lightning; the residents of Bow, Stratford and Bromley were thrown into the greatest consternation by the violence of the storm, one poor fellow lost his life and two others have been so severely injured that but faint hopes are entertained of their recovery.
The three sufferers Sullivan, Salter and Fitzpatrick were engaged in excavating a canal, at present constructing by Sir George Duckett at Old Ford, and were at half past two o’clock diligently employed in their work when the storm commenced. Sullivan was at once struck lifeless and Fitzpatrick and Salter were so seriously injured as to make it necessary to procure immediate medical attendance.
Fitzpatrick was removed to his lodgings at Bow where he was attended by Dr Fairhead who on examining his person found that his left side had been most seriously injured and that there was reason to believe his intestines had suffered severely from the shock. The damage which Salter sustained has not been of so serious a nature.
Deaths caused by lightning were a much more common occurrence in the 19th century, mostly because so many people worked outside and the dangers of this natural phenomenon were not well document. The thunderstorm in July 1829 was particularly severe, as Howard continues:
During the continuance of the lightning on Friday evening a man who was employed in pumping in Bethnal Green fields which the late heavy rains have flooded was struck by a sudden flash which caused his instantaneous death.
The clothes exhibited a singular appearance being literally torn to atoms and every part of the metal in his buttons had the appearance of having been fused. The body itself showed no traces of the electric fluid with the exception of a slight mark on the forehead.
As you cycle on the factories / flats gradually thin out until you reach Lea Bridge Road when Leyton and Walthamstow Marshes become visible on the right. The big skies probably the same as they were during the 19th century. On reaching Tottenham Hale it is time to leave the river and turn left toward the town centre.
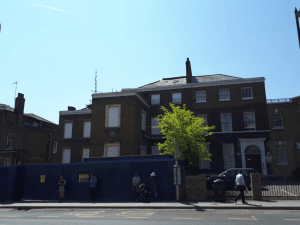
7 Bruce Grove, Tottenham.
A total of 6 miles later brings you to Howard’s family home, 7 Bruce Grove. It still stands but, despite having a blue plaque, is in a terrible state of repair – internal walls have collapsed and the roof is clearly porous. The owners have a plan to turn the building into flats but nothing has happened in years. A petition to save the building was set up a while ago but this, too, seems to have had little impact.
Howard and his family divided their time between here and Ackworth, Yorkshire. I’ve known about 7 Bruce Grove for years but I didn’t realise just how long the garden was, stretching back hundreds of feet.. It was here that Howard also kept a weather station and was the venue for his account of the partial solar eclipse in 1820.
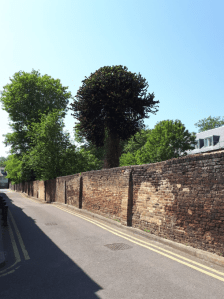
The monkey puzzle tree
There is precious little left of the original garden, it being overgrown with bramble, nettles and alder. I did notice a tall money puzzle tree which I wonder once had pride of place in one of the borders.
Because of the dense undergrowth and it being behind a large wall there is precious little you can see but I wonder if there is any evidence of Howard’s meteorological enclosure somewhere in the garden?
It would be a fitting tribute Luke Howard if any future development would allow the provision of a weather station somewhere on the property.
The rear of 7 Bruce Grove, Tottenham
Walthamstow Marshes were flooded to a depth so great that many trees briefly disappeared
It is 194 years ago this week that the River Lea burst its banks in the Stratford area leading to an ‘inland sea’ forming on nearby marshland.
Days of heavy rain that started on the 12th sent the water rising to record levels, the height was 2.5 inches higher than the devastating flood of 1809.
Luke Howard, in an entry in The Climate of London, had measured nearly three inches (74mm) of rain by the 16th and was expecting a flood:
“Towards evening the waters rose suddenly in the Lea and passing over all the banks of the level soon filled the marshes and in the course of the night rose to an unprecedented height being two inches and a half higher than in the flood of 1809.
The houses in the marshes south of the road were filled nearly to the chamber floors and some of the inmates removed with great difficulty. The flood remained stationary for nearly 24 hours. On the 17th in the afternoon it began very gradually to subside and on the 18th in the morning was much abated; the marshes still presenting the appearance of a sea the tops of the trees appearing in places only.”
Though there are no reanalysis charts from the time Howard’s daily entries state that pressure was low with the wind in the north-east, a classic pattern where depressions can move along the Channel before getting ‘stuck’ in the North Sea. A similar pattern with an almost identical amount of rain caused severe flooding in June 1903.
There was some 96mm of rain recorded during May 1824, locally the 11th wettest back to 1797. There have been wetter Mays since but, thanks to massive investment in the River Lea Navigation , prompted by more devastating floods in 1947, widespread flooding is a thing of the past.
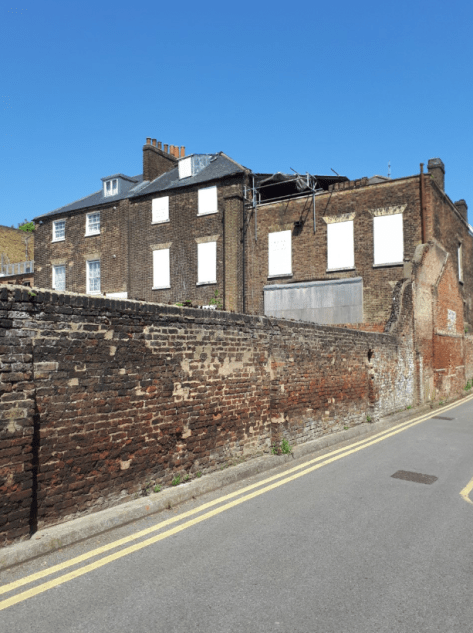
The area around where Luke Howard’s factory once stood
Walthamstow Marshes were flooded to a depth so great that many trees briefly disappeared
The media are up to their old tricks of flagging up their usual ‘hottest ever’ line; this time the May Day bank holiday.
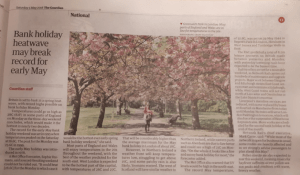
Today’s Guardian
Today’s Guardian informs readers that Monday could be the warmest ever May Day bank holiday, the quite unremarkable record high of 23.9C was set in 1999.
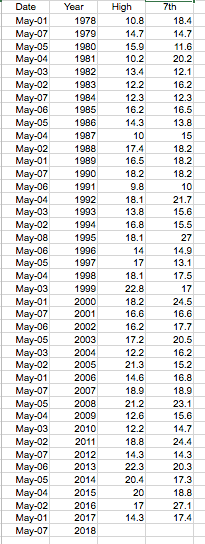
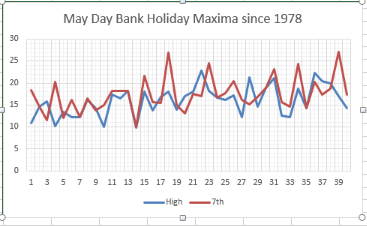
A closer look, however, reveals that dates of the holiday, which only began in 1978, are always moving. Like Easter the date shifts and can fall on any day between the 1st to the 8th. Only six early May bank holidays have occurred on the 7th. It is therefore difficult to compare like with like.
A more correct approach is to compare date records which, for the 7th since 1978, the highest is 27.1C in 2016. The highest temperature for the 7th going back 60 years is 28.5C in 1976.
Ne’er cast a clout till May is out. With the recent March and April weather being so variable it would be wise to bear in mind this old saying, especially with fine and warm weather forecast for the Bank Holiday weekend.
A look at local east London stats, however, shows that seven of the last 10 Mays have been warmer and drier than average.
I’ve put together a few top 10s of stats for Wanstead, St James’s Park and Heathrow for the month of April.
Probably most notable from the below values is that recent Mays have been devoid of extreme cool temperatures and rainfall.
With nights now relatively short air frosts are uncommon though the odd ground frost can still strike on a clear night.
Snow can fall in May – one example being 1979 in the higher parts of the capital – but after the first week it is extremely rare.
Rain is usually most frequent in the last week of the month.
This slideshow requires JavaScript.
Some UK May values according to TORRO
Hottest: 22nd 1922: 32.8C at Camden Square, London.
Coldest: 2nd 1917: -9.4C at Lynford, Norfolk
Wettest: 8th 1884: 172.2 at Seathwaite, Cumbria
In terms of climatology May maxima, considering the 1981-2010 average, shows a gradual increase through the month, though around the 25th there is often a brief dip before a warm end.
The average rainfall graphic reflects this, showing a three-day wetter spell after the 24th.
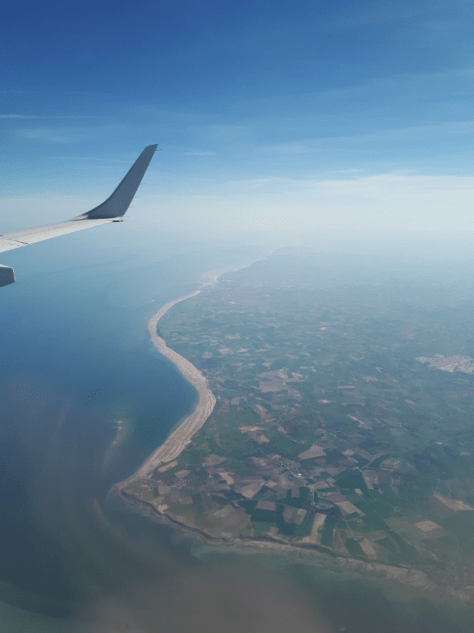
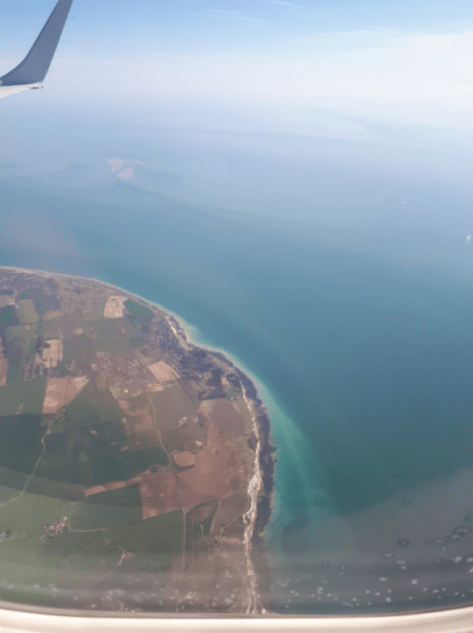
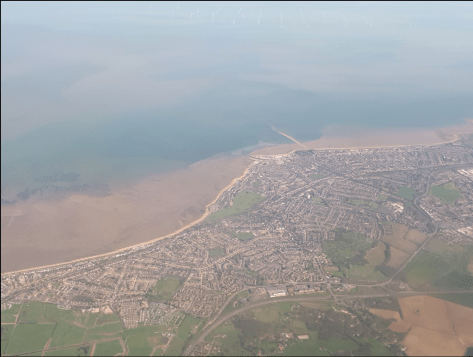
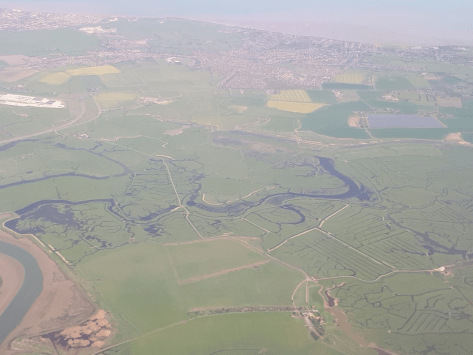
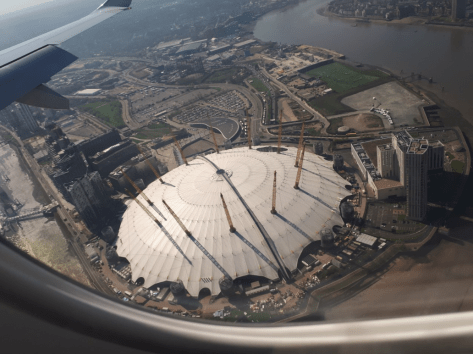
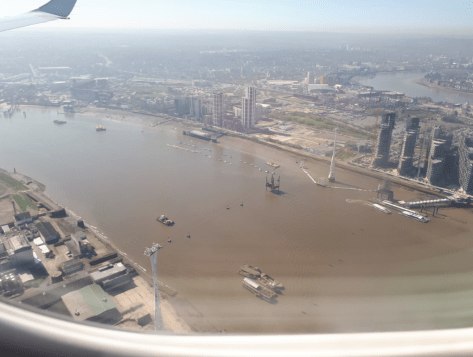
I took the following shots during a flight from Geneva to London on the morning of Thursday, April 19th – the hottest April day for at least 60 years.
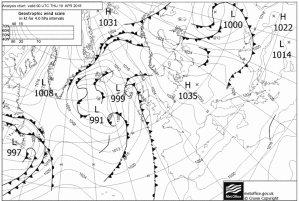
A large anticyclone brought temperatures far above average in many parts of Europe
Weather conditions on the BA CitiFlyer service to London City were virtually cloud free all the way thanks to a large anticyclone stationed almost slap bang over central Europe.
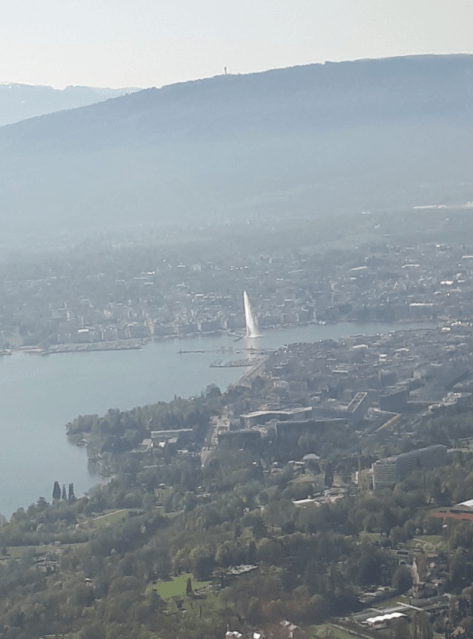
It was hard to stop looking out the window of the Embraer 190 from the moment we started our climb above the shores of Lac Léman, the Jet d’Eau the first landmark to become easily visible.
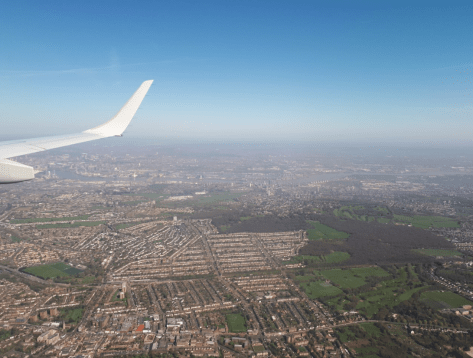
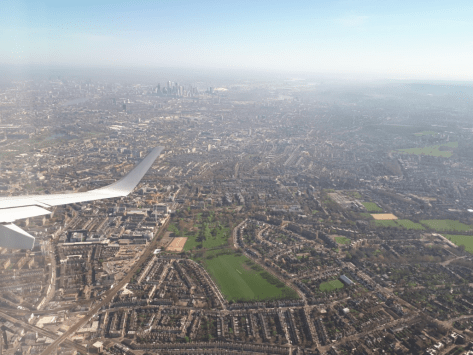
The rest of the flight offered a procession of chances to ‘guess the place’ as we crossed France, the Channel, and Kent before making our descent as we reached suburban south-east London.
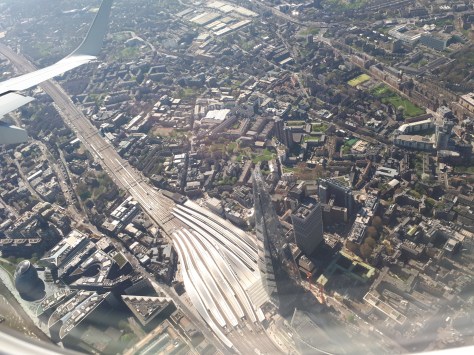
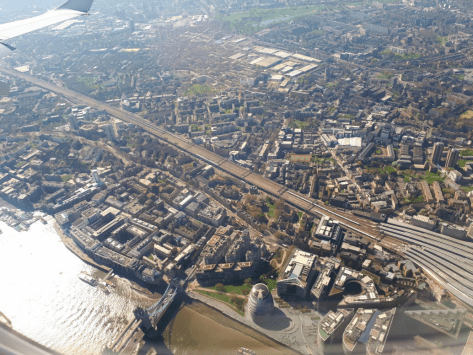
Before take-off the pilot mentioned our final approach would offer a very close up view of The Shard and the event didn’t disappoint. It felt we were only metres above the 1,000ft high pinnacle, the spectacle drawing gasps from passengers sitting behind me; it was very reminiscent of the final approach to the old Kai Tak airport in Hong Kong.
Disembarking brought a further treat as I walked out into the unprecedented April heat, the 29.1C reached that day made it the hottest April day for at least 60 years.
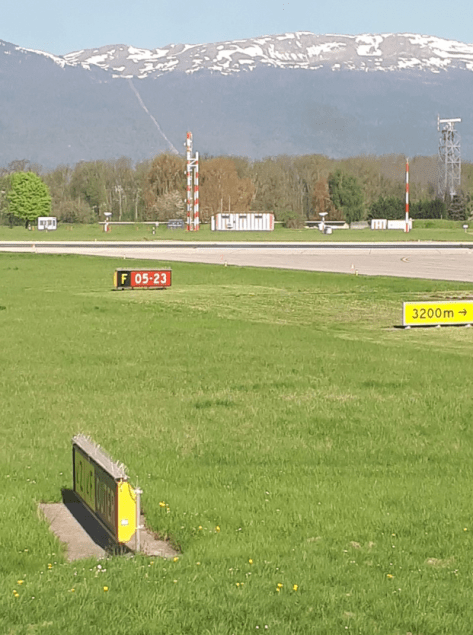
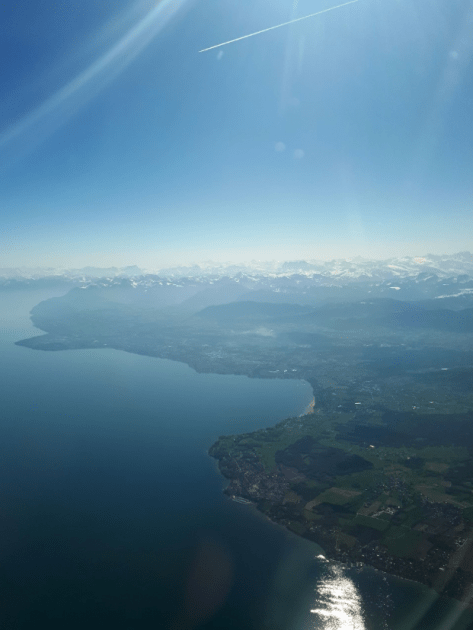
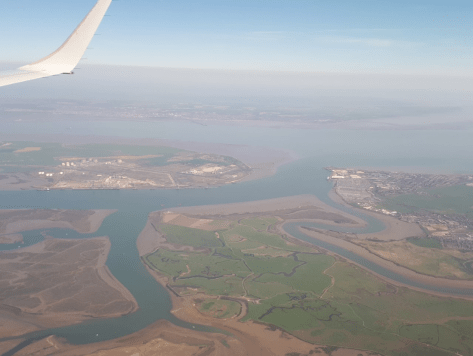
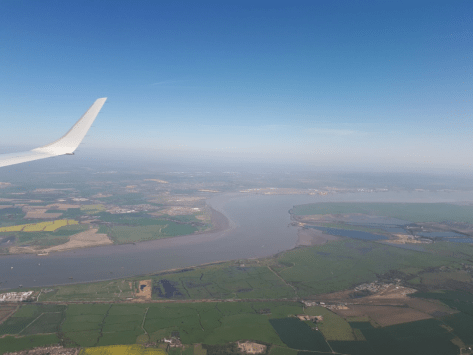
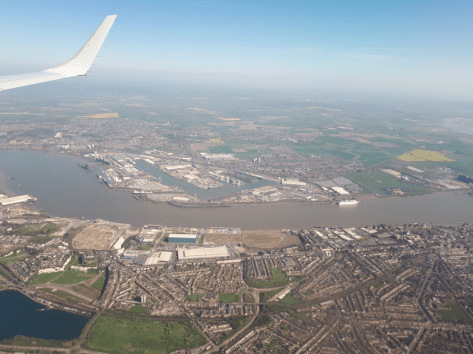
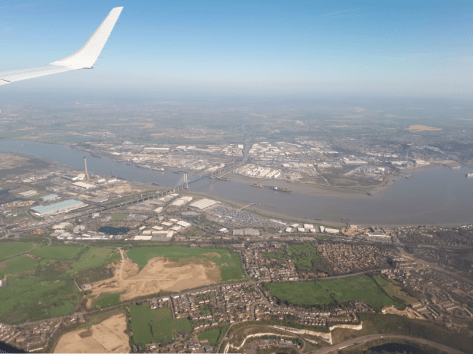
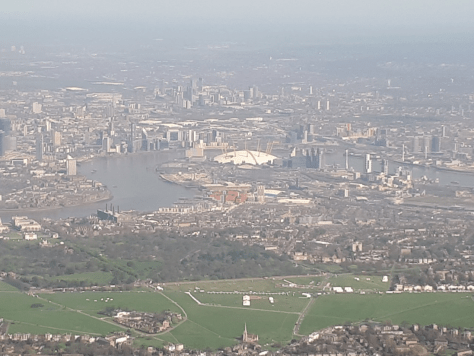
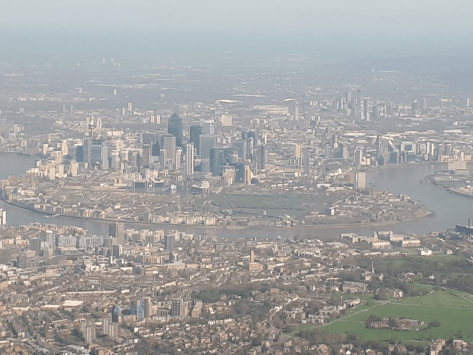
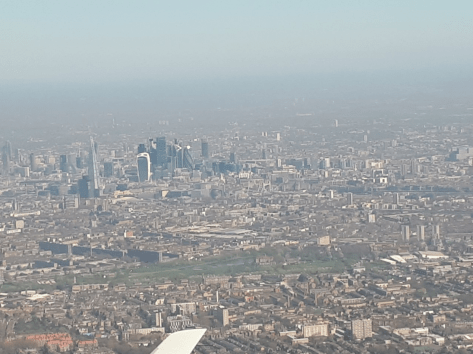
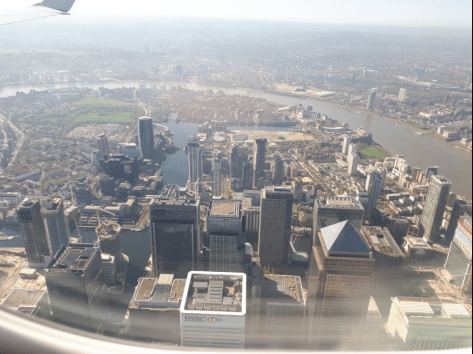
One of the met enclosures at Genève Aéroport with the hills of the Jura in the background.Lac Leman, Geneva, with the Jet d’Eau clearly visibleAs we climbed higher the Portes du Soleil mountains could be seen in the distance with the Mont Blanc Massif beyondLe Gris Nez and Wissant on the coast of Pas de Calais, with the port in the backgroundThe white cliffs of DoverWhitstable, Kent, just to the east of where the UK’s hottest temperature was recorded at FavershamThe Elmley National Nature Reserve on the Isle of Sheppey with Minster-on-Sea in the backgroundThe mouth of the Medway with the Isle of Grain on the left and Sheerness and Queenborough on the rightThe London Gateway ‘superport’ with Canvey Island just to the right and Southend in the distanceThe port of Tilbury, Essex, on the north bank of the Thames with Gravesend on the other sideThe Queen Elizabeth II bridgeSuburban SE LondonThe 02 / Millennium Dome with Canary Wharf to the leftCanary WharfThe CityRuskin Park, Denmark Hill, with Canary Wharf in the distance
The Shard and London Bridge station. The aircraft is now very low and we feel very close to the building’s 1,000ft high pinnacle. Passengers behind me gasp and I am reminded of the final approach into Hong Kong’s old Kai Tak airportTower Bridge and City HallCanary Wharf again but this time we’re a lot closerThe o2, againThe Emirates Airline / Thames cable car
















You must be logged in to post a comment.