All posts by wansteadmeteo

A blog that tries to make sense of how the UK's national climate translates into local weather for Wanstead and the surrounding regions of east London and west Essex. Check out my twitter feed @wanstead_meteo for local weather forecasts, stats, records and phenomena for the east London areas of Wanstead, Aldersbrook, Leytonstone and Stratford. And anything else weather

Wanstead weather in November

The current site hosting Wanstead’s weather station has been running for 11 years this month; the automatic station uploading data every 10 minutes to the internet.

The 10-year averages from the station are now good enough to be listed on the Climatological Observers Link.

A look at the eleventh month shows some interesting trends…

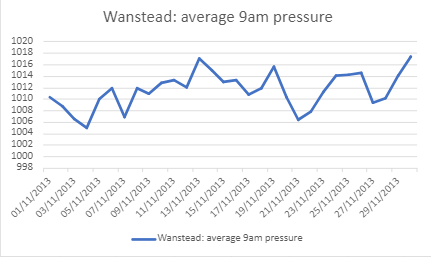
The 9am air pressure readings were not included in previous climate summaries owing to analogue barometers only giving approximate air pressure readings. The advent of AWS has changed that, particularly for independent amateur observers.

A look at the below graphic shows pressure lowest around the 4th, the stormiest weather of the month. Storm Ciaran in 2023 is proof of that.

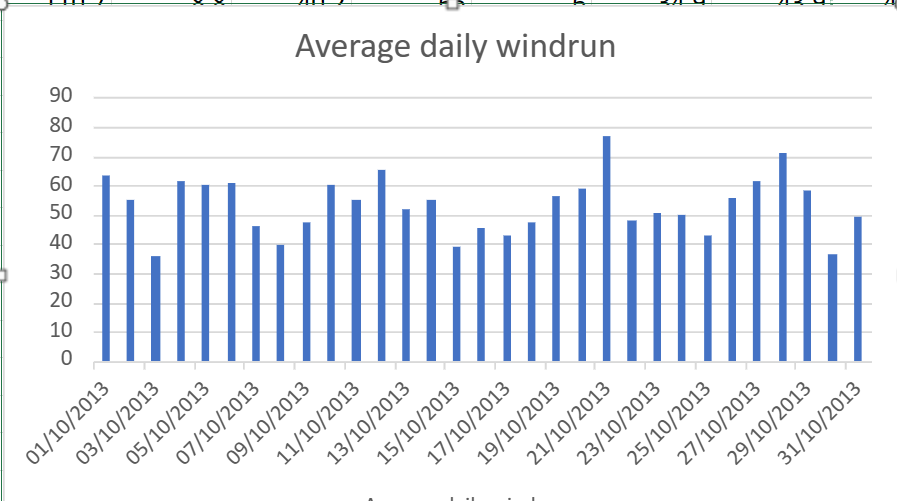
Average daily windrun is how much wind there’s been during a 24 hour period. The 21st comes out as windiest, the date when in the past there has been some notable early snowfalls in the south of the UK.

Average rainfall shows most precipitation in the first two thirds of the month with the biggest fall of rain on the 19th.

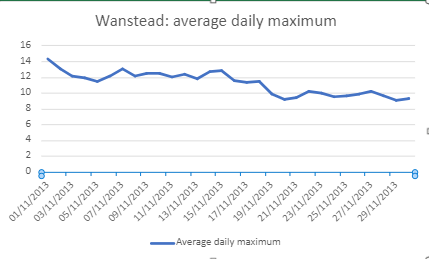
Average daily maximum temperatures during November take a general decline but, again, there’s a notable fall away on the 20th.

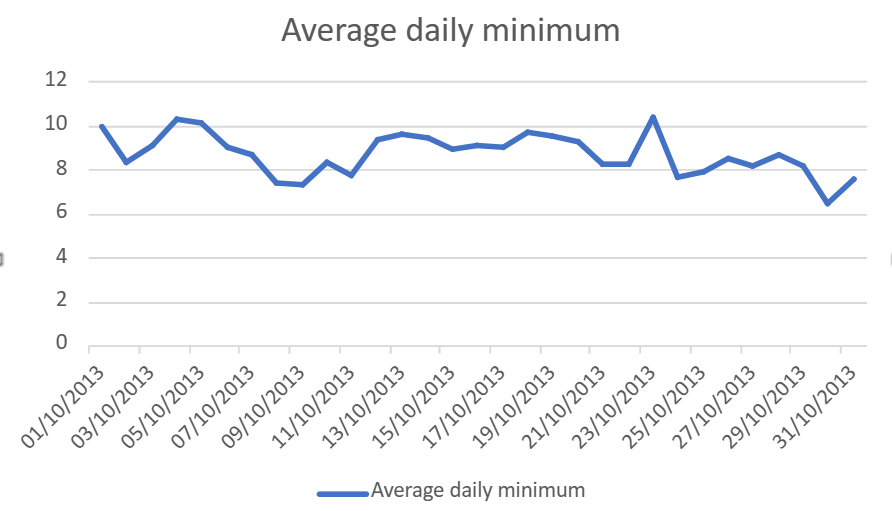
Average daily minima decline to the 5th (the 6th is the median for the first air frost) before increasing before falling away again after mid month.

Wanstead weather: October 2023

The mean for this October finished 13.1C, 1.3C above average. That’s 15th warmest locally since 1797 and 0.6C down on last year! Notable given the start was nearly 6C above average.

Rainfall finished 96mm, 144% of average. Which sounds a lot. But considering the last 5 years it would be third wettest – such is that October now seems to be a default wet month. Back to 1797 it would place 47th.

Looking at the average 9am pressure things really went south after the 17th.

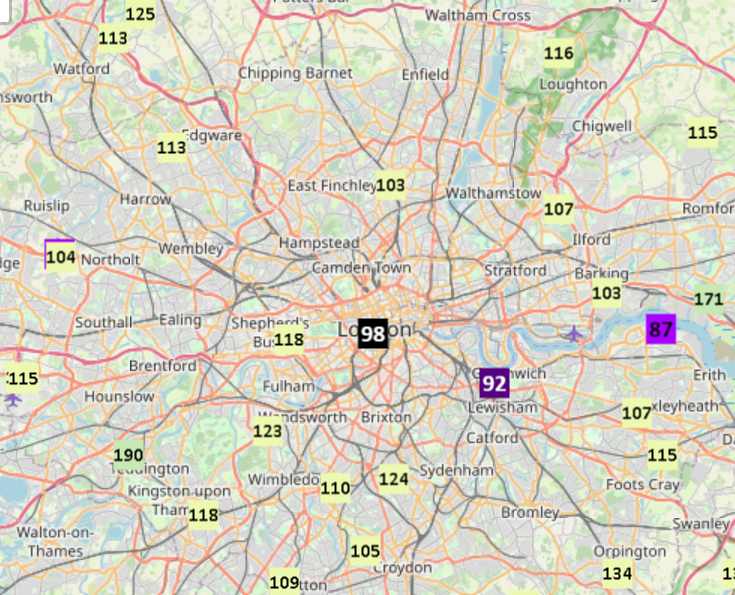
Looking at London as a whole rainfall at this Wanstead station was closer to the total at St James’s Park than Redbridge Roundabout!

And further afield check out how much wetter the south coast was.

Maps courtesy of Starlings Roost Weather.

Record low pressure of Christmas Day 1821

The lowest pressure recorded in the southern UK happened on February 25th 1989 when the barometer fell to 942.4mb.

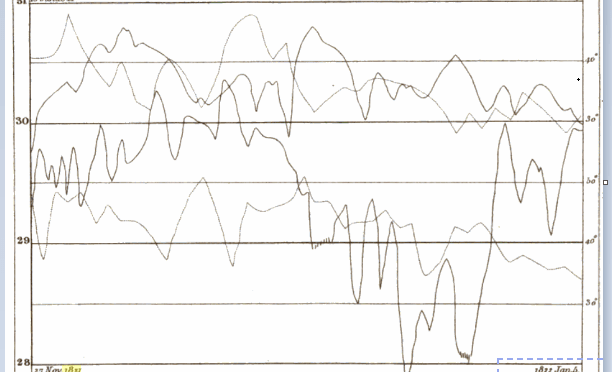
I was also reminded this week of another occurrence of extraordinary low pressure in southern England on Christmas Day 1821. Luke Howard’s Climate of London recalls the event in his December summary where, he states, the air pressure fell to 27.83 inches (942.4mb).

This month is remarkable for a depression of the barometer which for London at least or its vicinity is nearly without a precedent on record. The lowest observation here given 27.83 in was obtained at Tottenham from a portable barometer of Sir H Englefield’s construction about 5am on the 25th.

Luke Howard

In what appears to be remarkably similar to what is unfolding with Storm Ciaran Howard added that despite the low pressure the weather on Christmas Day was ‘very fine’, a day that was sandwiched by much rainy weather.

In his entry Howard explains:

We had no storm of wind of any consequence after this great depression which it should be remarked had been coming on for about two weeks. It appears by the papers that a like state of the barometer was extensively observed at the same time on the continent and that very tempestuous weather attended it far to the south of our island.

Luke Howard

Howard also received a letter from Thomas Squire of Epping who wrote.

The fall of the barometer has been as wonderful as the fall of rain. On the 24th at midnight my barometer was 27.76 in. It continued nearly stationary till about six next morning when it was 27.73 in. This was its minimum altitude shortly after it began to rise at 8am.

Thomas Squire

Squire’s readings, taken at Epping (105m), can be adjusted for sea level and compared with the hourly trace for Storm Ciaran. Taking this into account the barometer actually bottomed out at 927.6mb! Plotted against Storm Ciaran the behaviours of the two depressions are remarkably similar.

Howard would go on to discuss his findings with the Royal Society the following month in January. He remarks that the low pressure was notable in that it happened in the same year that notably high pressure was recorded in the February. Just like this year! I recorded 1060.1mb on February 5th.

Though low by southern UK standards there have been many deeper depressions to the north.

Spend £100k to save millions on flooding

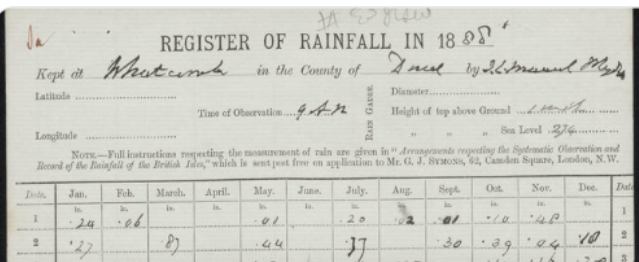
The Met Office Library holds millions of daily rainfall observations in its archives. Though anyone can access these physical treasures in person, and on request by email, a lot of these records taken before 1960 remain hidden away.

Yet these data provide an excellent insight into the behaviour of our weather on a local scale. As good as computer models are they are still a distance away from being able to forecast thunderstorms and frontal rain at smaller resolutions. Data from the literally hundreds of smaller rainfall stations set up in Victorian times would provide local government agencies the ability to identify where rainfall is historically heaviest and therefore areas where flash flooding is a greater risk.

For a number of years some of the archives have been digitised with the help of citizen science campaigns; the records of the Ben Nevis Summit Observatory being one historic station now digitised.

Though AI has improved computers still struggle with handwritten records; the best method is still to scan them all by hand before an army of volunteers get to input them onto online spreadsheets.

The cost to scan the rainfall archive pre-1960 would be £100,000. Though this sounds a lot for a ‘nice to have’ digital archive it could save millions in the cost of reactionary local authority work thanks to measures taken to plan against problems with flash flooding before they appear.

Wanstead’s rainfall: swinging from dry to wet

Tracking the rolling 12-month daily rainfall total allows a ‘real-time’ look whether an area is experiencing a drought or a deluge.

This week’s figure represents the 8th highest at this date since 1962. So not unusual. Until you look at the jump since last year. Some 303.6mm the past 12-months just pips the same period in 1976-77.

What is perhaps most noticeable is that this year follows last year’s negative fall which was the largest since 1961.

It’s one rainfall station BUT the results suggest a climate that is swinging more violently from one extreme to the other.

Wanstead weather in October

The current site hosting Wanstead’s weather station has been running for 11 years next month; the automatic station uploading data every 10 minutes to the internet.

The 10-year averages from the station are now good enough to be listed on the Climatological Observers Link.

A look at the tenth month shows some interesting trends…

The 9am air pressure readings were not included in previous climate summaries owing to analogue barometers only giving approximate air pressure readings. The advent of AWS has changed that, particularly for independent amateur observers.

A look at the below graphic shows pressure lowest around the 21st, the stormiest weather of the month. Storm Babet in 2023 is proof of that.

Average daily windrun is how much wind there’s been during a 24 hour period. Again the 21st comes out as windiest.

Average rainfall

Average daily maximum

Average daily minimum

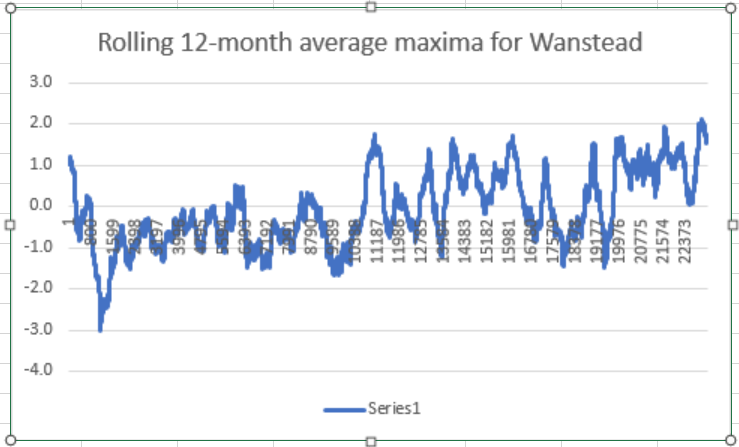
Rolling 12-month maxima in Wanstead, east London

The rolling 12-month average maxima anomaly in Wanstead on June 10th is sitting at 1.6C.

Considering local statistics back to 1959 the figure reached an all-time high of 2.1C last November, a level it stayed until December 11th, when a very remarkable week of snow and frost arrived.

With unremarkable maxima for most of this year the figure has been falling. But with a building El Nino it remains to be seen if the highest anomaly ever of 2.1C will be breached.

Date12-month rolling anomaly
10/6/20231.6
10/6/20221.1
10/6/20210.4
10/6/20201.3
10/6/20191.7
10/6/20180.5
10/6/20171.2
10/6/20160.9
10/6/20151.0
10/6/20141.4
10/6/2013-1.3

The snowfall of December 11, 2022

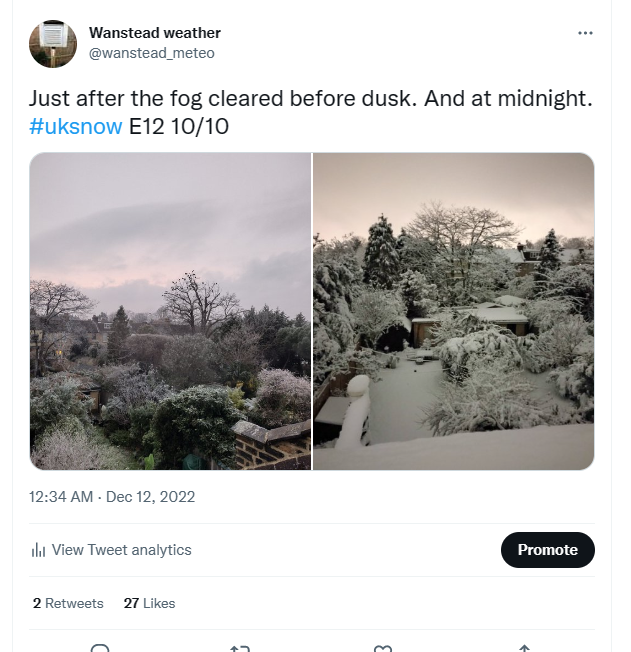
The morning of December 11, 2022, began cold after an overnight frost that saw temperatures fall to -5.3C. Freezing fog lasted through the day, coating everything in rime to set the stage for what was to be one of the most notable snowfalls in years.

Precipitation started just before 7pm with a mix of rain, ice pellets and wet snow, this soon turning to all snow within 10 minutes and settled fast.

By 9pm there was a good 6cm; Wanstead Park was soon transformed.

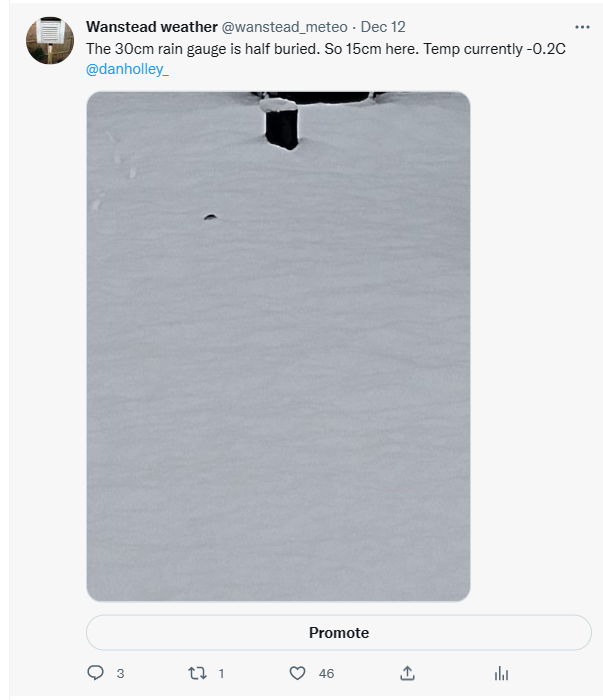
By midnight the snow had stopped, leaving a good 13cm out the back

Elsewhere there was a rare sighting of thundersnow in Billericay.

<blockquote class=”twitter-tweet”><p lang=”en” dir=”ltr”>Incredible &amp; relatively rare thundersnow captured on Essex! <br><br> <a href=”https://t.co/2o0OHY35oF”>pic.twitter.com/2o0OHY35oF</a></p>&mdash; Met4Cast (@Met4CastUK) <a href=”https://twitter.com/Met4CastUK/status/1602073484951261185?ref_src=twsrc%5Etfw”>December 11, 2022</a></blockquote> <script async src=”https://platform.twitter.com/widgets.js&#8221; charset=”utf-8″></script>

‘White flakes falling on the city brown’

Written in 1890 this poem was composed when white Christmases were far more common.

LONDON SNOW by Robert Bridges

When men were all asleep the snow came flying,

In large white flakes falling on the city brown,

Stealthily and perpetually settling and loosely lying,

Hushing the latest traffic of the drowsy town;

Deadening, muffling, stifling its murmurs failing;

Lazily and incessantly floating down and down:

Silently sifting and veiling road, roof and railing;

Hiding difference, making unevenness even,

Into angles and crevices softly drifting and sailing.

All night it fell, and when full inches seven

It lay in the depth of its uncompacted brightness;

The clouds blew off from a high and frosty heaven;

And all woke earlier for the unaccustomed brightness

Of the winter dawning, the strange unheavenly glare:

The eye marveled–marveled at the dazzling whiteness;

The ear hearkened to the stillness of the solemn air;

No sound of wheel rumbling nor of foot falling,

And the busy morning cries came thin and spare.

Then boys I heard, as they went to school, calling,

They gathered up the crystal manna to freeze

Their tongues with tasting, their hands with snowballing;

Or rioted in a drift, plunging up to the knees;

Or peering up from under the white-mossed wonder,

“O look at the trees!” they cried, “O look at the trees!”

With lessened load a few carts creak and blunder,

Following along the white deserted way,

A country company long dispersed asunder:

When now already the sun, in pale display

Standing by Paul’s high dome, spread forth below

His sparkling beams, and awoke the stir of the day.

For now doors open, and war is waged with the snow;

And trains of somber men, past tale of number

Tread long brown paths, as toward their toil they go:

But even for them awhile no cares encumber

Their minds diverted; the daily word is unspoken,

The daily thoughts of labour and sorrow slumber

At the sight of the beauty that greets them, for the charm they have broken.

A chilly and dry autumn on the way?

Anomalies of the past two months throw up some interesting singularities as we head into late summer and autumn – with a hint that we could be heading for a much colder than normal December.

Using stats from the past 60 days revealed the following years. Those most similar to the current ENSO situation are highlighted in bold.

The most negative month on average will be December.

In terms of rainfall those hoping for a deluge look likely to be disappointed, at least in the south-east, with a continuation of synoptic conditions that favour drier than average weather.

The best chance for a wetter than average month appears to be September though, given recent synoptics, this is likely more a result of trough disruption than any sustained period of Atlantic-driven fronts.