July 2018 was the warmest month locally in a record going back to 1797. The mean temperature of 21.7C is 3.2C above the 1981-2010 average and exceeds the previous warmest July (1983) by 0.3C. Indeed, it is the warmest calendar month ever.
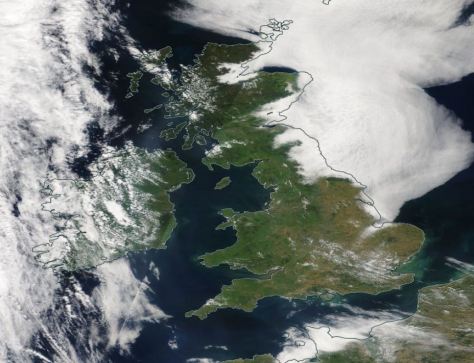
MODIS image July 15th 2018
Just 16.7mm of rain fell, all of it coming after the 47 day long drought ended with a thunderstorm on the 27th. The amount is 38 per cent of average and is the driest July since 2010 and 7th driest in the local record.
There were 273 hours of sunshine, 142 per cent of average, making it the sunniest for five years and 10th sunniest on record.
As well as many hot days the lack of rainfall was most noticeable with catastrophic results on Wanstead Flats.
The warmest day occurred on the 26th with 34.7C.
The wettest day occurred on the 27th with 7.3mm falling.
The long range weather models are causing much excitement on various forums with one run predicting an anomaly of +16C on Sunday, July 29th.
Such an anomaly would see temperatures exceed 40C in London, unprecedented looking back at records to 1841; the highest temperature recorded in the UK was 38.5C at Brogdale, near Faversham, Kent, in Augut 2003.
Though it is improbable it is not impossible. Back in April conditions allowed the temperature to rocket to a monthly record of 29.1C, a positive anomaly of 15.5C!
A repeat of similar synoptic conditions would be needed – these would obviously be helped by the record meteorological drought conditions this area is currently experiencing.
Because reliable thermometer records of heatwaves only go back as far as 1840 it is impossible to quantify whether 40C has ever been exceeded in the UK prior to then.
However, accounts of the heatwave of July 1808 suggest parts of England may have come close. Far removed from images of freezing Georgian winters and miserable summers the July of 205 years ago was among the warmest ever. The monthly mean for July 1808, according to the Central England Temperature series, was 18.4C – the 6th hottest July since the beginning of the series in 1659.
Luke Howard, the ‘father of meteorology’ who at the time lived in Plaistow, referred to the heatwave in his diary on July 13th: “Temperature at 9am 84F. The intense heat of the maximum lasted nearly three hours till about 4pm. At 6pm the temperature was 90F.” Another entry mentions a reading taken nearby. “Another at Plashet, a mile and a half eastward, indicated 96F as the maximum under the shade of a house.”
While Howard’s methods of measuring the temperature ran short of modern standards, his thermometer was hung under a laurel bush, the values still give a valid insight into the heatwave.
Tales of the heatwave, which particularly affected east and north-east England, can be seen in letters sent to local newspapers around the country. Many describe labourers dying from heat exhaustion while working in fields. Farm animals and horses suffered a similar fate.
One letter from Hull, published in the Coventry Mercury, said: “At Sigglesthorne, the honey in some beehives melted, ran out upon the ground, and most of the bees drowned in it. At Sutton, a lamb and a dog belonging to the Rev Mr Croft of Rowley, expired in the heat; and several birds dropped down dead, while flying over the streets of this town.”
Of course it is impossible to know about the health of people and animals that died but that birds dropped out the sky suggests extreme heat.
This summer has seen less than a millimetre of rain fall across our region, less than some parts of the Sahara desert!
The lack of precipitation has had catastrophic results, not least being a big contributing factor to the huge grass fire that swept through parts of Wanstead Flats at the weekend.
Since May 29th just 0.7mm has fallen in Wanstead, less than the 2.9mm recorded in Bechar, Algeria, and far less than Agadez in Niger which recorded nearly 108mm.
Of course the fact that the mean temperature of Wanstead over the same period is at least 13C cooler than both Saharan towns means that the dunes won’t be blowing across the Temple any time soon.
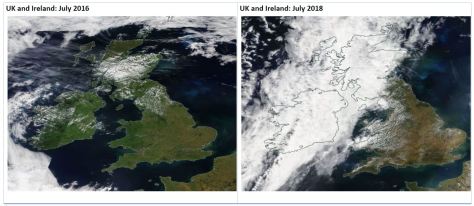
The affects of the dry weather can also be seen across the UK in these MODIS images, the lush greens of last year looking much paler and browner.
MODIS image July 23rd 2014MODIS image July 15th 2015MODIS image July 19th 2016MODIS image July 17th 2017MODIS image July 15th 2018
A thunderstorm on July 27th has ended a dry spell that lasted nearly 7 weeks in east London. As storms go it was a fairly tame affair, just 1.3mm fell, the first rain in 47 days, 20 hours and 14 mins.
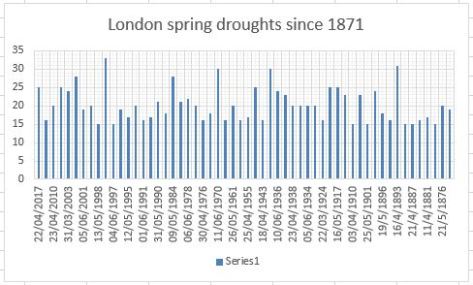
There are many descriptions of drought but the one I am using here, for sheer simplicity of comparison back to 1871, is the definition used up until the 1990s; that is 15 consecutive days with less than 0.25mm (0.01 inches) rain on any one day.
Meteorological droughts occur in most years though obviously ones that occur in summer are far more noticeable than those in winter. Since 1871 there have been 35 calendar years where no drought has taken place.
The longest drought before this one in 2018, probably not surprising for those who remember it, occurred during the long hot summer of 1976. The fact that summer came on top of a very dry winter, rainfall that season was about a third of what was recorded here last winter, meant that water supplies were in a much worse state, with hosepipe bans common.
Other drought years to feature include 1959, which saw the 3rd sunniest summer on record, 1929 and 1995, a summer which saw one of the hottest heatwaves on record.
For the stats I’ve used local rainfall figures back to 1959 and then stats used at Kew to 1871.
This graphic shows droughts were most common between 2000 and 1921. Apart from this year the length of droughts seems to be declining
Looking at the results more closely I’ve divided them into their meteorological seasons.
Recent weather patterns have seen much high pressure to our north keeping us dry and mostly sunny but, aside from June, protected from humid Spanish plumes.
A look at local east London stats shows that half of the last 10 July months have been warmer than average while only two have been much drier than average.
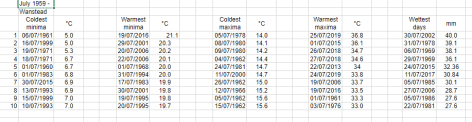
I’ve put together a few top 10s of stats for Wanstead, St James’s Park and Heathrow for the month of July.
Some national UK July values according to TORRO
Hottest: 19th 2006: 36.5C at Wisley, Surrey.
Coldest: 15th 1977: -2.5C at Lagganlia, Highland.
Wettest: 18th 1955: 279.4.8mm at Martinstown Dorset.
In terms of climatology July maxima, considering the 1981-2010 average, shows a fairly steady increase through the month, though around the 17th there is often a dip before a warm end. This would reflect the July heatwave singularity which occurs every year at 80 per cent probability.
The average rainfall graphic shows that downpour amounts are fairly random from year to year. The driest days are the 1st and the 25th.
This June will probably be most remembered for the lack of rainfall throughout the month. I recorded just 0.7mm of rain over the 30 days – the driest June in a local record going back to 1797, 0.4mm less than the previous driest June in 1925.
A fire on Wanstead Flats on Friday 29th was quickly extinguished thanks to the fire brigade
As I write this the area is now experiencing its 24th day of ‘meteorological drought’ conditions with little prospect of anything heavy anytime soon. The month was in stark contrast to May which saw may downpours associated with thunderstorms.
It was a warm month. The mean temperature finished 18.1C, exactly 2C above average, though slightly down on last June and the 7th= warmest since 1797.
Some 231.4hrs of sunshine were recorded, 130 per cent of average, making it the sunniest May for 8 years, and the 30th sunniest since 1881.
The warmest day occurred on the 25th with 30C.
The wettest day occurred on the 9th with 0.4mm falling.
Summary for June 2018
Temperature (°C):
Mean (1 minute) 17.7
Mean (min+max) 18.0
Mean Minimum 12.3
Mean Maximum 23.8
Minimum 6.4 day 12
Maximum 30.0 day 25
Highest Minimum 17.8 day 18
Lowest Maximum 17.9 day 04
Air frosts 0
Rainfall (mm):
Total for month 0.7
Wettest day 0.4 day 09
High rain rate 4.0 day 09
Rain days 1
Dry days 29
Wind (mph):
Highest Gust 18.3 day 14
Average Speed 3.1
Wind Run 2199.7 miles
Gale days 0
Pressure (mb):
Maximum 1029.9 day 21
Minimum 1008.2 day 14
Days with snow falling 0
Days with snow lying at 0900 0
Total hours of sunshine 231.4
Elsewhere in the UK it has been a very dry month across England.
Two CET stations, Rothamsted and Pershore recorded 2.2mm and 10mm respectively.
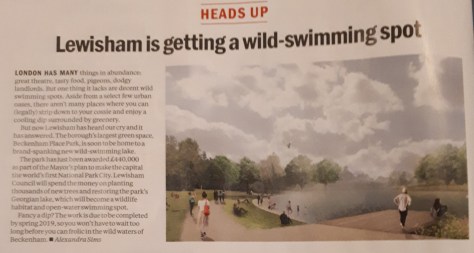
Lewisham’s Beckenham Place Park will next year be home to a new wild swimming lake, thanks to a plan to make London the world’s first National Park City.
The scheme put me in mind of the Shoulder of Mutton lake in Wanstead Park which, decades ago, used to host swimming galas and other events. Long-time residents of Aldersbrook will remember the jetty and diving board that stood at the edge of the lake before falling into disrepair that led to their removal.
With millions set to be spent shoring up the dams of the park’s lake system it is surely feasible that the City of London Corporation can reopen Shoulder of Mutton to swimming while the work is undertaken.
While being cheaper than a lido it would provide an excellent resource and give local residents the chance to enjoy once more swimming in natural surroundings, just like in the Serpentine and Hampstead Ponds.
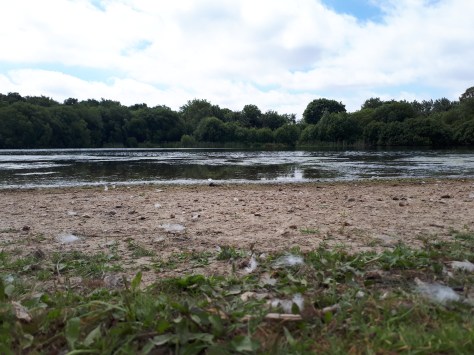
The Shoulder of Mutton pond has a natural beach and once hosted swimming galas and diving competitions
A look at local east London stats shows that six of the last 10 Junes have been warmer than average while half have been much drier than average.
I’ve put together a few top 10s of stats for Wanstead, St James’s Park and Heathrow for the month of June.
Probably most notable from the below values is that recent Junes have been devoid of extreme cool temperatures and rainfall.
Snow has been known to fall in June, in 1975.
Rain is usually most frequent in the last week of the month.
The 10 driest Junes were:
Some UK May values according to TORRO
Hottest: 29th 1957: 35.6C at Camden Square, London. Also Southampton 28th 1976
Coldest: 9th 1955: -5.6C at Dalwhinnie, Highland. Also June 1st and 3rd 1962: Santon Downham, Norfolk
Wettest: 28th 1917: 242.8mm at Bruton, Somerset
In terms of climatology June maxima, considering the 1981-2010 average, shows a gradual increase through the month, though around the 19th to the 21st there is often a dip before a warm end. This would reflect the June Monsoon which occurs every year at 77 per cent probability.
The average rainfall graphic reflects this, showing a four-day wetter spell after the 20th.
This May will probably be most remembered for the number of thunderstorms affecting the area. I recorded an unprecedented (in my memory) four consecutive days of thunderstorms.
Convective clouds build over Wanstead Flats
It was also warm with a couple of days making the top 10 of hottest days since 1959. The mean temperature finished 15.1C, 2C warmer than average, the warmest May for seven years and the 8th= warmest since 1797.
Rainfall at 65.5mm was 128 per cent of average and slightly drier than last year.
Some 244hrs of sunshine were recorded, 134 per cent of average, making it the sunniest May for 7 years, and the 11th sunniest since 1881.
Spring finished with a mean temp of 11C, 0.8C above average, 1C cooler than last year. Rainfall at 181.9mm, was 135 per cent of average, making it the wettest spring for 10 years. Sunshine of only 411.2 hours made it the dullest spring since 2006.
The thundery end to spring has probably built everyone’s hopes up that we’re about to experience a summer with plenty of fireworks in the atmosphere. But the current pattern that brought four consecutive days of thunder (the whole year average is 3.5!) – a continental influence on our weather – could just as easily flip to a mobile south-westerly.
Thunderstorms will probably continue to be a feature of the summer
The mean temperature for summer 2018 is looking average overall with average precipitation.
Like the most recent winter forecast I’ve looked in depth at ENSO, QBO and local meteorological data.
ENSO
The El Niño–Southern Oscillation (ENSO) is a periodic variation in winds and sea surface temperatures over the tropical eastern Pacific Ocean. Current neutral conditions are forecast to continue through to September so any impact is likely to be very small. I had a look at similar years were ENSO was 0.2 in May and came up with the following.
Temperature
Average: 40%
Rather cool: 40%
Cool: 20%
Rainfall
Average to slightly dry: 60%
Average to slightly wet: 40%
Sunshine
Average to slightly sunnier than average: 60%
Average to slightly dull: 40%
QBO
I also had a look the quasi-biennial oscillation (QBO), the quasiperiodic oscillation of the equatorial zonal wind between easterlies and westerlies in the tropical stratosphere. This produced only two similar years: 1963 and 2010.
Temperature
Average: 50%
Cool: 50%
Rainfall
Average to slightly dry: 50%
Average to slightly wet: 50%
Sunshine
Average to slightly sunnier than average: 50% Singularities / patterns
Spring was consistently on the wet side this year with all months at least 127 per cent wetter than average, the total of 182mm made it the wettest for 10 years.
The mean temperature for the spring season, despite the very cold start, ended 0.8C warmer than average, just under a degree colder than last spring which was the second warmest on record.
If you take into account all years back to 1797 that were within +/- 10 per cent of these figures, some 10 ‘best fit’ years emerge.
The list of 10 summers, ranging from 1801 through to 2007, predominantly saw summers that were just on the cooler side of average – no real corkers stand out except for 2001 which saw a hot spell at the end of July that made it into my list of best heatwaves.
As an average this summer could be expressed as: Mean: 17.1C (just below average) Rainfall: 150mm (about average). Sunshine 535 hours (just below average)
Or, expressed in probabilities, I concluded the following:
Temperature Average to slightly below: 50%
Average to slightly above: 20%
Rather cool: 20%
Cool: 10%
Rainfall
Average: 50%
Wet: 30%
Dry: 20%
Sunshine
Average: 10%
Average to slightly sunny: 30%
Average to slightly dull: 40%
From the above you could deduce that the next three months will be slightly below average for temperature, with average rainfall. And slightly duller than average.
To try to give some idea of what month will have the best weather I’ve broken down the summer into June, July and August probabilities.
Looking at June, after the weekend, the outlook is looking unsettled and gradually turning cooler after the first week. July looks average as does August which, apart from two years, has been a very disappointing summer month.
Perhaps the best weather this summer will be at the end of June and the second week of July – just as most schools break up?
* Taking into account the fact that temperatures in London are up to 0.66C warmer than they were 100 years ago I have added 0.66C to mean temperatures before 1915.
** Obviously, in the event of a series of direct hits from thunderstorms, my rainfall estimate could be hopelessly short – a symptom of abundant solar energy at this time of year which creates a ‘noisy’ atmosphere compared with winter.
*** The 1981-2010 average mean for summer in this region is 17.6C, with 144.9mm of rain and 564 hours of sunshine


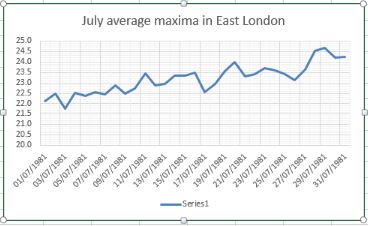 In terms of climatology July maxima, considering the 1981-2010 average, shows a fairly steady increase through the month, though around the 17th there is often a dip before a warm end. This would reflect the July heatwave singularity which occurs every year at 80 per cent probability.


 In terms of climatology June maxima, considering the 1981-2010 average, shows a gradual increase through the month, though around the 19th to the 21st there is often a dip before a warm end. This would reflect the June Monsoon which occurs every year at 77 per cent probability.


You must be logged in to post a comment.