Category Archives: Weather

July 2024 in Wanstead

The mean for July in east London was 18.4C, 0.1C below the 1981-2010 average and the coolest for 12 years.

Rainfall of 67.1mm was 154% of average, 3mm less than last July. Sunshine at 177.3 hours was 92% of average. Duller than average but not as dull as last July.

A largely uneventful month with an absence of thunder and lightning.

As thought months ago with ENSO moving toward neutral August should be the month with the best chance of any heat records being broken.

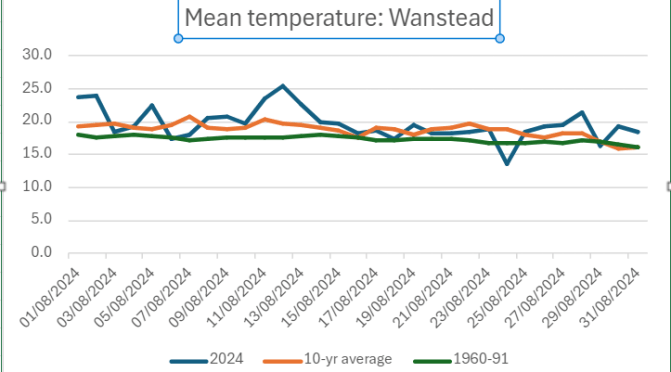
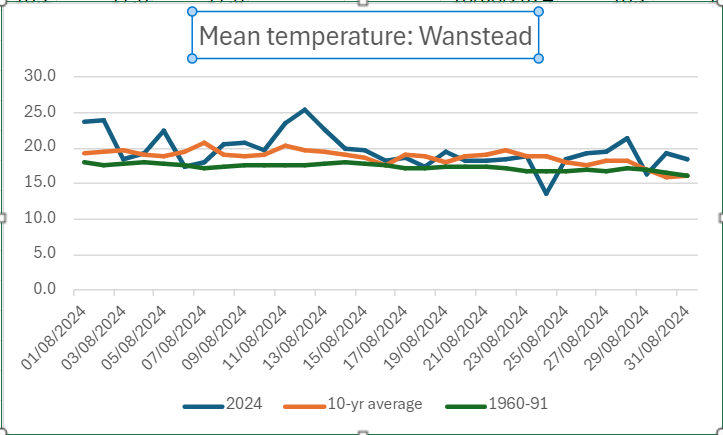
A look at the mean temperature shows how much the climate has warmed since the period 1961-90. Though the mean last month was 1.3C down on the previous 10 years it was actually 0.7C warmer than 1961-90.

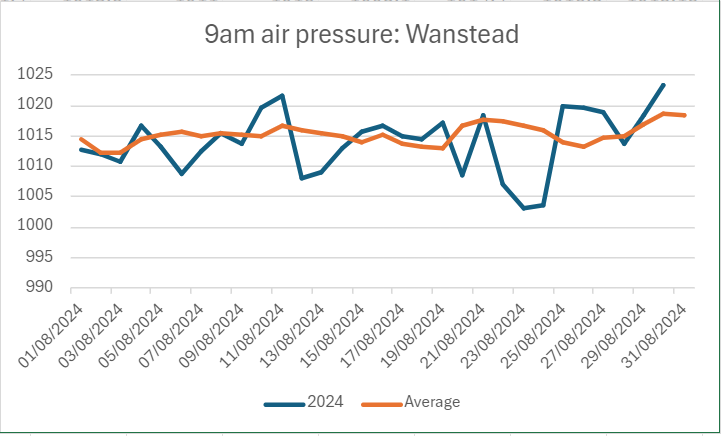
9am air pressure was largely below average until the final third of the month, coinciding with the arrival of more summer-like weather.

Here’s a few extremes for the month of August across the capital.

London’s hottest heatwaves under the microscope

It is no surprise that London’s heatwaves are getting hotter but by what rate are they increasing?

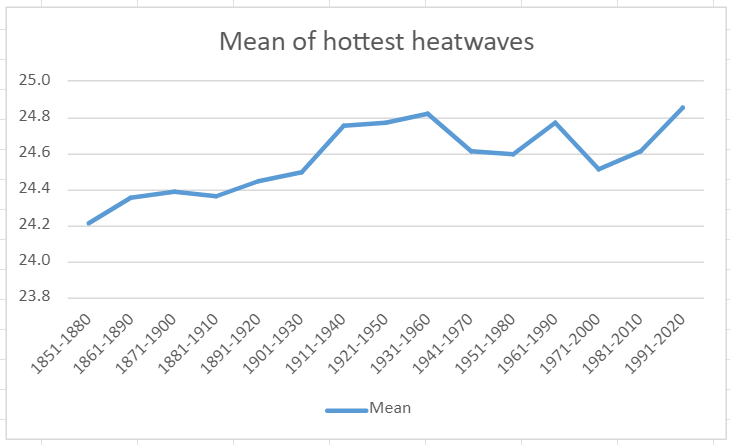
Using a list of hot spells made nine years ago I set out to find how the 30-year trends have moved through the decades since 1852.

The mean of these hot spells has increased from 24.2C in 1851-1880 to 24.9 in 1991-2020, an increase of 0.7C.

Maxima during these spells, on the other hand, has decreased from 32.6C to 31.8C. It should be noted that the spell that produced this area’s hottest ever daily maximum, 40.1C on July 19th 2022, was a 2-day affair that didn’t qualify for the list.

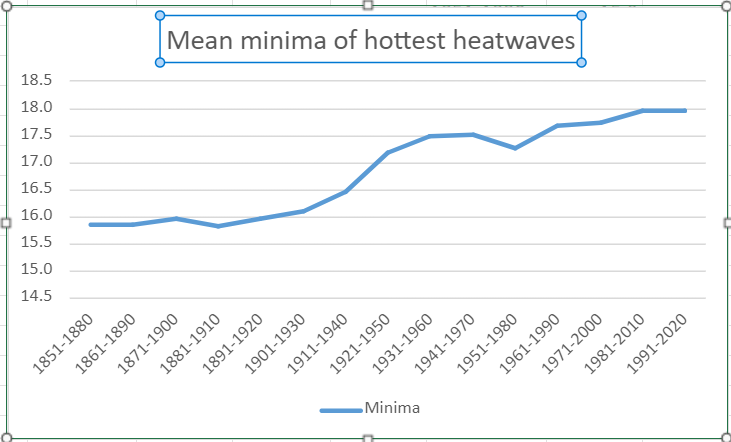
It is the minima that produces the most notable results with average low temperatures increasing over 2C from 15.9C to 18C! The urban heat island in full effect although the estate where a large proportion of these stats are gathered has changed little since it was built in the early 1900s.

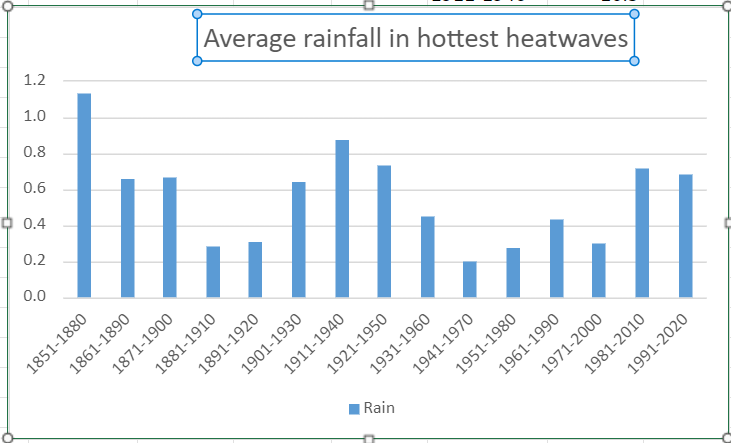
Rainfall during these hottest heatwaves is cyclical, in keeping with daily rainfall patterns observed over the same period.

Average sunshine in these heatwaves has shown a slight decline. It is no coincidence that maxima was at its highest during 1911-1950 when there was most sun. Increased cloud cover overall would take the edge off maxima while making the nights warmer.

Wanstead maxima: 1990 v 2024

The average maxima in Wanstead so far this summer is 22C, some 0.8C higher than in 1990 – the year an August heatwave saw the UK’s max record broken with 37C in Cheltenham. Media at the time said: “I wonder if the UK will ever see 100F?

The temperature in Wanstead on August 3rd reached 35.8C, my station notes for the day say: ‘dry, sunny and very, very hot’.

Will we see a similar heatwave next month? The weather models tonight suggest not, a flat westerly flow keeping any extreme heat in Iberia.

However, in keeping with summers that occur after an El Nino event, the core of any heat usually happens in late summer – August into September.

El Niño’s effect on local climate

With the El Niño–Southern Oscillation (ENSO) trending toward neutral I thought it would be interesting to see how east London’s climate has been affected over the past year.

Using the 12-month rolling mean for this station the difference is an increase of 0.24C. The increase in rainfall, using the 12-month rolling average, is more stark with an increase of 100.9mm.

I had a look at all other El Nino events back to the early 1960s. Some 5 of 7 events saw an increase in the rolling average mean.

The 12-month rolling average rainfall similarly saw an increase in 5 of the 7 events.

The most notable event was May 1997 to May 1998 which saw the temperature increase by 1.67C and a massive increase in rainfall of nearly 300mm.

June 2024 in Wanstead

The mean for June in east London was 16.2C, 0.2C warmer than average though the coolest 6th month for 11 years. So yet another warm month – it is now 18 months since we saw a below average one.

Rainfall was on the low side, just 15mm was 29% of average, the driest June for 6 years and 20th driest locally since 1797. Today also moves us into meteorological drought territory – 15 days since there was last measurable rain (>0.2mm)

Sunshine at 204.6hrs was 115% of average, the dullest for 3 years.

The most notable day was probably the 15th with thunder and lightning and a heavy shower at 1230-1300. Further moderate showers in the afternoon.

So, far from being the ‘crap summer’ some are portraying it summer 2024 so far is pretty average here.

More of the same for July. Perhaps a couple of hot days but any prolonged heat staying to our south?

As thought months ago with ENSO moving toward neutral August should be the month with the best chance of any heat records being broken?

Here’s a few extremes for the month of July across the capital.

UK rainfall: Seathwaite / Honister v London

It’s been a wet winter so far. Some 177mm has fallen in Wanstead – already 122 per cent more what falls in an average winter.

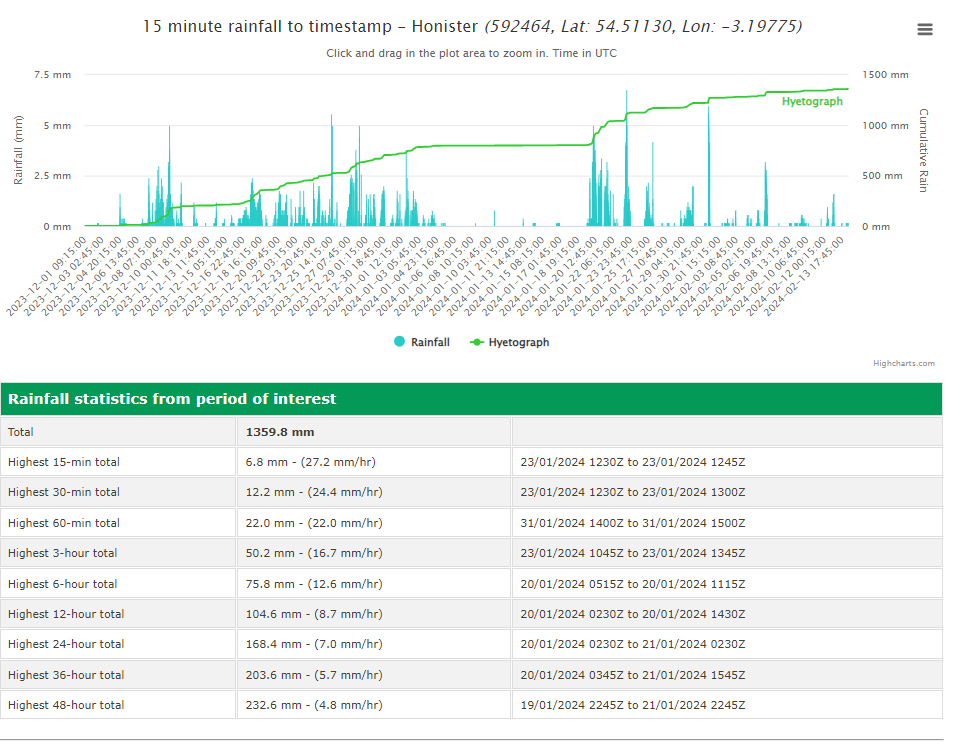
But the amount pales into comparison with the Lake District. Since December 1st 1360mm has fallen at Honister, a station close to Seathwaite which proudly proclaims itself as ‘England’s wettest place’.

Over a calendar year the area usually sees 5.6 times the amount of rainfall of London. However, this winter the total of 1360mm makes it 7.7 times wetter! A testament to just how persistent the SW’ly airstreams have been this season. And a reminder that the Lake District is the called the Lake District for a reason.

Data from the excellent Starlings Roost Weather.

Wanstead weather in December

Continuing on from last month this blog focuses on the weather recorded at this station over the last 11 years.

A look at the twelfth month shows some interesting trends…

The 9am air pressure readings were not included in previous climate summaries owing to analogue barometers only giving approximate air pressure readings. The advent of AWS has changed that, particularly for independent amateur observers.

A look at the below graphic shows pressure falling through the first half of the month. A sharp rise is then seen before falling again – there’s often storms around the 23rd until the 27th.

Average daily windrun is how much wind there’s been during a 24 hour period. The 23rd comes out as windiest.

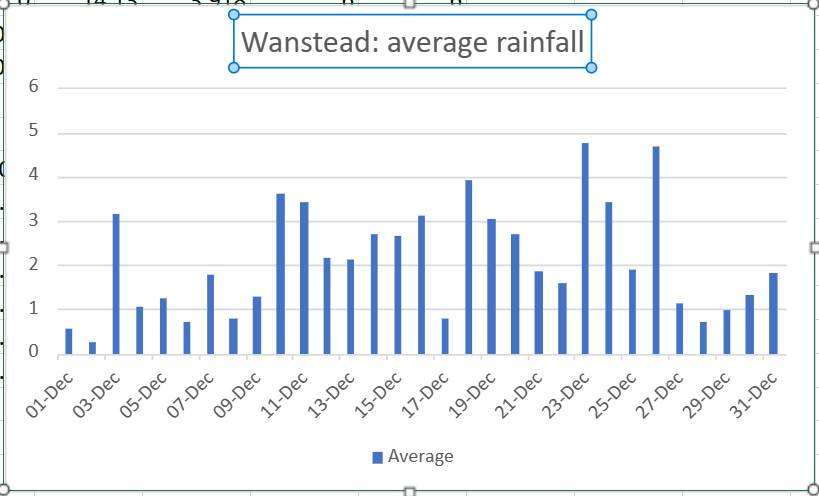
Average rainfall shows precipitation building through the month, to peak on the 23rd before a sharp drop off after the 27th.

Average daily maximum temperatures during December show a stuttering first 10 days before a steady rise through the next fortnight before a steady fall off from the 23rd .

Average daily minima is up and down in the first 10 days before a steady rise from the 11th. Again there’s that falling off a cliff on the 23rd.
This pivotal date, being so close to Christmas Day, is one of the reasons why ‘will it, won’t it be a white Christmas’ is a perennial fascination among the nation.

Advertisements
Disturbed autumn regimes

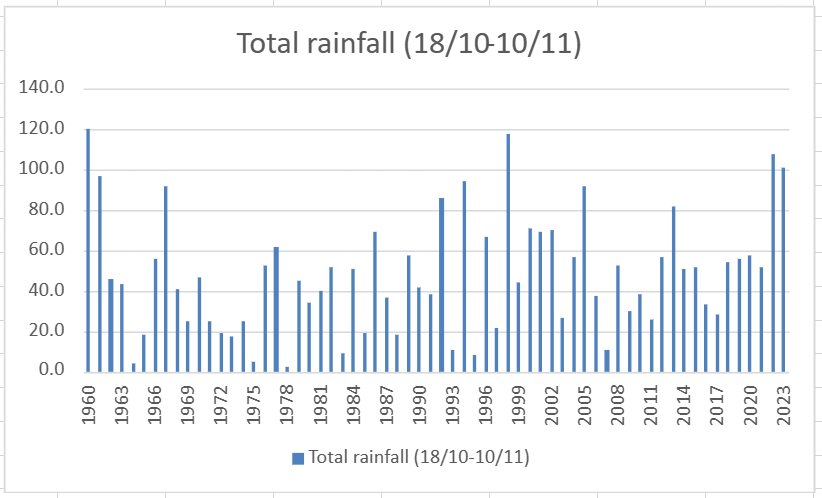
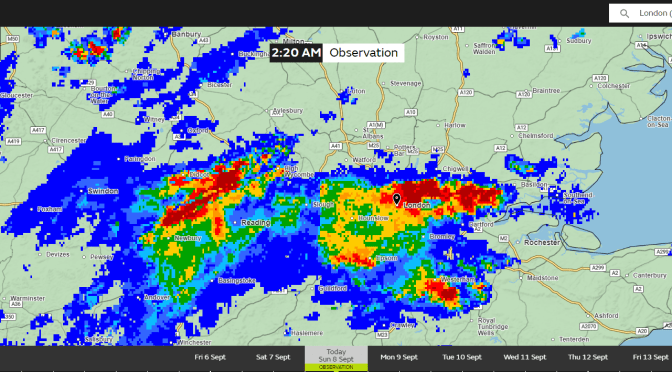
October 18th this year heralded a run of weather where it has hardly stopped raining in this part of the south-east.

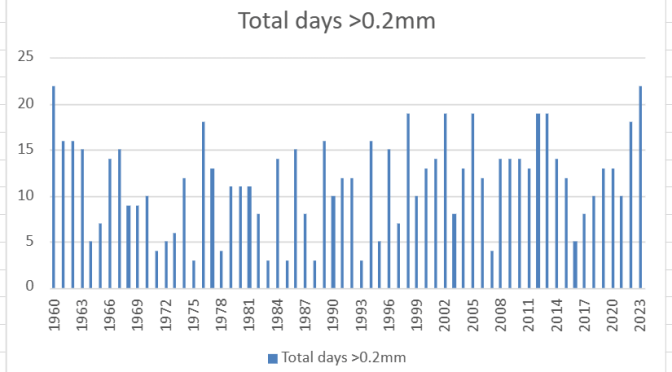
Since that date there has been 101mm of rain with 22 ‘rain days’, 24 hour periods where there’s been 0.2mm of rain or more. Just one of the last 24 days has been completely dry.

In terms of the 1991-2020 average the amount represents just under twice the usual amount of rainfall at this time of year.

In terms of unusual weather patterns it is up there amongst the ‘top 10’.

What does it mean for the coming winter. Impossible to say on a small scale but I’m guessing wet and mild in the south. Note however that 1960/61 and 1998/99 had a number of maritime northerly outbreaks which added up to an average winter in Scotland, and plenty of snow for the Highlands.

Also note how similar this autumn is to last year when the snowy spell in December came out of nowhere.

The Hampshire tornado of December 1821

While researching an incident of very low pressure in 1821 I also found this account of a tornado that happened a couple of days later – not dissimilar to events earlier this month close to the south coast of England.

In The Climate of London, Luke Howard writes about an account of an ‘electrical whirlwind’ or spout in Hampshire.

On December 27th, two days after the record low pressure recorded in the London area, residents between the towns of Alresford and Alton witnessed a thunderstorm that was accompanied by torrents of hail, rain and gusty winds at 2.30pm.

A funnel was seen tapering gradually to the ground, the vortex bending from the prevailing SW’ly wind. Lasting for two minutes, according to one account, the whirlwind caused havoc as it carved a ‘serpentine chiefly in the direction of London Road’.

Its effects were restricted to a distance of two miles along a path of varying between 6ft and 20 yards in width.

One person described the tornado as a body of thick white mist tapering from the clouds and near the earth about the size of a woolpack. It appeared to him to touch the earth and bound from it repeatedly. Another witness who was nearer said he felt as if pails of water were thrown on him such was the effect of the strong electric aura attending it though there was no discharge of water at the time from the cloud.

The aftermath revealed a trail of destruction. An oak tree, a ‘foot and a half’ in diameter, was broken and carried upwards of 40 yards. Several fences were removed to a distance of many feet.

In the village of Ropley a farmhouse was damaged two barns were destroyed. Large elm trees were uprooted, a ‘fine walnut tree broken in half’ and gates, stiles and even thick gate posts were torn up.

The trees and ruins blocked the coach road and ‘it required some hours labour to clear them away’.

Looking at the possible track of the tornado it occurred close to the UK’s ‘tornado alley’!

The local problem of global climate change

This year is likely to be the warmest on record globally, statistics from the Copernicus Climate Change Service suggest.

Samantha Burgess, deputy director of the Copernicus Climate Change Service, said: “October 2023 has seen exceptional temperature anomalies, following on from four months of global temperature records being obliterated. We can say with near certainty that 2023 will be the warmest year on record, and is currently 1.43ºC above the preindustrial average.”

On a local scale the average maximum temperature, considering the rolling 12-month average, has actually decreased 0.6ºC compared with last year at this date.

Looking at the last 10 years the past 12 months have been the 3rd warmest. With a building El Nino it could be assumed that next year will see a greater increase in anomaly here but, 2015 suggests, positive ENSO can actually lead to a decrease. As can a La Nina lead to an increase, as shown in 2022.

The climate system of the world is complicated in that it doesn’t warm uniformly which leads to problems when a sizeable part of a population look out of their windows and see weather that is cold and miserable. That social media lists the ever increasing number of weather disasters around the world doesn’t seem to make a difference.

Governments and agencies have their work cut out trying to convince enough people that we really must better look after the world, starting in our own back yards.

As Burgess adds regarding the United Nations Climate Change Conference later this month: “The sense of urgency for ambitious climate action going into COP28 has never been higher.”

YearRolling 12-month maximum at 7/11Change
201416.58
201515.53+1.05
201616.36-0.83
201715.96-0.4
201816.22+0.26
201916.21-0.01
202016.35+0.14
202115.25-1.1
202217.09+1.84
202316.49-0.6