The Oceanic Niño Index (ONI) jumped 0.4 points, from +1.4 to 1.8, in July, the greatest total in a rising El Nino since that particular index began in 1950.
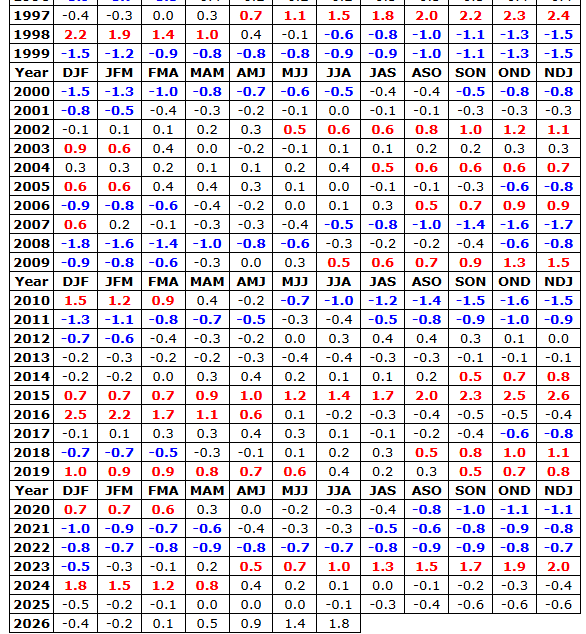
While the effect of ENSO is possibly very little in our latitude a look back at previous events, I think, can provide some guidance about what we might expect later in the year.
The best fit in terms of where we are now and where we were in past Super El Niños is 1997 – though I would guess we’re about a month ahead of that period. Like 1997 the current hurricane season is well below average.
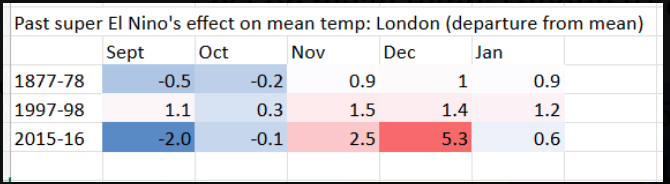
So, with that in mind, the following table can be drawn.
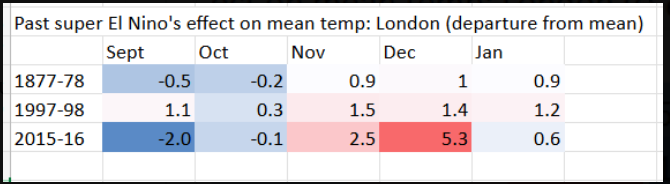
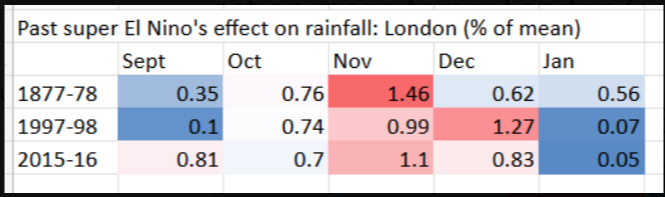
In terms of months it would give:
October: +1C anomaly and very dry.
November: average and on the dry side
December: +1.5C with average rain
January: +1.3C with above average rain
February: +1.2C and very dry.
Broadly, I would expect a very stubborn Azores High to form bringing mild and mostly dry weather the further SE you are in the UK. Obviously this would bring higher risk of Atlantic storms barreling across the Atlantic with heavy rain across northern Scotland.
Any repeat of February 1998 would hail a very early spring and a record early +20C?
As anyone knows you cannot completely write off the chance of snow. One bonus for anyone looking for snowfall may be the persistence of warmth down the US Eastern Seaboard, conditions which tend to favour a quieter jetstream and, hence, fewer storms moving across the Atlantic.


You must be logged in to post a comment.