December 2015 was a ridiculously warm month, the mildest on record in my local series going back to 1797.
The mean temperature of 10.9C is 5.3C above the average for the first winter month and breaks the previous record set in 1974 by an increadible 2.2C.
Indeed the month was warmer than what was a very mild November and was air frost free.
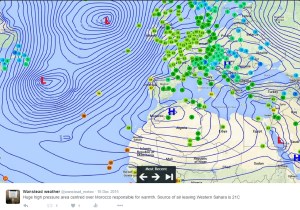
A persistent flow of air from the Azores was responsible for the unseasonal warmth
Sunshine was below average: 34.6hrs (86% of average) was the lowest total recorded since 2010, another December that was as exceptionally cold as this month was mild.
Rainfall was more run-of-the-mill: 44mm fell during the month: that’s 83% of average.
The warmest day occurred on the 19th with 16.3C recorded, the second warmest December day in my daily record going back to 1959 – the record fell short by just 0.1C.
Other daily records were broken including for daily mean temperature: 14.3C on Boxing Day smashed the previous record set on December 4th 1985 by 0.4C. This day also saw the highest daily minimum for December recorded: 13.5C. It was also the warmest Christmas Day on record in a series going back beyond 1852.
The lowest temperature occurred on the 8th when the mercury fell to 2.4C.
The wettest day was on the 3oth when 5.9mm of rain fell. There were only three completely dry days during the month. Thanks to the synoptic situation this area thankfully escaped the awful flooding which affected the north of England and Scotland.
There is quite a marked upward trend in the December mean since 1797
What has January got in store weatherwise? The models today (January 1st) suggest that low pressure will continue to pile into the UK from the west on quite southerly latitudes over the next week with some colder air infiltrating into the east and north of the UK from Europe with rain at times for our area. From that point on most output suggests largely unsettled weather continuing until the end of the two week period though there is a hint that high pressure may try to edge up from the SW or west later with less wind and rain but still mild.
Because of the exceptionally mild December there are virtually no figures I can work with to try to estimate January – but I’ll have a crack anyway, using figures that were at least 1C above the 1981-2010 December average.
A mean of about 5.2C with 59mm of rain, both around average. The highest probability is for average temps at 33% probability. Interestingly something ‘very cold’ comes in at the same probability. Rather mild and rather cold come in at 16% probability. I emphasise that even at such low probability my confidence is even lower.
My December outlook for temperature was way off – there was no chance shown of anything ‘very mild’.
Here follows the full weather diary for November. To view full stats follow this link:http://1drv.ms/1kiTuzv
1st: A few spots of rain after deluge overnight then cloudy.
2nd: Cloudy to start, some sun mid morning before it clouded over with two spots of rain. Mild overnight.
3rd: Cloudy start with little brightness all day. Rain moving in at 7.15pm and intermittent into the evening, clearing later with temp falling from midnight.
4th: Sunny, clear start, tending to cloud over at 11am with limited brightness.
5th Cloudy and windy all day – the wind peaking at 9pm but remaining fresh through the night.
6th: Cloudy and dull most of the day.
7th: Cloudy start with some light drizzle mid morning.
8th: Dull, drizzly start with steadier bursts. Heavy rain as front cleared through at 2pm. Evening and overnight much colder than of late.
9th: Sunny start, clouded over afternoon.
10th Cloudy start and through the day. Rain spreading in in the evening, clearing by midnight.
11th: Cloudy through the day until 2pm when a narrow band of rain passed through then dry and feeling cooler.
12th: Cloudy start with some drizzle around 10am.
13th: Cloudy and drizzly to start then just cloudy.
14th: Cloudy start with some brightness at noon. Cloudy into the afternoon with some drizzle overnight.
15th: Cloudy and dull. Rain later in the evening.
16th: Cloudy with two sunny intervals then cloudy with odd drizzle.
17th: Cloudy with odd brightness then rain at 5pm.
18th: Cloudy all day.
19th: Bright and breezy start.
20th: Dull start with heavy rain at 3.40pm. Then cloudy but clear by morning.
21st: Sunny start but quickly clouded over with rain.
22nd: Dull start with patchy drizzle up to 11.30am. More rain later with squall at 8pm.
23rd: Sunny start with cloud moving in then sunny spells.
24th: Sunny start quickly turned cloudy with heavy rain around noon, clearing to sunny spells.
25th: Cloudy start with light rain spreading in at 10.10am. Cloudy rest of afternoon with temperature climbing through the day for record warm Christmas day. Temp didn’t fall below 14C all night.
26th: Cloudy and warm all day. Temp fell to just 13.9C though the day then rose again to give the warmest December night on record, and also warmest December mean.
27th: Dull with brief burst of drizzle early then breezy and very mild. Clearer overnight and cooler than of late. Sunny start with pink clouds am.
28th: Sunny start with just a few cirrus. Mostly sunny through the day.
29th: Sunny start with brief heavy shower at 10.05am. Then sunny intervals.
30th Cloudy and breezy to start. Rain spreading in in the evening, stopping around midnight
31st: Sunny and clear to start but with cloud bubbling up from late morning. Brief rain after dark then dry and turning colder. Frost in early hours of 1st
Tornadoes, earthquakes, heavy rainfall, abnormally low temperatures, pea-souper fogs and exploding meteors are phenomena that marked the Year Without a Summer around the world 200 years ago. But how did London fair?
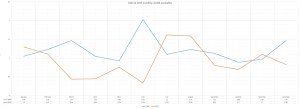
The monthly anomalies of the two years closely follow the same pattern between March and August
When extreme weather affects Britain, such as the floods plaguing northern England and Scotland, conditions in the capital are benign by comparison.
There is not a great deal written in the press about the weather in London in 1816. So, as ever, Luke Howard’s The Climate of London, is a primary reference point.
After a wild end to 1815 that was marked with snow and lightning 1816 started dry, cold and frosty. Though cold by today’s standards January 1816 was fairly average and much warmer than the previous two when the last Thames frost fair was held.
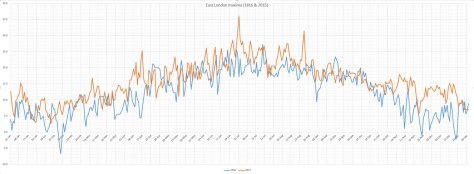
The highs and lows of 1816 and 2015 compared
Though the temperature reached 10C on 10th the rest of the month was marked with maxima around 6C and the odd frosty night.
Cold weather returned at the end of the month, turning severe in the second week of February. In the early hours of the 7th heavy snow, driven by gale-force north-easterly winds, brought possibly some of the worst winter weather this area has ever seen. Some 35mm of precipitation is recorded on the 8th – this would normally give at least one foot of level snow that could obviously be whipped up into huge drifts.
Luke Howard described the scene in his diary entry saying the abundance of snow “loaded the trees to their tops and weighed down the smaller shrubs to the ground.”
The snow and polar continental air also produced perfect conditions for a textbook radiative cooling night. The minimum recorded on the 10th: -20.6C has not, as far as I can tell, been repeated since.
To put that into perspective the lowest minimum of the severe winter of 1963 for this area was -12.2C recorded at Greenwich on January 21st. The coldest night I have personally recorded was -10.3C on January 12th 1987.
As often happens with severe cold snaps Howard reported on the 17th the the snow “was mostly gone but very thick ice remains on ponds”; a period of just under a week.
The cold snap saw the mean temperature for February over three degrees colder than average at 0.8C.
As well as keeping meticulous observations in Plaistow, Stratford and Tottenham, Howard always kept an eye on what was going on abroad and noted that earthquake activity was high.
On February 2nd an earthquake that ‘lasted nearly three minutes’ was felt at Lisbon. Three days later an earthquake was felt on Madeira.
“At midnight a severe shock of an earthquake was felt all over the island and the following morning at 4 o’clock another shock was felt.”
An extract of a letter from Captain Welsh of the Claudine described an event of an earthquake felt at sea on the 9th.
On the 9th of February off St Michael’s we experienced very tempestuous weather with a tremendous confused sea. The wind shifting from SW to SE and NE with constant lightning and heavy rain. On the 10th at 8.30pm, the ship then under reefed fore sail and mainstay sail, we were much alarmed by a severe shock of an earthquake which lasted four or five seconds.
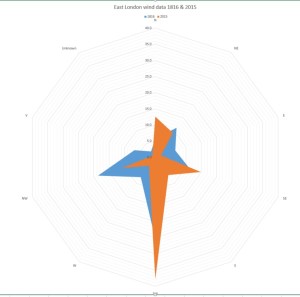
The dominant wind direction in 1816 was north-west
Later in the month on 23rd it was reported that the snow in the Grampian hills was at its greatest depth for 20 years.
Howard reported a heavy short snowstorm in the capital on March 4th. He also mentions another earthquake on March 17th that affected the north of England in towns and cities including Doncaster, Bawtry, Blyth, Carlton, Worksop, Sheffield, Chesterfield, Mansfield, Nottingham, Lincoln and Gainsborough.
“A smart shock of an earthquake was perceptibly felt in Lincoln at about 12.50pm. The undulation appeared to be from west to east and lasted from about a minute and a half to two minutes.
“Pictures and other articles hanging on the walls were set in a swinging motion. At Newark also and the neighbouring villages the shock was distinctly felt as well as at Leicester and Loughborough.”
Snowy episodes in the capital lasted well into April. On 12th snow fell for two hours “turning the high ground of Hampstead in the distance white”.
Very high tides were reported on the 15th with “much water out in the marshes”. By the 19th it was noted that the growing season was being severely hampered by the cold weather
April 1816 was nearly 1.5C below average. Despite this, by the 21st, the first swallows began to appear.
May and June were again cold. More than twice the average rainfall in June suggests the weather in the sixth month was very disturbed.
On the 25th a tornado, strong enough to carry objects weighing 60lbs, was reported in the Edgware Road area.
At two o’clock being a still sultry day a whirlwind passed over the nursery ground of Mr Henderson in the Edgware Road which lifted seven lights from the greenhouses and carried them to the height of the highest elm trees, each of the lights weighs 50 or 60lbs at least. At the same time two garden mats were carried to an immense height so that the eye could not distinguish them.
The following day “extremely heavy and prolonged rain from 9am (26th) to 9am on 27th gave 2.95 inches”. This total of over 52mm is notably high though not a record.
Overseas, meanwhile, the weather continued to confound observers. Several inches of snow fell in Quebec on June 8th while a letter from a friend of Howard mentioned a reading of -38F that had been recorded in New Hampshire earlier in the season.
July and August were similarly cold and wet. While events in London had quietened down Howard noted that the Kendal Chronicle was reporting snow on the summit of Helvellyn on July 4th while notable gales in Scotland were affecting ships.
More earthquakes shook locations around the world including one on August 14th in Scotland that caused panic and considerable damage in Inverness. Howard quotes a letter from north of the border:
“Last night, exactly a quarter before 11 o’clock the town of Inverness and the surrounding country was fearfully shook by an earthquake. We fled to the street where we found almost every inhabitant; women and children screaming and a very considerable portion of them naked. Many fled to the fields and there remained for the greater part of the night. Chimney tops were thrown down or damaged in every quarter of the town. The Mason Lodge occupied as an hotel was rent from top to bottom, the north sulk of the chimney partly thrown down one of the coping stones weighing, I should think, from 50lb to 60lb, was thrown to the other side of the street a distance not less than 60 feet.”
Elsehwhere in Europe the dreary summer and frequent thunderstorms inspired Mary Shelley to write Frankenstein. A summer vacation in Switzerland led her to spend much of the time indoors. She, along with Lord Byron and John William Polidori entertained each other with a contest to write the scariest story of all. The unseasonal conditions, along with this dare, led to the creation of Shelley’s Frankenstein: The Modern Prometheus— as well as Polidori’s novella The Vampyre and Byron’s long-form poem, The Darkness.
Though it is known as the Year without a Summer 1816 was actually only the 8th coolest summer in the local series going back to 1797. There were also 21 wetter summers – the 250mm that fell was actually less than half the rainfall of summer 1960.
1816 & 2015 compared: monthly rainfall anomalies
A change of month in September failed to bring a change in the weather and the mean temperature continued 2C below the average for the period. Howard mentions a 9-week tour of Europe at this time – his laboratory and climate reading duties left in the hands of his friend and partner, John Gibson.
Howard’s account of his tour explains how excessive summer rains had made life difficult from Amsterdam to Geneva.
“From the sources of the Rhine among the Alps to its embouchure in the German ocean and through a space twice or thrice as broad from east to west the whole season presented a series of storms and inundations. Not meadows and villages alone but portions of cities and large towns lay long underwater; dikes were broken, bridges blown up, the crops spoiled or carried off by torrents and the vintage ruined by the want of sun to bring out and ripen the fruit.
“While the middle of Europe was thus suffering from wet, the north for a time and to a certain extent was parched with drought and public prayers appear to have been ordered about the same time at Riga for rain and at Paris for sunshine.”
On September 16th Howard noted that a ‘dreadful’ hurricane had affected the Caribbean island of Guadalope. “Houses were levelled, plantations destroyed and the soil driven about like dust in a whirlwind.”
October 1816 was a blip during 1816 in that the mean temperature and rainfall were about average though Howard’s records reveal there were four air frosts.
By November the weather began mild but by the 6th the cold had returned with a brief snowy snap. A report from Chester said that day was almost night because of the thickness of the cloud:
“Candles or lamps were obliged to be lighted in all the houses this was succeeded by a slight shower. On Thursday successive falls of hail and rain took place. On Friday the frost was uncommonly severe and on Sunday the snow which fell was above 2ft deep in the streets.”
On the 14th reports came from France that a tempest on the night of the 11th and 12th had wrecked many ships: “winds blowing from the north then SSE”.
Chesterton House, off Balaam Street, Plaistow, was the home of Luke Howard from 1806-13. The building has since been demolished
A solar eclipse on the 18th was followed by a sustained build in pressure from the 22nd with fog now becoming a problem in the capital.
The Evening Mail on November 27th reported that the problem was particularly acute in South London.
“The atmosphere was so darkened yesterday morning in the vicinity of the metropolis by the thick fog combined with smoke that in some parts it appeared like a cloudy night. In the neighbourhood of Walworth and Camberwell it was so completely dark that some of the coachmen driving stages were obliged to get down and lead their horses with a lantern.”
After the average October November had reverted to type and the month in London finished just over 3C cooler than average.
Pressure began to fall with the arrival of December. On the 12th reports of a meteor were made from Glasgow and Perth. The phenomena sounded spectacular:
“The meteor made its appearance in the SW in the form of a small star and gradually increased in magnitude till it reached the zenith when it subtended an angle nearly equal to that of the full moon. In shape it resembled a paper kite. After passing the zenith it again seemed to diminish in size owing no doubt to its gradually receding from the observer till its altitude was equal to about 30 miles when it exploded like a sky rocket. The report of the explosion, which is described as more tremendous than the noise of the loudest thunder, reached the ear about three minutes after the meteor vanished so that it could not be less than 40 miles distant and probably about 27 miles above the surface of the earth. From the various particulars collected its diameter must have been about 240 yards. The light which it yielded was very considerable being sufficient to render the smallest objects visible.”
Two days later the air pressure fell to its lowest point that year: 966.1mb. In the early hours of the 15th Howard wrote of an earth tremor that lasted 15 seconds.
A brief cold snap arrived on the 19th with the temperature falling to -10C on 21st – by the 26th, however, the temperature reached 10C.
Though December was relatively milder than November the month still finished 1.5C below average with 1.5 times average rain.
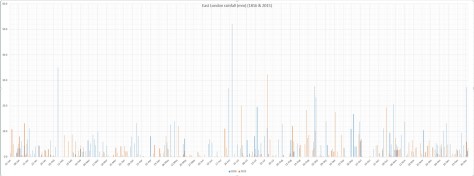
1816 & 2015 compared: East London maxima1816 & 2015 compared: East london minimaEnter 1816 & 2015 compared: East London rainfall
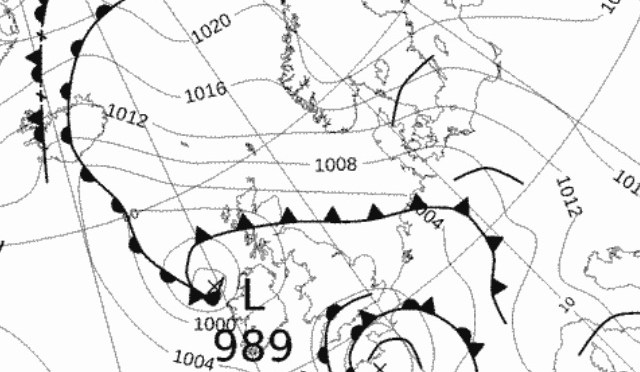
The synoptic chart from 7am on November 3rd 1940 showed a deep depression crossing the country that brought over 40mm of rain to Greenwich Image: Courtesy of Met Office
November 1940 was the wettest on record for this area. Over 170mm of rain fell in Greenwich, beating the previous record set over a hundred years before in 1836.
Other areas of London were even wetter: Croydon was wettest with just under 196mm while Addington recorded just under 194mm, Bromley 179mm and Regent’s Park 175mm.
Nearly a quarter of the month’s rainfall fell on the 3rd. The total of 40.8mm is a daily November record that remains to this day. Indeed, throughout the month, there were falls of more than one inch (25.4mm) somewhere in the London area on four days: 40.8mm (3rd, Greenwich), 26.7mm (4th, East Ham), 26.4mm (11th, Camden Square), 27.4mm (13th, Southgate).
In Wanstead and Woodford the inclement weather coincided with a 6-day pause in bombing incidents during the Blitz. November was a very cyclonic month that probably hampered German air operations.
Another 6-day pause in the bombing happened after November 16th. When the Luftwaffe returned on Saturday, November 23rd, it was Wanstead that bore the brunt. At 4.12pm, as light was fading on a dull, dreary afternoon, high explosive bombs caused fires at and partly demolished nos 78 and 89 New Wanstead. A minute later another bomb ruptured water and gas mains in Spratt Hall Road. At 4.30pm a further high explosive bomb fell in the High Street, killing 4 people. The raid ended at 5.16pm as a bomb fell in Fitzgerald Road though this time there were no injuries.
By now the weather was beginning to quieten down though weeks of deep depressions with associated gales and heavy rain had taken their toll – many residents reported problems of Anderson bomb shelters being constantly flooded – but it was probably the design as much as the weather that was to blame.
As pressure built in the last few days of November the first frosts of winter arrived but the bombs returned. High explosive devices fell in Woodford New Road and Bunces Lane on the 30th, fracturing a water main.
To put November 1940 into some sort of perspective the average fall for the month in this area, with regard to the 1981-2010 average, is 59mm. The closest this area has come to matching the record was 2009 when 150mm was recorded and preceded a cold winter.
The following synoptic charts are for each day of November at 7am. All courtesy of the Met Office
This September was the coolest since 1993. The average mean of 13.4C is 2C below average – a surprising statistic given that the month ended with many bright and sunny days with respectable temperatures. But, with the wind in the east, caused by an anticyclone anchored to the north of us at the end of the month, the air was dry and allowed temperatures to fall smartly away after dark. The average minimum temperature was just under 8.8C, 2.3C below average and the coldest since 1986.
The month was rather dry: some 42mm of rain fell which is 81% of what we can expect in an average September. The wettest day was the 16th when 17.6mm fell.
Just over 140 hours of sunshine were recorded – that’s ‘on the nose’ of the monthly average and 20 hours more than was recorded during the very dull August.
What has October got in store weatherwise? The models today (October 1st) suggest an end to the fine and sunny weather as high pressure declines and is replaced by a trough moving up from the southwest on Monday. Less clear is how the weather evolves from then with the majority of models showing this feature opening the door to a lengthy period of SSW winds and possible rain at times. However, the rain would become more restricted to our northwest as pressure builds from the continent. So a return to something more autumnal looks likely though temperatures will remain on the mild side, especially at night.
This chart shows the low pressure system that brought September wettest day for this area
My long range outlook method suggests that October will be average temperature will be average temperature-wise, a mean of about 11.8C, at 44% probability. The next highest probabilities are for something cool, at 22% probability. Something rather cool or very cool comes out at 11%. There appears no chance for a mild month.
The highest probability for rainfall is 33% for something rather wet: between 84mm and 100mm. The next highest probabilities is for an average, rather dry and dry October at 22%.
My data for sunshine only stretches back to 1878. The signal is inconsistent so I would guess sunshine will be average.
My September outlook for sunshine was good in that I estimated that there was a 60% chance of average sunshine. Less good was the finding that there was only a 23% chance of a dry September – the highest probability was for something average. And my temperature estimation put the probability of a rather cool September at only 14%. So, all in all, not great.
Here follows the full weather diary for September…Full stats for the month here:http://1drv.ms/1rSfT7Y
1st Cloudy start though with some brightness. Small shower mid afternoon which was the edge of large storm that affected Essex.
2nd Sunny bright start though with lots of cloud from noon. Lots of convection.
3rd Cool, cloudy start. Some brightness but feeling cool in the wind. A few spots of rain.
4th Bright start with some sunshine tempered by the breeze. Mostly cloudy all day.
5th Light rain to start with brighter spells. Problem of being on the edge of high pressure. A sunny afternoon.
6th Sunny start with just a few clouds during the day.
7th Sunny start but cloud gradually increased during the day.
8th Cloudy start, overnight ‘rain’ was dew. Mostly cloudy all day. Warm overnight.
9th Cloudy start but a few holes appearing as the day wore on and sunshine at 1330.
10th Sunny start though with cloud bubbling up sunny spells followed. Clear with heavy dew overnight.
11th Sunny start with wispy cirrus – more cloud bubbling up during the day.
12th Cloudy start over overnight rain. This breaking up toward late morning to leave a sunny spells afternoon.
13th Cloudy start – this breaking up toward noon to leave bright afternoon. Some rain overnight.
14th Cloudy start, rain arrived soon after 10am and lasted over an hour. Then bright spells and more showers through the day and into the evening and overnight.
15th Cloudy start with heavy shower moving in at 12.30pm. Showers cleared through to leave cloudy early evening.
16th Cloudy start with rain spreading in at 12.30pm. Some heavy bursts through the day. Rain all the way in to work and torrential rain coming back from school at 5.30pm. Bursts through the evening and light drizzle was falling on way home at 1am, tending to peter out.
17th Sunny start tending to cloud in more.
18th Bright but cloudy start with clouds bubbling up. A heavy shower by 1pm.
19th Sunny all day with odd cloud. Warm in sun.
20th Sunny all day, any cloud decreased.
21st Spots of rain just before obs time. A mostly cloudy day. Heavy, showery rain between 5.30am and 7.30am.
22nd A cloudy, chilly day with rain after noon.
23rd Sunny, gin clear start. Clouding over by 2pm with rain at 1am.
24th Bright start after rain overnight. Sunny spells developing – a late shower at 1534. Dry and clear overnight.
25th Sunny start though with cloud bubbling up the sun disappeared at times. Cold overnight with a heavy dew.
26th Sunny and clear to start, though with cloudier periods through the day.
27th Sunny clear start with a few clouds bubbling up through the day. Mostly clear for lunar eclipse totality at 3.11am.
28th Sunny start with long clear periods during the day.
29th Mostly sunny with just some cirrus.
30th Sunny start with just a few cirrus. Stronger breeze than yesterday.
This August was the third dullest since 1881. I’ve seen mentioned recently that August used to be regarded as an autumn month. For the past couple of years the final ‘summer’ month has been very disappointing for anyone looking for fine weather – much more akin to September or even October.
A storm in south London gave this eerie light seen at Southwark Bridge on the 5th
The first third of the month began pleasantly enough with a couple of days exceeding 27C. And on the 22nd the temperature reached 31.4C, only the third occasion that the mercury has risen above the 30C mark this summer. But summery highlights were few and far between.
Just under 120 hours of sunshine were recorded – that’s 62 per cent of the monthly average, the dullest August since 1968.
There were six occasions when the maximum exceeded 25C. Mean temperature for the month was 18.2C, which is on the nose of the 1981-2010 mean. Rainfall of 79.8mm was 159% of average. The wettest day occurred on the 24th with 18.4mm of rain.
What has September got in store weatherwise? The models today (September 1st) suggest a very slow progression of high pressure ridging into the UK from the west this weekend. Until then a cool northerly flow will persist with a mix of sunshine and possibly heavy showers. Most models suggest that by the end of the week a trough will run south, bringing a spell of cloud and rain before high pressure from the west eventually cuts off the cool northerly, replacing it with little or no wind, warmer sunny spells by day and misty nights – typical late summer / early autumn weather. Models then split over what will happen with the high next week. It could stay settled or, according to the ECMWF and GFS, the start of a breakdown could happen at the end of next week.
The synoptic chart shows the frontal set up that brought the greatest daily rainfall on the 24th
My long range outlook method suggests that September will be average temperature-wise, a mean of about 15.4C, at 52% probability. The next highest probabilities are for something rather warm and warm, both at 14% probability, though something rather cool also comes out 14% probability.
The highest probability for rainfall is 45% for something average. The next highest probability is for a dry September, at 23%. Rather wet works out at 14%.
My data for sunshine only stretches back to 1878. There is a 60% chance of average sunshine in September.
My August outlook was OK – I went for an average to rather cool August. I also said there was a 73% chance of a duller than average August – so not bad overall.
Here follows the full weather diary for August…Full stats for the month here:http://1drv.ms/1rSfT7Y
1st Bright but hazy start. Cloud gradually thinned to give a sunny afternoon with just a few clouds. Warmer.
2nd Sunny start with decreasing cloud.
3rd Sunny start quickly turned cloudy and blustery with brief burst of rain at 4pm. Then dry with variable cloud overnight and breezy.
4th Bright start but lots of cloud around and breezy. This lasting through the day.
5th Cloudy start, a few bright intervals and a strange light as thunder clouds passed to the south. Some light rain.
6th Cloudy start but cloud thinned to become sunny just before 2pm. Then variable cloud through the day with another eerie sunset.
Many places around the coast recorded far more sunshine than Wanstead, typical of the type of weather experienced in August
7th Sunny start though was very cloudy at times.
8th Bright start and cloud quickly melted away to leave a stunning, sunny day in Sussex and Camber. Some cloud was seen a few miles inland but even this eventually melted away. Night turned chilly with heavy dew by dawn.
9th Sunny until 3pm then a bank of cloud brought cloudier spells. Warm overnight.
10th Bright start with sunny intervals. A burst of rain at 2pm damped the ground then it was mostly cloudy for the rest of the day.
11th Cloudy, calm start, spits and spots of rain before more organised rain in evening.
12th Cloudy start then brief sunny spells late morning before clouding up again. Warm front stalled over South Coast dumping 32mm on Herstmonceux.
13th Cloudy with rain spreading in late morning, this lasting until 3pm with odd burst of drizzle for rest of night. Some 78mm in Polegate and flooding reported in Brighton.
14th Cloudy and very humid with some brightness late morning. Showers returned at 3.30pm then more general rain arrived at 8pm.
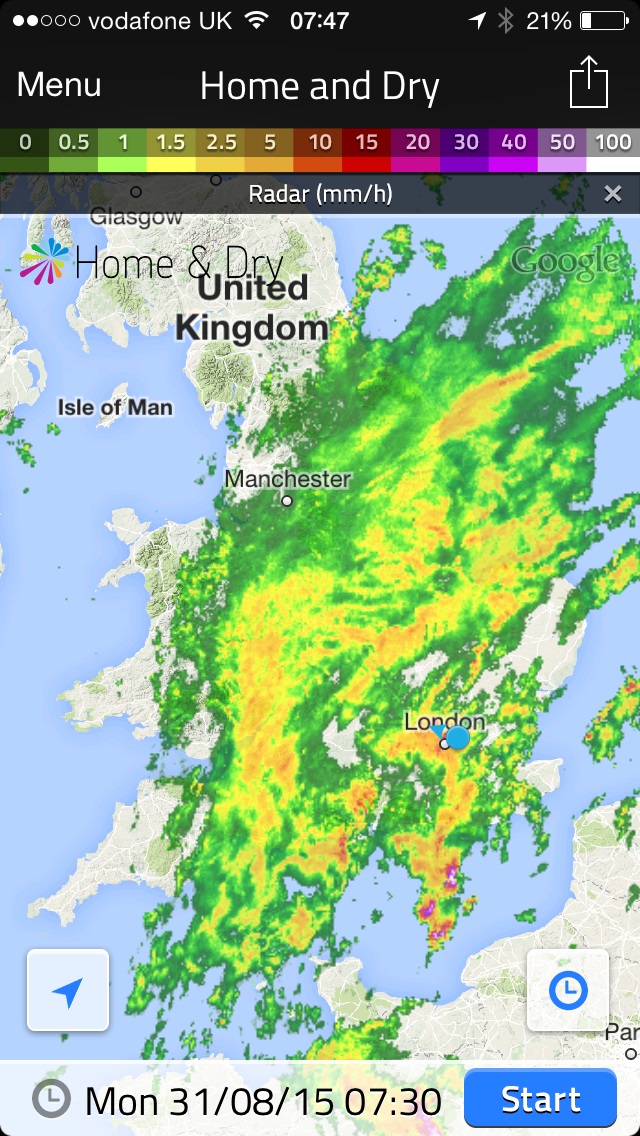
This radar shows the area of rain that brought over 10mm to Wanstead on 31st
15th Sunny start, clouded over at 2.30pm but then became sunny again at 5.30pm. Clear spells overnight.
16th Sunny start then cloudier in the afternoon. Very still air though made it feel pleasant.
17th Sunny start then cloudier around lunchtime. Sunny spells late afternoon though sun didn’t feel that strong.
18th Sunny start though quickly clouding over and dull. Some spots of rain on way to airport but dry in Wanstead.
19th Sunny start then going downhill with rain in the evening and overnight.
20th Bright start, clouding over.
21st Bright start before breaking to sunny spells and warm.
22nd Long sunny periods and 3rd occasion of 30C.
23rd Bright start but cloud built to give rain between 12.45 and 2.45pm.
24th Dull, rainy with rain between 9am and 11am.
25th Rain between 1pm and 3pm. Showers overnight then more general rain at obs time.
26th Dull and rain morning with squall blowing through at 1.30pm. Brightening up by 5pm then some bright spells late afternoon.
27th Bright start but with heavy cloud present. A brief shower in the afternoon before a clear evening made it chilly overnight.
28th Sunny start with light breeze, tending to cloud over middle part of the day. Skies cleared again to give sunny, pleasant evening.
29th Sunny start, cloud filled in by 3pm then rain arrived at 4pm, with moderate bursts.
30th Cloudy and humid start. Cloud stuck around all day – airless and therefore felt pleasant.
31st Cloudy start after overnight rain. The rain soon returned after 10.20am and fell, often heavily through until 12.30pm.
The title of this monthly review is probably very misleading as July was a month that blew hot and cold.
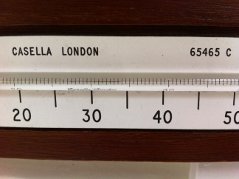
The Casella ‘check’ thermometer registered 35.8C on July 1st – 0.3C lower than the AWS reading, within the contraints
The start of the month began with the July all-time record being set: 36.1C. The month ended with a couple of very chilly nights: 6.9C in the early hours of 31st with a grass minimum of 4.5C. I haven’t yet been able to go through my records but, according to the Met Office, temperatures in southern England on the same night that fell to 1C represent an all-time low July record.
There were ten occasions when the maximum exceeded 25C. Mean temperature for the month was 18.6C, 0.1C above the 1981-2010 mean and the coolest July since 2012. Rainfall of 70.4mm was 162% of average though it is worth noting that three quarters of this was recorded on two days.
There were 174 hours of sunshine recorded in this area which is 91% of what we can expect to see during an average July. The wettest day occurred on the 24th with 32.4mm of rain. There were two days of thunder recorded.
So what has August got in store weatherwise? The models this morning (August 1st) suggest very little change in the overall pattern of things. The jet stream is still well south across the Atlantic and is likely to remain so for the forseeable future. However, because we are on the eastern side of the troughed flow across the eastern Atlantic this allows the potential for some very warm or even hot conditions to be drawn up across the UK in the coming five days and possibly beyond. However, the longer projections turns the flow more west to east across the south of the UK again returning cooler air to the SE as well in week two.
This means a continuation of changeable conditions as low pressure remains anchored in the north-west or north of the UK. Thunder could be likely.
In contrast to the models my long range method suggests that we are in for a rather cool August, about 1C below average, at 41% probability. The next highest probability is for something average at 27% probability. So an average to rather cool August works out at 68% probability.
Rainfall is uncertain. There is the same probability for dry (50% average) and very wet (175% average): 23% probability. However, the next highest probability is for average at 18%.
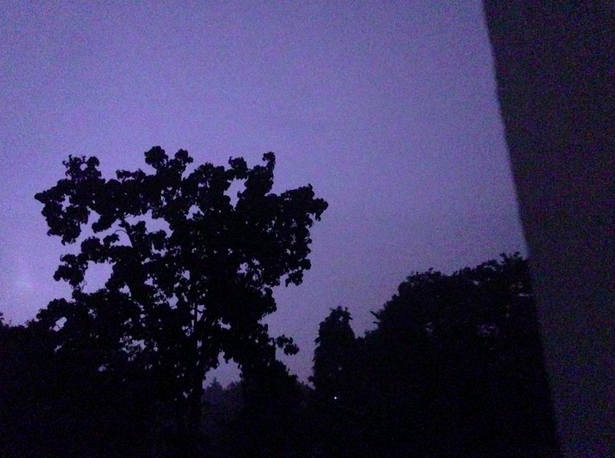
This grainy image shows distant lightning illuminating a cloud. The storm was centred over St Albans on July 16th
My data for sunshine only stretches back to 1878. There is a 73% chance of a duller than average August.
My July outlook was very poor, I predicted a rather warm to warm month – but it was nothing like last year’s or the 2013 classic. My rainfall and sunshine predictions were also hopelessly out. However, it was the first month since January that my temperature forecast has been wide of the mark. It’s just weather – in that it frequently doesn’t do what you think it’s going to do.
Here follows the full weather diary for July…Full stats for the month here:http://1drv.ms/1rSfT7Y
1st: Sunny until after midday when cloud bubbled up and took edge of temperature. Hottest July day ever was set at 5pm. Breeze made it feel bearable.
2nd: Sunny start though cloud quickly built with rain at midday. Just 0.3mm fell which evaporated on impact with the hot ground.
3rd: Sunny, clear day though humidity began to build from mid afternoon with the appearance of cloud. Still sunny spells till late into the evening. Big thunderstorm from around midnight for an hour.
4th: Sunny and muggy start. Long sunny spells, hardly a cloud in the sky until later. Sunny dawn but rain arrived at 9am.
5th: Light rain to start. This cleared late morning to sunny spells. Feeling muggy.
6th: Sunny start though lots of fair weather cumulus bubbled up.
7th: Cloudy start with light patchy rain around 11.30am, clearing to sunny spells. Some rain after 9am.
8th Cloudy and blustery with rain in the air. A few showers around.
9th: Sunny with just a few clouds, low humidity. Sky completely cleared after 3pm for a gorgeous evening.
10th: Sunny start. Some cloud bubbling up as jetstream neared – lots of cirrus and then cirrocumulus forming. Turned sunnier late afternoon. Also dawned clear and sunny.
11th: Long sunny spells with just a few cirrus and cumulus at times. Feeling warm and humid. Some light rain around midnight but not amounting to much.
12th: Cloudy and comparatively cool compared with recently. Light rain at 5pm with drizzle in wind through evening. More rain at 7.30am that fell intermittently up to obs time.
13th: Light rain to start with bursts through morning to 10.45am. Further bursts of light rain into early afternoon then overcast and muggy all night. More drizzle early am.
14th: Drizzly start – this continued into late morning. Then overcast and muggy. More drizzly burst overnight into the early hours – drizzle was persistent from 8.30am to 9am.
15th: Sunny intervals after light drizzle.
16th: Bright and sunny spells tending to turn more cloudy after midday. Big electrical storm around midnight with 67 flashes per minute seen to the north-west.
17th: Light drizzle to start turned to bright spells and a pleasant summer’s day.
18th: Sunny start with cloud bubbling up late afternoon. Light rain shower at 8.30 at end of Music in Wanstead Park and again in early hours at 6am.
19th: Sunny morning tended to cloud in at midday before cold front cleared to leave sunny evening. Mackerel sky at dusk with light rain at 8.15am.
20th: Showery rain to start.
21st: Sunny start but clouds bubbled up through the day for long sunny spells. Warm with a breeze.
22nd: Sunny start, cloud bubbling up during the day with spots of rain at 5pm – heavy shower in Wanstead.
23rd: Cloudy with occasional bright spells, feeling humid.
24th: Drizzly start. rain started falling at 11am. Outbreaks of prolonged rain through the day, heaviest between 5pm and 6pm. More rain after 8pm but then a drier interlude before more rain at midnight as occluded front came back. Last tip of the gauge just before 4am.
25th: Sunny and breezy though much cooler. A pleasant evening at John’s party though. Cloudy spells overnight before rain moved in at 9am.
26th: Rain to start with heavy outbreaks up to 1pm. Further outbreaks of rain through the day and into the evening.
27th: Drizzly bursts of rain to 11am. Then dry and bright.
28th: Bright and breezy to start. A light shower in evening then cool and clear – sunny start.
29th: Bright start but cloud filling in. Burst of rain at 8.30pm then variable cloud overnight.
30th: Bright but a burst of rain just after 10am. Then mostly cloudy with a few bright breaks.
31st: Sunny start but cloud filled in.
The hottest July day on record was recorded at Heathrow airport on Wednesday 1st. The 36.7C recorded between 1500 and 1530 exceeded the previous record of 36.5C set at the Royal Horticultural Garden at Wisley, Surrey, in 2006.
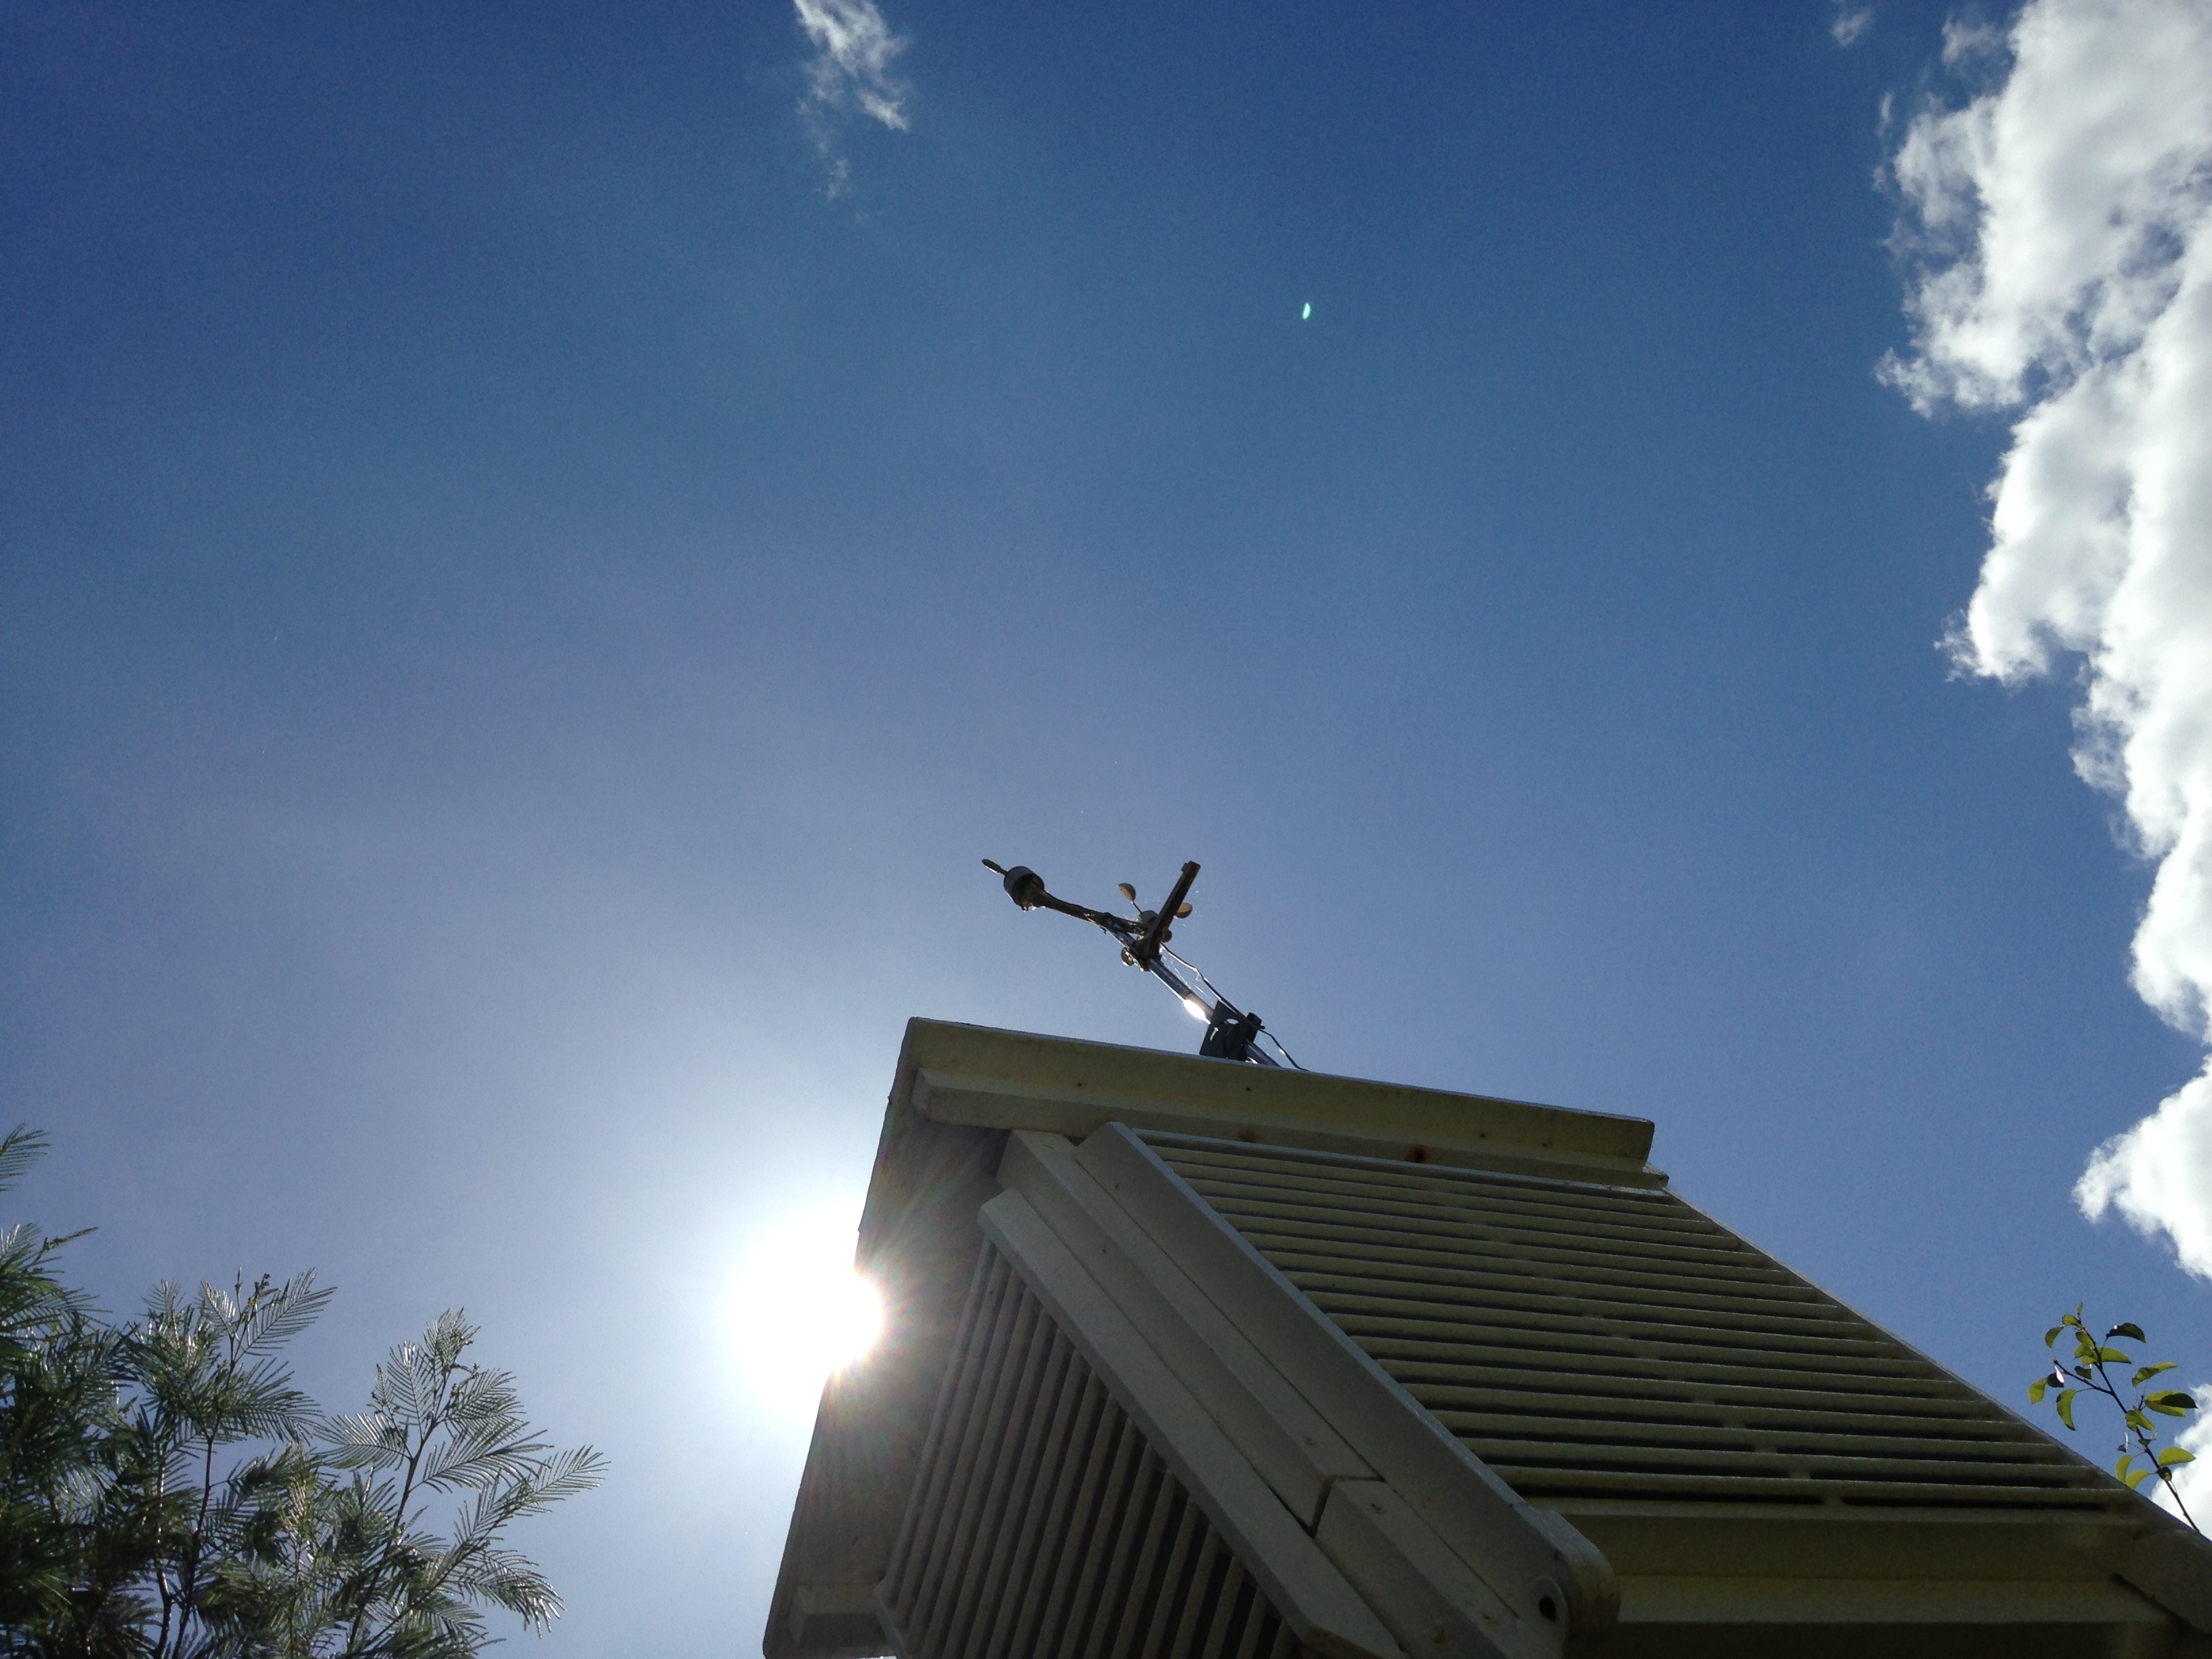
The meteo is sited on the Aldersbrook Estate and uploads data to the web every 10 minutes, 24 hours a day
I recorded 36.1C in Wanstead, a reading that exceeded the previous July record of 35.9C set in 1868 – indeed it was the fourth highest temperature this area has seen since local records began in 1848.
Already, however, questions have arisen over the validity of the Heathrow value mainly because the official measurement far exceeded that of Northolt, an airfield and the closest official station, which recorded 35.7C, a full degree cooler.
I’ve always been a bit sceptical on the validity of airport readings – there’s a lot more concrete at Heathrow than Northolt and obviously far more jet engines. The previous July record at Wisley is surely far more representative of standard conditions? I fear that with a new runway Heathrow will only get hotter and, perhaps, a review of the official MetO station should be taken.
I’m often asked why my own station is not used for official readings. The simple answer is that, being in a suburban garden, it is too sheltered to qualify for the open exposure that the Met Office demands.
But, apart from the exposure, everything is as representative as possible to conditions set by the Met Office. When readings differ it is simply because the character of the area is warmer or colder than official stations, the closest of which is St James’s Park.
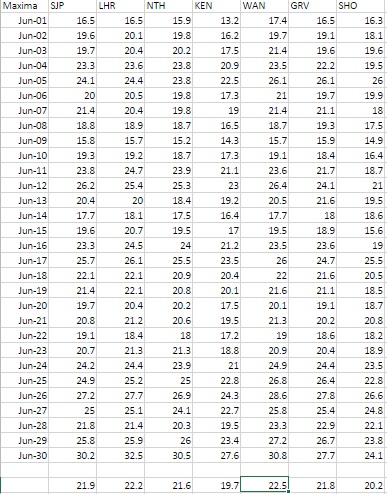
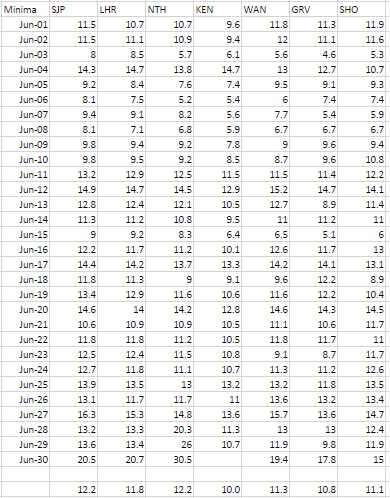
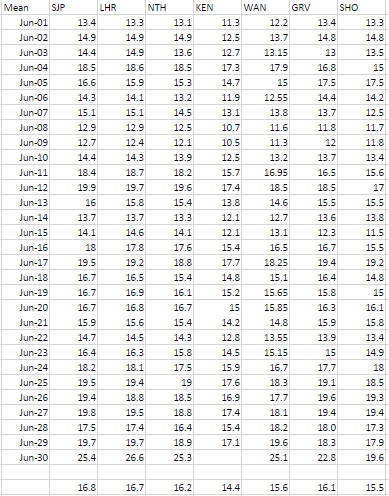
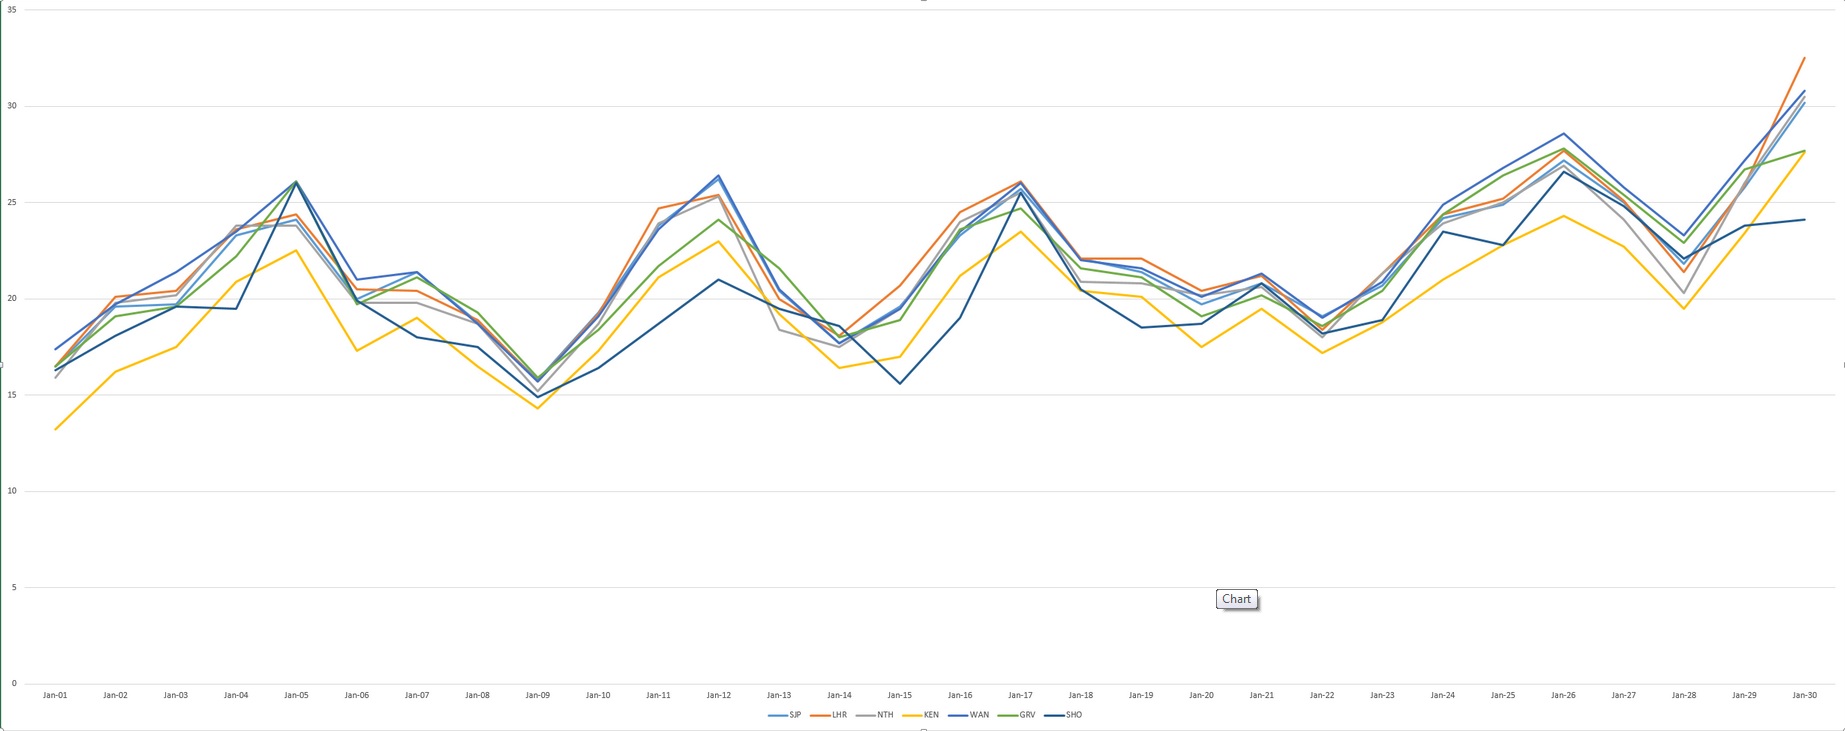
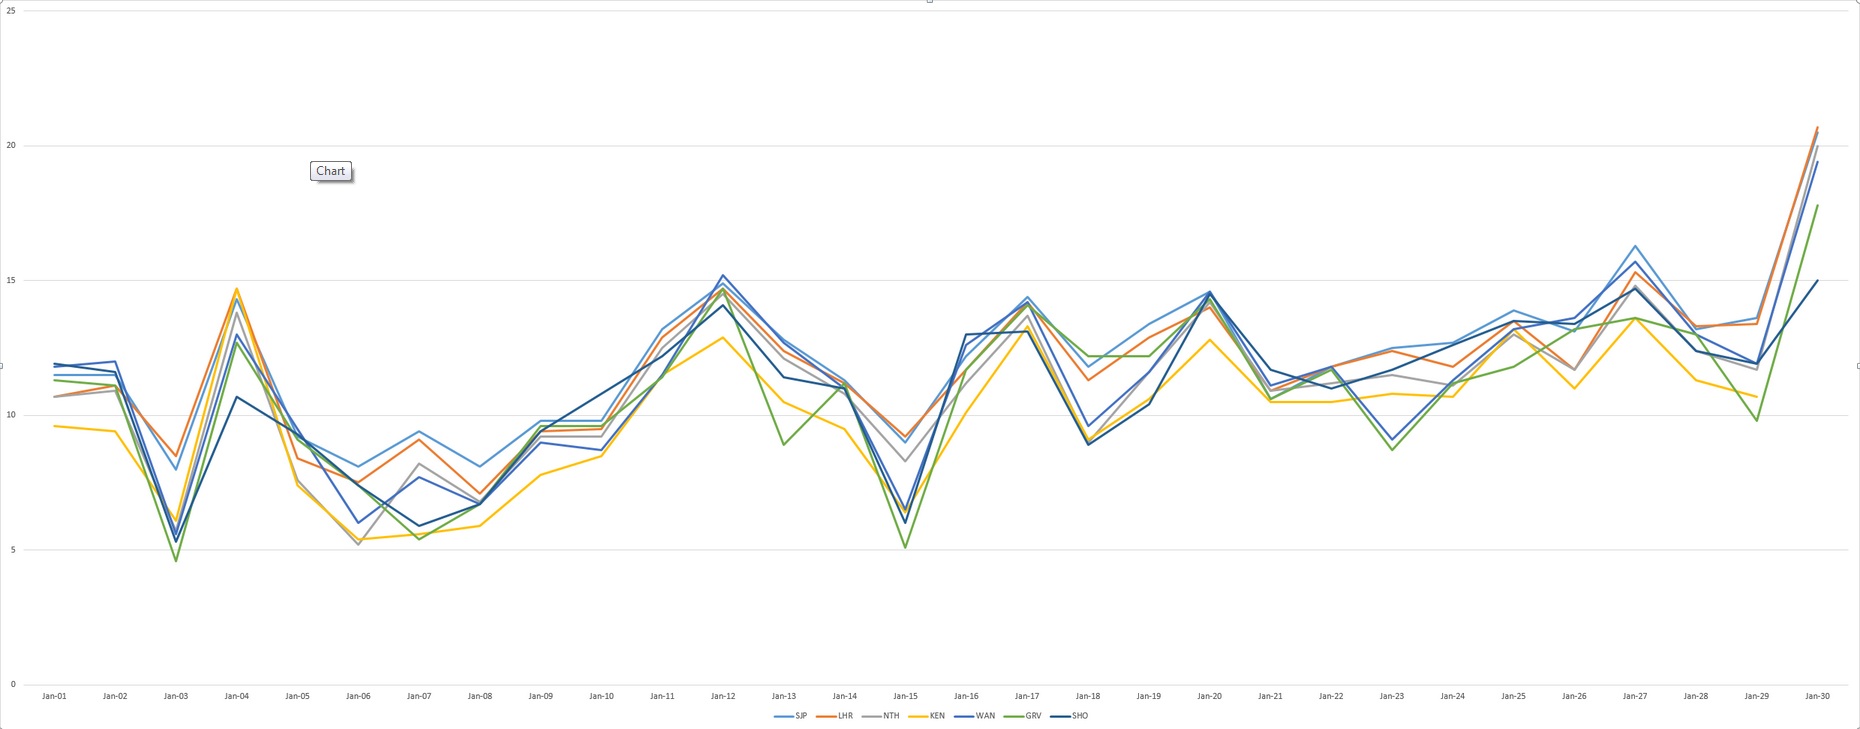
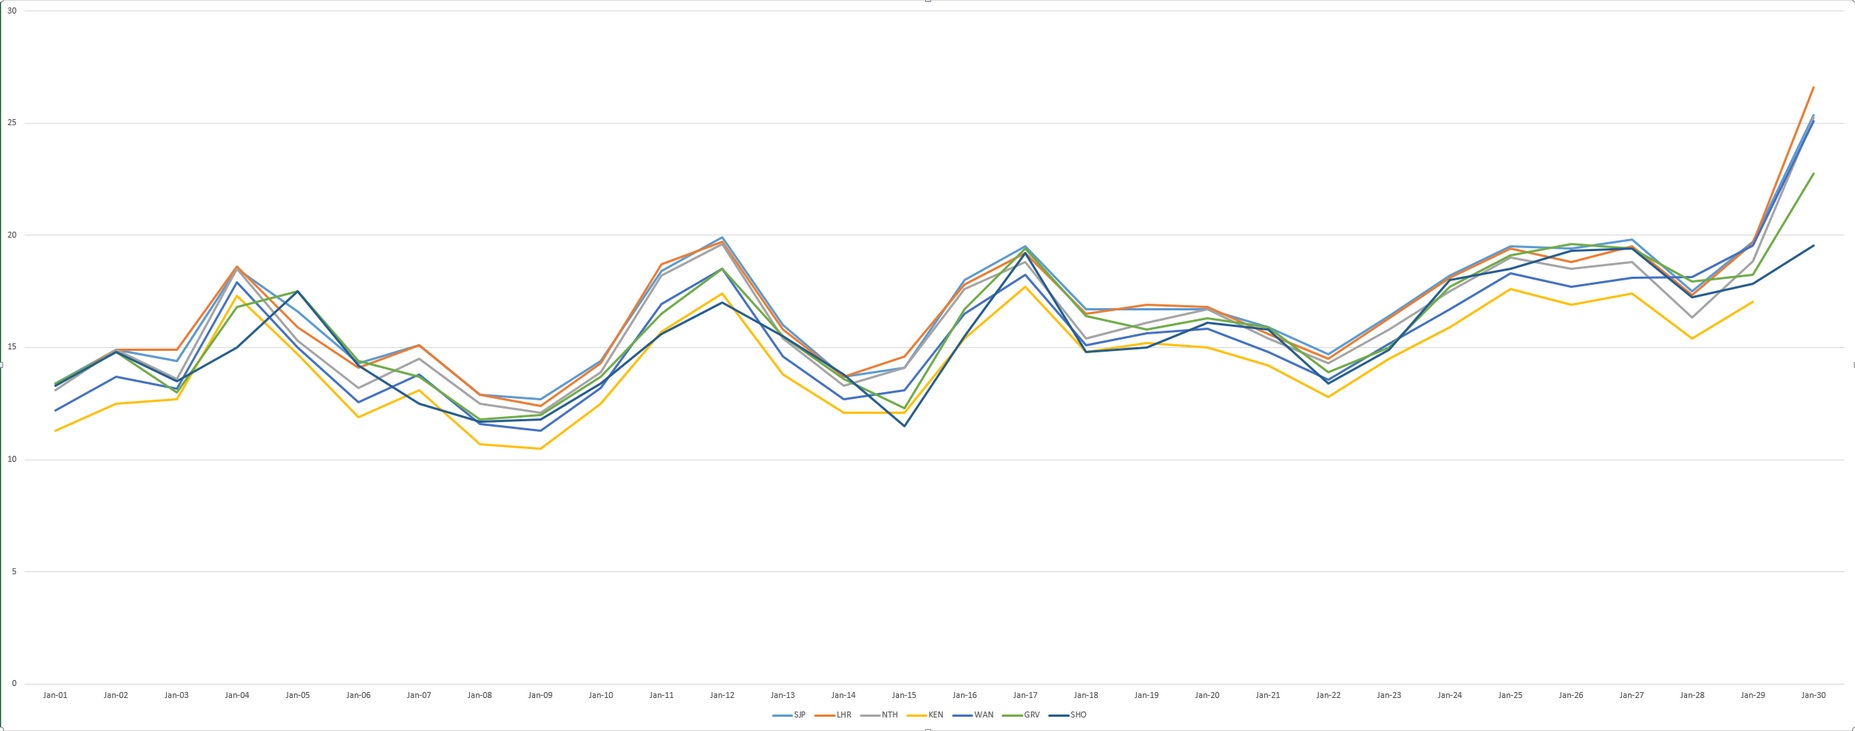
Maxima for stations near Wanstead SJP: St James’s Park, LHR: Heathrow, NTH: Northolt, KEN: Kenley, WAN: Wanstead, GRV: Gravesend, SHO: ShoeburynessMinima for stations near Wanstead SJP: St James’s Park, LHR: Heathrow, NTH: Northolt, KEN: Kenley, WAN: Wanstead, GRV: Gravesend, SHO: Shoeburyness
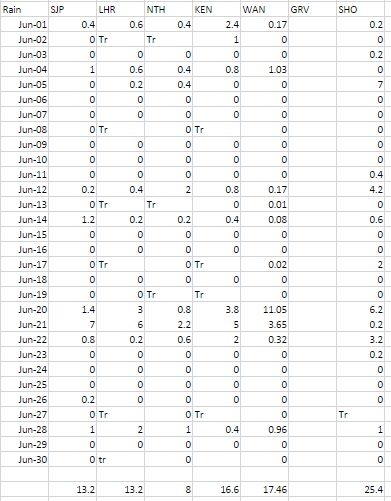
To try to quantify this I’ve had a look at all the official stations around Greater London throughout June. The results show that readings from Wanstead are remarkably similar to other stations.
I first had a look at maxima which revealed that Wanstead is 0.3C warmer than Heathrow and 0.6C warmer than St James’s Park.
Mean for stations near Wanstead SJP: St James’s Park, LHR: Heathrow, NTH: Northolt, KEN: Kenley, WAN: Wanstead, GRV: Gravesend, SHO: ShoeburynessRainfall for stations near Wanstead SJP: St James’s Park, LHR: Heathrow, NTH: Northolt, KEN: Kenley, WAN: Wanstead, GRV: Gravesend, SHO: Shoeburyness
Minima, on the other hand, revealed that Wanstead was 0.5C cooler than Heathrow and 0.9C cooler than St James’s Park – a stark illustration of how much warmer inner London is than the suburbs.
This obviously had a bearing on the mean temperatures of the region, Wanstead being 1.1C cooler than Heathrow and 1.2C cooler than St James’s Park.
In terms of rainfall Wanstead was wettest, but only by 4mm.
So, all in all, the weather station at Wanstead is a pretty good measure of our local climate, as close as possible to what official conditions for measurement of climate demand.
I am currently in the process of trying to find a site local to the area that will fulfil Met Office conditions but it is a long, drawn-out process that will take time to organise.
Maxima for stations near Wanstead SJP: St James’s Park, LHR: Heathrow, NTH: Northolt, KEN: Kenley, WAN: Wanstead, GRV: Gravesend, SHO: ShoeburynessMinima for stations near Wanstead SJP: St James’s Park, LHR: Heathrow, NTH: Northolt, KEN: Kenley, WAN: Wanstead, GRV: Gravesend, SHO: ShoeburynessMean for stations near Wanstead SJP: St James’s Park, LHR: Heathrow, NTH: Northolt, KEN: Kenley, WAN: Wanstead, GRV: Gravesend, SHO: Shoeburyness
If you like thunderstorms Wanstead seems to be leading something of a charmed life these past couple of years.
The storm at 23:43
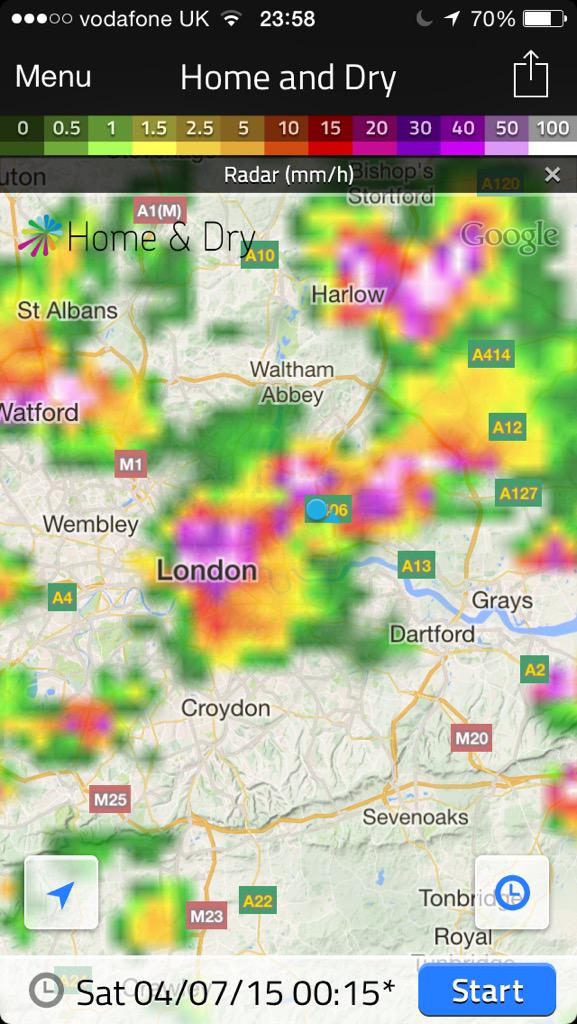
Two years ago I wrote a blog asking what had happened to decent summer thunderstorms that were so common during my youth in the 1980s. Last night was the fourth time Wanstead has experienced a really good light show, complete with multiple lightning strikes and Hammer Horror-esque thunderclaps. The first storm passed over at 23:43, delivering 3.7mm rain at a rate of 20mm/hr. Another followed shortly after at 23:58, a pressure trace revealed a 1mb fall as the storm passed through. Nothing special as I have seen a 6mb drop in similar circumstances. By this time the sky was alive with lightning – yet again I failed to capture any lightning bolt but did manage to photograph my garden at the moment night became day – the world’s most powerful flashgun!
The radar picture of the storm at 23:58What would you give for a flashgun this powerful? The storm at its peak at 00:22
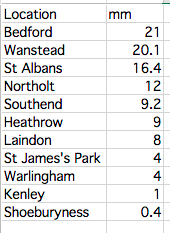
At 00:19pm occurred the brightest flash of lightning almost instantly followed by a very loud crack of thunder, the kind you hear on those Hammer Horror films with Peter Cushing. Looking at the rainfall of weather stations around the south-east it appears that Wanstead was in the thick of the action, clocking up 20.1mm of rain and second only to Bedford. The amount represents 47% of what normally falls in an average July. As always in these situations some places get a deluge while others remain almost dry.
There was 112,833 lightning strikes across UK & Ireland between 9pm and 9am on July 4th Image courtesy of Blitzortung
Looking further afield around London an observer in Blackheath reported an hour to 90 minutes of ‘roaringly good storminess’ that brought a house party to an abrupt end. He counted 15 flashes of lightning a minute, lots of CC but a few CGs too, including one close as the storm kicked off.
Elsewhere an observer in Highams Park reported 30 flashes per minute. In Dorset another observer 50mm of rain, most of which fell in an hour. The storm that tracked over the Salisbury region had what seemed like 3x the lightning of the storms in the SE corner.
Forecasting of the event was handled better by some agencies than others. For location accuracy the MeteoGroup discussion had an edge over the Met Office.
The Trappes (Paris) ‘loaded gun’ ascent for July 3 can be found here – warm / dry layers between 900 and 800 hPa and ~2000 J/kg of CAPE, with high CAPE values expanding aerially as the trough neared. Approach of the trough caused cooling aloft – not sufficient for the capping inversion to break around Paris itself but farther west and north.
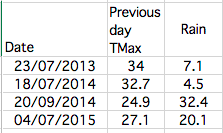
Lightning streamers were visible moments before each thunderbolt. These come out of the ground to meet the main bolt – a sure sign that Wanstead was right underneath a cellA pressure trace at 11am on July 4th shows the peaks and troughs during the stormThis table shows the most notable thunderstorms that have passed over Wanstead during the past two years
June finished hot in complete contrast to the opening few days which were a continuation of a disappointing May.
There were six occasions when the maximum exceeded 25C – the highest being 30.8C on 30th, the warmest June day for four years.
Mean temperature for the month was 16.9C, 0.8C above the 1981-2010 mean. Rainfall of 17.5mm was 34% of average – the last three Junes have been notably dry.
There were 189.5 hours of sunshine recorded in this area which is 106% of what we can expect to see during an average June. The wettest day occurred on the 20th with 11.1mm. There were two days of thunder recorded.
So what has July got in store weatherwise? The models this morning (July 1st) suggest a battleground between Atlantic cooler air and hot continental air, a common feature at this time of year. The persistent heat on the continent looks like it will waft back and forth across the south-east – creating the risk of thundery downpours as it meets resistance from successive cold fronts.
Just 17.5mm of rain fell in June – 34% of average
The model output suggests the Atlantic air will eventually win through, allowing more changeable conditions in a week’s time. There is also a signal that high pressure will re-establish with a return to fine and very warm weather. As things stand the models remain finely balanced.
In contrast to the models my long range method suggests overwhelmingly that we are in for a warm July, up to 1.7C above average, at 60% probability
The next highest chance is for rather warm at 40% probability. If you add the probabilities together the chance of a rather warm to warm July can be put at 100% – perhaps a repeat of last year’s and 2013’s classic July is about to unfold?
Rainfall is looking below average, at 60% probability. There’s obviously a risk here that a couple of direct hits from thunderstorms would see the monthly total exceeded. I don’t have enough data to estimate sunshine but I would guess average to slightly above.
My June outlook was only good in that it ruled out any chance of a very warm month – the final mean was rather higher than I thought. I was also out with the very low rainfall – the signal was for something average. Sunshine was broadly average as I’d estimated
The Heronry Pond in Wanstead Park is suffering from low water levels again
1st Sunny, bright start quickly turned cloudy with intermittent drizzle through the day. Turned windy at 6pm and was really blowing around midnight.
2nd Drizzle in the wind at obs time and very windy, wind only decreasing by evening. A dreadful day though warm.
3rd Sunny start though cloud gradually increased. Feeling humid and summery at last.
4th Sunny start with cloud dotted with alto cumulus and cirrus. Rain between 5am and 6am – though storms passed to our west and east.
5th Bright start after earlier rain – the thunderstorms seemed to pass to our west and east. Very humid and felt oppresive in the morning.
6th Sunny start with cloud bubbling up. Much cooler and fresher feel. Lots of long sunny spells.
7th Sunny, gin clear start. Just a few fair weather cumulus all day. Gorgeous.
8th Bright start though alto cumulus shaded early sun. Variable cumulus after that – feeling chilly.
9th Cloudy and brisk wind from NE. Feeling chilly.
10th Bright start with sunny intervals throughout the day.
11th Sunny start with few cirrus, sky then completely cleared.
12th Sunny start though cloud bubbled up through the day – felt very close at sports day. Distant thunder heard at 8pm with light rain – much less than was threatened.
13th Cloudy start, mostly calm, still and dull – a real nothing day though some late brightness after 2pm pushed up the temperature briefly. Mild overnight with some light drizzle before obs time.
14th Drizzle in the wind up until 11pm and falling temp. Then a brief sunny interlude before it was cloudy again.
15th Cloudy start then briefly clearing before, at 1pm, more cloud appeared. Clear overnight allowing temp to fall until 4.10am but clouding over by morning – bright warm sunshine at 9am.
16th Sunny start but very cloudy at times. This continued all day – though the night was cloudier hence warmer.
17th Sunny start but with lots of cloud around.
18th Lots of long suuny spells but cooler than yesterday.
19th Cloudy up until 11.30pm and cooler. Broke to sunny spells and much warmer at 2pm.
20th Bright start though warm from started pushing through just before 1pm. Some sunny breaks but rain pushed in. Was in Cheltenham but Woodford Wells reported thunder: Between 1650and 1730 12mm fell followed by a decreasing amount of 2.4mm up to 1814 all BST Two thunder claps at 1715 and 1728.
21st In Cheltenham it was a mostly cloudy day though with more sunny intervals after midday. Rain spread in just before midnight with more in the early hours.
22nd Cloudy start though with brief sunny break at 10am. Some drizzle 11.15am then drier with sunny intervals.
23rd Bright start. Cloud broke to give warm sunny spells .
24th Sunny periods after a rather cloudy start. Felt very warm in the sun during walk around London with Neil and family.
25th Sunny start though hazy cloud developed from 10.30am, rather obscuring the sun at times, though it was bright all day. 26th Warm till late into the evening – still 18C at 11pm.
26th Bright start though cloudy, broke to sunny spells and felt warmer than forecast.
27th Sunny start though with cloudier spells all through the day. A very warm evening.
28th Sunny start quickly became cloudy with rain turning up at noon during early lunch. This later cleared to sunny spells and a pleasant afternoon.
29th Sunny start though with high cloud obscuring the sun at times.
30th Sunny, gin clear all day. only ‘cloud’ was distant grass fire.
The 30th was wall-to-wall sunshine until late in the evening when alto-cumulus and cumulus were observed
The media are always keen to say ‘a heatwave is on the way’ when it is more likely to just be a short spell of fine weather with temperatures a few degrees above average.
The Daily Express, which usually goes over-the-top when there is any sign of heat on the horizon, has been relatively quiet of late
Forecasts of 30C and above see editors up and down the land reaching for their stock pics of office workers and kids enjoying ice creams in parks.
‘Hotter than the Costas’ and other hackeneyed headlines are wheeled out as photos of scantily-clad women frolicking in the sea at Brighton illustrate this amazing fact – the more ubiquitous shirtless lorry drivers on the capital’s roads never seem to make the final editions.
So how do you quantify a heatwave? Even in an average year the UK normally sees at least one spell of very warm weather that can often feel much warmer than it actually is.
Looking at data for the London area stretching back to the early 1800s there has been plenty of hot spells, including the summer of 1808 where birds reportedly ‘dropped out of the sky’ from heat exhaustion.
The term ‘heatwave’ does not appear in any publication in the British Newspaper Archive until 1867. The Manchester Courier and Lancashire General Advertiser on May 11th 1867 features a letter from Mr R.H. Allnatt. Writing from the British Hotel, Jersey, he states that “…the atmosphere became most oppressive. A heat-wave seems to have passed over the island, and from noon till sunset the thermometer stood in shade at 90 deg.”
The World Meteorological Organization’s description of a heatwave is “when the daily maximum temperature on more than five consecutive days exceeds the average maximum temperature by 5°C, the normal period being 1961-1990″. Though it has no official definition the UK Met Office, working with the Department of Health, provides a ‘Heat-Health Watch System’ for England which is triggered when a threshold temperature in the South East is 31°C by day and 16°C overnight for at least two consecutive days.
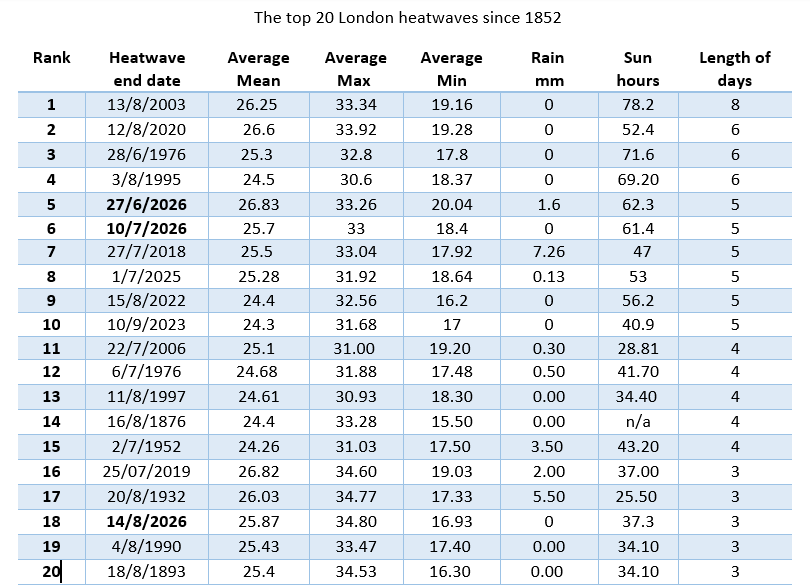
A mean daily temperature of 23.5°C or higher has been achieved in this area on 199 days since 1852. To qualify for the Met Office’s Heat-Health Watch System the list, which goes back 163 years, narrows. However, to make my job easier, I have narrowed the list further to 3 consecutive days where the mean has been 23.5°C or higher. Though I loathe really hot weather in my experience I can put up with it for a couple of days. It is only when it gets to the third day of hot, sleepless nights that it starts becoming unbearable.
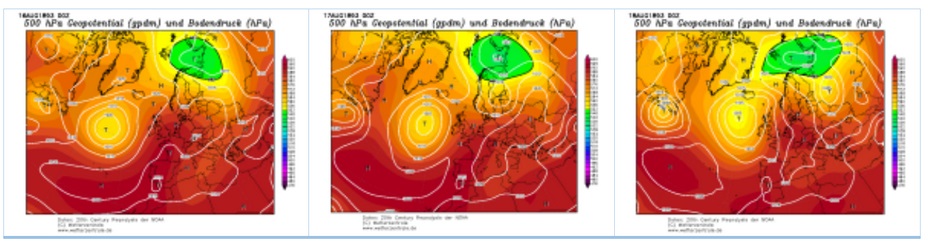
The 500mb renanalysis chart of the heatwave of August 1876
The first heatwave that fits my parameters, and ranks 7th in the heatwave premier league, began on August 13th 1876. Obviously in those days news would have taken a while to filter through. On the front page but tucked away at the bottom of the far right column of Reynolds’s Newspaper on August 20th a report talked on “excessive heat in Norfolk”:
“The weather has been intensely hot in Norfolk, and two fatal cases of sunstroke are reported from Blofield. A similar casualty occurred at Thorndon. A spark from a Great Eastern Railway engine has fired a barley field near Wherstead, Suffolk, in consequence of the extreme drought. The damage done is estimated at £300.”
A report on the “Glorious Twelfth” in the London Daily News on Monday 14th says:
“Not a cloud obscured the burning rays of the sun, and in the middle hours of the day moving about on the moor was not unattended with danger.” The weather was the complete opposite of the previous two years where “rain fell so continuously that only the keenest of the keen ventured abroad”.
500mb reanalysis of the 1893 heatwave
It would be another 26 years before Greenwich would see another heatwave of the same magnitude. Tucked away on page 16 of Lloyd’s Weekly Newspaper on Sunday 20th August 1893 a national round-up column spoke of ‘The Excessive Heat’ of the past week of that heatwave which ranks 11th in the league of heatwaves.
“A farmer, named Calvert, of Barlow, died of sunstroke on Tuesday whilst engaged in harvest work. A man named George Wight fell down in the street at Birmingham on Tuesday, and was taken to the hospital, where it was stated that he was suffering from sunstroke. The intense heat had a remarkable effect on the temperature of the sea in the Channel. A Sandwich correspondent said the water was the warmest it had been for 25 years.”
Several cases of sunstroke were recorded among soldiers from Plymouth Garrison. A regiment from West Riding were ordered off parade while some regiments took the unprecedented step of parading in shirtsleeves. An engine-driver, when running the express into Stoke station, became seriously ill and died directly after his admission to hospital. His death is attributed to the intense heat. Harvesters in Ashford, Kent, also downed tools after a fatality and several cases of sunstroke.
National newspapers of the day took a broader view of proceedings. The Daily Telegraph‘s assumption on the cause of the heatwave and prognosis of conditions was actually better than it is today.
“Not more than twice or thrice in the present century probably has heat as intense and persistent as that now registered been experienced in England. Since Saturday, when announced the formation of an anticyclone over the British islands, there has been a nearly constant and slowly progressive increase of temperature, until yesterday the maximum thermometric reading of the year so far was attained, 90 degrees in the shade being recorded at the Meteorological Office, Westminster.”
The Times on the same day remarked on how people were dealing with the intense heat:
“Such is the force of habit that the social mechanism still keeps working, though nobody really cares for anything except the heat. In the shops, in the Stock Exchange, even in Parliament, people meet and go through the form of doing business, but their langour tells its own story — that the sun has been too much for them.”
The paper describes a “great thunderstorm that had kept everyone in the south of England awake a week earlier” that was assumed to have been the end of a hot summer. But the heat built again.
“Sunday was one of the most exhausting days in human memory; and Tuesday and yesterday, at all events in London, were days to be remembered and quoted. Nothing more like a Italian scirocco has ever been felt here than the west wind which blew at midday yesterday. Very scientific thermometers, indeed, pretend that the heat was nothing exceptional, but the skin, the brain, and the temper of the average man told a different story.”
It would appear that the return of the heatwave took forecasters by surprise and the paper continues on with a familiar ‘why weren’t we warned’ tone:
“And the worst was that the forecast, to which our excellent Meteorological Office has taught us to look with so much confidence, promised quite other things. It spoke of weather unsettled, thundery, and showery later,” and in the north it promised ” westerly and varying breezes; changeable, showery, thundery, cooler. “What tricks were the barometers playing ? Was Ben Nevis having its little joke, or was the office itself suffering from sunstroke?”
On its front page on Saturday, August 19th, The Yorkshire Evening Post featured a prominent sketch of a City gent Picture courtesy of the British Newspaper Archive
The Daily Chronicle turned its editorial attentions to the “alarming” effects the heat was having on peoples’ attire
“The social effects began to operate at an early stage at Westminster, on temper as well on habiliments. They have now penetrated that last refuge of conventional respectability, the City, where the chimney-pot de rigueur has been dethroned by the straw of comfort, and the waistcoat has actually disappeared before the coloured silk scarf.”
The paper reports of people falling ill with fever in the heat, possibly caused by water supply. While the Thames, thanks to reforms by the County Council, was not smelling Glaswegians close to the Clyde were not so fortunate, the river being “overpoweringly odorous all the summer”.
“We must grin and bear it, as may. We shall grumble when the temperature falls, pretty much as we are doing now. For, Macanlay somewhere says, man is never satisfied with what he has, but is always straining after what he has not. And this is particularly true of Britons and their weather.”
Little is written of the 17th ranked 1906 heatwave that ran from August 31st to September 2nd though a diary note on page 3 of the Portsmouth Evening News on Thursday 6th September said the effect of the heat proved decidedly detrimental to education in Portsmouth. It reports:
“Not that the attendance has fallen off to any appreciable extent as result of the very trying weather, but its effect has been very marked, nevertheless, as the youngsters have proved very heavy and slack, with the result that the lot has been decidedly trying.”
The glorious summer of 1911, surprisingly, did not produce a spell that would satisfy my heatwave criteria.
August 9th, 1911, saw the first incident of 100F (37.8C) being recorded in London. The record beat the previous high on 97F. The report also makes mention that many areas recorded at least 97F
The season, which produced hot weather throughout July and August, is worthy of mention, however, because August 9th saw the first occasion 100°F was recorded in London. Considering the magnitude of this milestone the media of the day seemed reluctant to go overboard with the coverage, simply reporting the facts. The day after the hottest day ever the Dundee Evening Post had some advice on attire for hot weather, including a reported sighting of Keir Hardie in a “duck suit”.
By 1923, a heatwave that placed 14th, reports were going beyond records of temperature and heat-related deaths. On July 16th a reader of the Gloucester Citizen was bemoaning the fact that visitors to London were being subjected to “heatwave profiteering”.
Ice was in short supply and only available in restaurants and cafes and the price of fruit and salad had risen “beyond reason”. The author writes:
“A Fleet Street shop, for example, lemons have suddenly risen from a modest penny to a more formidable threepence, and the explanation is: “There has been an eruption at Etna, you know”. “To point out that the present stock of lemons was received long before Etna began to make its dangerous influences felt is merely to invite a shrug of the shoulders and gesture indicating “take it or leave it.”
The London Letter column in the Hull Daily Mail on Friday 13th July mentions MP’s braving the stifling heat to hear Prime Minister Stanley Baldwin’s statement on European policy, and also “London The Boil”.
“The heat wave continues to keep in its fiery grip. It absolutely dominates the daily lives of our seven million population, whose habits are rapidly approximating to those much nearer the equator. Hyde Park ladies fashionably attired may be seen sitting under sunshades beneath the shadiest trees in their stockinged feet. Their shoes rest beside them on the parched grass.”
“In Fleet Street there has been a long queue, as nondescript as an old-time butter queue during the war ration period, outside a shop where ice cream wafers are sold at the rate of about two hundred a minute. Men are wearing white suits, waistcoats have vanished, straw hats are at a premium. Most of the licensed bars are doing little more than pussyfoot trade in long iced teetotal drinks. An actor appearing in SoThis is London, says that he gets home half-an-hour earlier nowadays. Though the theatre is quite well filled, the audience is too hot to applaud. So the show goes slick through.”
The column, written decades before the advent of air conditioned comfort became the norm, also gives advice on where to keep cool in the capital. Previous favourites had included the cold-storage warehouses along the riverside at Blackfriars Bridge, the Monument and Westminster’s “Byzantine” tower.
“I am quite certain the coolest place in London is in a boat under the stone bridge that spans the Serpentine. Scores of overheated Londoners seek these cool arches. There, if you can crush in, you may smoke a cigarette, in almost too chilly comfort, while London boils just outside.”
The Yorkshire Evening Post on Friday, August 29th 1930 Image courtesy of British Newspaper Library
The heatwave of August 27th – 29th 1930, which ranks 15th,produced another interesting ‘London Letter’ column in the Portsmouth Evening News about too-hot cabs and heatwave profiteering: a greengrocer raising the price of lemons from 1d to 13d, despite there being crates available in storerooms!
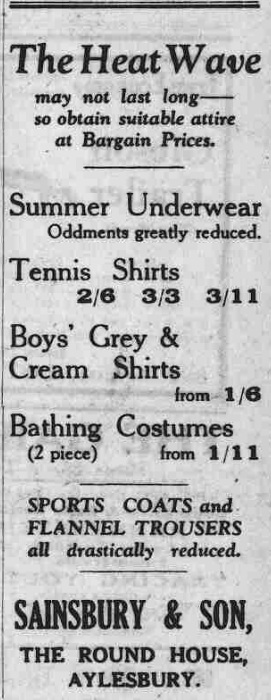
This ‘Sainsbury & Son’ advert appeared on p7 of The Bucks Herald on Friday, August 19th, 1932
Two years later and newspapers were reporting the ‘hottest day for a generation’. The heatwave of August 18th – 20th August 1932 saw the temperature reach 99°F (37.2°C). This heatwave ranks 9th.
“Tragedies attributable to the heatwave were reported from all parts the kingdom yesterday. From the provinces 14 heat deaths were notified. Three cases of suicide which the Paddington coroner said were attributable to the effects of the intense heat and ill health were subjects of inquests Paddington yesterday afternoon.”
The Leicester Chronicle reported cases of heat exhaustion and the curious sight of people carrying home butter in jugs while the 7.25pm and 7.30pm express trains from King’s Cross to the Western Highlands had shower baths installed in sleeping cars to help passengers cope with the heat.
The heatwave of August 6th – August 8th 1947, which ranks 18th, was sparsely reported save for the usual heat stroke casualty stories and the fact that Cheltenham recorded 11 hours of sunshine on one sweltering day.
By 1948 signs of a move away from straight reporting of heatwaves were beginning to appear. An Hour in the Heatwave, a report taken during the hot spell of July 28th – 30th, ranked 12th, was published in the Essex Newsman.
The reporter, Gilbert Saunders, gave a simple but highly readable account of people going about their daily life in the heat.
“In the stadium The other side of the river, where Chelmsford have their stadium, Ted Boxall, private builder, was getting on with a job that he started on Wednesday and hopes to finish by today. He is making a surround and small archway for the counter over which cups of tea are passed to directors and guests in the board room under the grandstand. Ted (who asked : “You’re not mistaking me for Mr. Rowe, are you?”) was surrounded with litter of Essex boarding and sawdust. He paused to wipe a hot brow, explained that he does “lots of odd jobs” for the club. Ted gets a hand from the players when its needed. Earlier this week he finished off two sets of concrete steps, one each side of the grandstand, so that fans will be able to get on the raised ground without having to scramble up the sides of a small mountain of ash and clinkers.”
An hour in the heatwave, published in the Essex Newsman – Friday 30th July 1948
“On the Corner At London Road corner, his face red from the heat but bearing the everpresent grin, Special Constable Thorn clicked and swivelled his 6ft 3in and kept the traffic moving, all unaware that the next day’s Essex Chronicle was already printing a letter suggesting that his courtesy, service, and goodwill should be rewarded with the Freedom of Chelmsford.”
“In the Newspaper Office And inside the building of the Essex Chronicle, Norman White, bespectacled family man, sat down at the side of the roaring press and took a bite at some sandwiches. The first of seven editions was streaming out. “Ought to be pretty early tonight,” he shouted above the din. “With luck we should all be away between half-past nine and ten …… “
The Aberdeen Journal, in its edition published on Friday 30th July, reported on conditions in London and how the population was coping (or not!) with the heat:
“The metropolis last night was like a large restless household—with all the lights ablaze, doors and windows thrown open, the family fretful, and endless pots of tea brewing far into this morning.
“Perhaps one in ten among the 8,000,000 of us slept after midnight. For the rest, we tossed and turned and saw out this heatwave night, when temperatures were never below 71 degrees, a variety of ways. About midnight I walked past the gaunt old Edwardian mansions in Kensington. With the exception the lights that burned from every window, the scene was reminiscent of the early days of the Blitz.
“Families trekked across the roadway in varying stages of undress to their little bits of ornamental gardens. With them went camp beds, bed linen, umbrellas, “in case,” the children, and the household pets, choose a cool open-air camping spot and feel wonderfully adventurous and spartan in the process.”
Yorkshire Evening Post – Thursday 14 August 1947
“At regular intervals the adolescent members of the squatting colonies were dispatched to the tea and coffee stalls on the corner, and perhaps for the first time in years these traders ran out of stocks. On the Kensington-Chelsea boundary, where life becomes noticeably less inhibited and on occasions less swish, a mixed group of young artists was sleeping on the pavement off Fulham Road.
“Round the next corner, where many theatrical and film stars live, several had slung hammocks on their meagre front lawns – one actually suspended between the bathroom windows of two adjacent houses. Midnight street wear for both sexes was cool if unconventional —silk pyjamas, bath robes, tennis shorts, and one in kilt and bathing costume top who could have gone straight into the arena at Lonach.”
The column goes on to describe the situation in the House of Commons where the heat had reached “almost Turkish bath intensity”.
“Some members were in natty tussore silk suitings, but this helped little, and it was many of their number who appealed to the Speaker to have more windows opened. The Speaker, panting like the rest of us, said they were all open. If they wanted more cool breezes from the Thames, members would have to smash the windows.”
More evidence of reportage became evident during the June 1952 heatwave which ranks 8th.
A report on life in the heatwave published on July 5th 1952 Image courtesy of the British Newspaper Archive
Peter Chambers, of the Evening Express, wrote:
“London is hot. It is going to get hotter. That merry mercury column is poking up into the eighties already. That’s what faces us at the height of a heatwave.
“Bus tyres sizzle on the melted tarmac in the streets. At office windows, the girls are pattering away at their typrewriters with damp, discouraged fingers.
“It’s a scorcher. Even the sparrows are panting.”
The reporter describes the scene at London Bridge at 9.30am: “Well, as I came over London Bridge with the 9.30 surge of sweltering suburbia, a bus conductor hopped off his traffic-jammed vehicle and grabbed a couple of ice chips off a Billingsgate lorry. One for him, one for the driver. “What I want, mate,” said the driver ungratefully, “is a ‘ole block of the freezin’ stuff – to sit on.” That is the male reaction to the heatwave.
“The female reaction is typified by the secretary in this office, who buzzes off to the ladies’ room every half-hour to atomise herself with eau de cologne. Ever since she read that fragrant publicity handout, which said “It’s not enough, girls, NOT to be hot and sticky, you’ve got to smell NICE-TO-BE-NEAR…”
The author takes a walk past Embankment and up to Trafalgar Square: “The girls are in topless frocks. Even the men have got their jackets off – a sight abhored further east, where the rigid convention of the City demands that you sweat it out in your dark worsted, regardless.”
At 1pm he finds foreigners feeding the pigeons by Nelson’s Columns and Londoners feeding themselves on bags of strawberries priced at 1/9. By 3pm he’d made it to the Serpentine Lido along with 3,000 other people. He describes at like “Margate on a Bank Holiday”.
The summer of 1959 was glorious but many cool nights saw the season fall short of my 23.5C threshold. It would be a long time before summers were nice again.
The top 6 of my league of heatwaves are all occupied by much more recent events, including 1976 and 1990, both of which are dealt with in the blog I wrote last year – 50 years of London heatwaves. The heatwave that topped them all, in terms of sheer intensity and produced the UK’s hottest day ever, happened in 2003.
I have vague memories of the weeks of sunshine in 1976 but the hot spells that stick in my mind the most are August 1990, when the UK temperature record was set in Cheltenham, Gloucestershire, and August 2003 when an 8-day hot spell saw the all-time UK temperature record broken when 38.5C was reached at Brogdale, near Faversham, Kent.
In terms of length, heat and sunshine, therefore, 2003 comes out on top. Though many people will argue that 1976 is the more impressive summer that year produced two spells that satisfy my criteria, coming in second and fifth. The first heatwave saw temperatures soar above 31° C for six consecutive days from June 23. The start of the second, on July 3, saw Bjorn Borg win the first of five Wimbledon mens’ titles as he prevailed over Ilie Nastase in 35°C heat. The summer of 1995, which saw my driest-ever August with just 0.7mm of rainfall all month, comes in 3rd, with six days of mean temperatures of 23.5°C or higher.
Looking back through history it is not really surprising that 2003 comes out on top. While it was hot in London the heatwave across the Channel contributed to the death of over 70,000 people throughout Europe, France being the most affected.
A complete set of 500mb reanalysis charts have been uploaded and can be watched as a GIF movie
* There were hot spells before 1852 but I have excluded these: Luke Howard’s maxima observations from Plaistow, Stratford and Tottenham were taken under non-standard conditions and may be on the high side. I have instead focused my investigation on data recorded at the Royal Observatory, Greenwich.
** For some reason the data during a couple of years in the 1950s was incomplete – to fill in these gaps I used official data gathered at Kew. The data is completed up to the present day using my own observations taken since 1988.
*** As already mentioned prior to these dates data is unreliable as conditions for collection were not strictly controlled. However, there are many records of extreme heat. On Sunday, August 1, 1868, the Gloucester Journal published a report on the “Heat of previous years” detailing an account of hot spells going back to 1806. “Mr. G. J. Symons gives a number of interesting particulars in reference the heat of previous seasons in this country. We abstract the following
1806: Very hot in parts of June and July. At Plaistow the temperature was 95 degrees on June 10th, and 90 degrees or upwards on three days.
1808: Very hot from July 12th to 19th. On the 12th a thermometer in perfect shade in a window in St James’s Park was 81.5 degrees at 3pm, and on the 13th at the same hour, 94 degrees. On the same day four men and seven women were killed by sunstroke in various parts of the Midland counties, and numerous coach and other horses were also killed. On the 15th a very violent and destructive thunderstorm in Gloucestershire, Monmouthshire, and surrounding counties.
1818:July a very hot month. At Tottenham on the 24th Luke Howard registered 93 degrees at Somerset House on the same day it was 89 degrees, and in the Strand 87 degrees at noon. The mean temperature of that day at Greenwich was 79.2 degrees, which was higher than any other day between 1814 and 1863. The following paragraph appeared in the Gentleman’s Magazine for September, 1818: “It is worthy of remark that the heat of the present summer has been universal. From the north to the south of Europe the heat has been greater and more lasting than for 40 years On July 24th the thermometer here (where!) was 98 degrees, which had never been reached except on July 16th, 1793. At Paris July 31st it was 93 degrees and at Philadelphia 100 degrees.” From 19th to 21st violent thunderstorms in the west of England.
1825: July remarkable, if not unique, in its constant and excessive temperature. At Stratford Luke Howard registered 90 degrees or upwards on seven days, the highest being 97 degrees on the 18th.
1826: The heat was very great. In May the thermometer reached 76 degrees, June 92, July 89, August 85. Two men were killed by sunstroke near London. The fields were as brown as the roads. After two months’ drought the rivulets were gone, and many of the wells dry. The hay crop was deficient from long drought. Country is parched, and corn in some places, though only a few inches above ground, was shooting into ear. Several hills and moors caught fire. In Worcestershire the excessive heat and drought almost wholly destroyed the pasturage, and trees were lopped to feed the cattle.
1846: July 5 was very hot, 93.3 degrees being registered at Greenwich, and 94 degrees at Clapham (94 degrees has been recorded there again in the only other instance at that station.
1852: July of this wet year was remarkably hot, the mean monthly temperature (66.6 degrees) having only been exceeded by July 1778 when it was 67 degrees; and July 1859 when it was 68.1 degrees. Tho extreme heat, however, was only 90.3 degrees at Greenwich.
1857: On June 28, 92.7 deg. was recorded at Greenwich.
1858: June was a very hot day, 94.5 degrees being reached at Greenwich.
1859: Temperatures of 92, 92.5, and 93.0 degrees were recorded at Greenwich.”

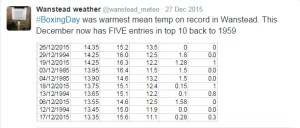
 Other daily records were broken including for daily mean temperature: 14.3C on Boxing Day smashed the previous record set on December 4th 1985 by 0.4C. This day also saw the highest daily minimum for December recorded: 13.5C. It was also the warmest Christmas Day on record in a series going back beyond 1852.
 The lowest temperature occurred on the 8th when the mercury fell to 2.4C.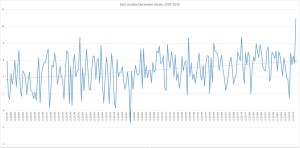























You must be logged in to post a comment.