September was most notable for the amount of cold nights. The record minimum was matched together with three further new entries into the top ten list of extremes back to 1959 – a rare occurrence.
The mean temperature finished 15.2C, 0.2C below average, ending a run of 5 months where the mean has been, at times, well above average.
Some 32.6mm of rainfall was recorded, 63 per cent of the 1981-2010 average. Some 183 hours of sunshine were recorded, 132 per cent of average and more than August!
For the first time in years the autumnal equinox period was very stormy, as shown by this graph.
August was a big let down in a summer that saw the mean temperature nationally match the UK’s best-ever summers.
Summer maxima took a real dip during the first week of August
The mean temperature finished 18.9C, 0.7C above average.
Some 69.5mm of rainfall was recorded, 139 per cent of the 1981-2010 average. Some 169 hours of sunshine were recorded, 87 per cent of average. Apart from being 1.5C warmer than average it was a carbon copy of last August.
July 2018 was the warmest month locally in a record going back to 1797. The mean temperature of 21.7C is 3.2C above the 1981-2010 average and exceeds the previous warmest July (1983) by 0.3C. Indeed, it is the warmest calendar month ever.
MODIS image July 15th 2018
Just 16.7mm of rain fell, all of it coming after the 47 day long drought ended with a thunderstorm on the 27th. The amount is 38 per cent of average and is the driest July since 2010 and 7th driest in the local record.
There were 273 hours of sunshine, 142 per cent of average, making it the sunniest for five years and 10th sunniest on record.
As well as many hot days the lack of rainfall was most noticeable with catastrophic results on Wanstead Flats.
The warmest day occurred on the 26th with 34.7C.
The wettest day occurred on the 27th with 7.3mm falling.
This June will probably be most remembered for the lack of rainfall throughout the month. I recorded just 0.7mm of rain over the 30 days – the driest June in a local record going back to 1797, 0.4mm less than the previous driest June in 1925.
A fire on Wanstead Flats on Friday 29th was quickly extinguished thanks to the fire brigade
As I write this the area is now experiencing its 24th day of ‘meteorological drought’ conditions with little prospect of anything heavy anytime soon. The month was in stark contrast to May which saw may downpours associated with thunderstorms.
It was a warm month. The mean temperature finished 18.1C, exactly 2C above average, though slightly down on last June and the 7th= warmest since 1797.
Some 231.4hrs of sunshine were recorded, 130 per cent of average, making it the sunniest May for 8 years, and the 30th sunniest since 1881.
The warmest day occurred on the 25th with 30C.
The wettest day occurred on the 9th with 0.4mm falling.
Summary for June 2018
Temperature (°C):
Mean (1 minute) 17.7
Mean (min+max) 18.0
Mean Minimum 12.3
Mean Maximum 23.8
Minimum 6.4 day 12
Maximum 30.0 day 25
Highest Minimum 17.8 day 18
Lowest Maximum 17.9 day 04
Air frosts 0
Rainfall (mm):
Total for month 0.7
Wettest day 0.4 day 09
High rain rate 4.0 day 09
Rain days 1
Dry days 29
Wind (mph):
Highest Gust 18.3 day 14
Average Speed 3.1
Wind Run 2199.7 miles
Gale days 0
Pressure (mb):
Maximum 1029.9 day 21
Minimum 1008.2 day 14
Days with snow falling 0
Days with snow lying at 0900 0
Total hours of sunshine 231.4
Elsewhere in the UK it has been a very dry month across England.
Two CET stations, Rothamsted and Pershore recorded 2.2mm and 10mm respectively.
This May will probably be most remembered for the number of thunderstorms affecting the area. I recorded an unprecedented (in my memory) four consecutive days of thunderstorms.
Convective clouds build over Wanstead Flats
It was also warm with a couple of days making the top 10 of hottest days since 1959. The mean temperature finished 15.1C, 2C warmer than average, the warmest May for seven years and the 8th= warmest since 1797.
Rainfall at 65.5mm was 128 per cent of average and slightly drier than last year.
Some 244hrs of sunshine were recorded, 134 per cent of average, making it the sunniest May for 7 years, and the 11th sunniest since 1881.
Spring finished with a mean temp of 11C, 0.8C above average, 1C cooler than last year. Rainfall at 181.9mm, was 135 per cent of average, making it the wettest spring for 10 years. Sunshine of only 411.2 hours made it the dullest spring since 2006.
I normally headline these monthly reviews by referring to the most notable weather but this April, often a fairly non-descript mid-spring affair, offered pretty much every type of weather.
The mean temperature finished 11.7C, 1.9C above average and the warmest for four years.
Rainfall was 55mm, 129 per cent of average and the wettest for 6 years.
Sunshine was just 110 hours, the dullest for 40 years and the 16th dullest since 1881.
Hidden in the positive monthly anomaly was the warmest April day in a local record going back to 1959: 29.1C on the 19th – a figure that represents a positive anomaly of 15.5C and occurring at the start of the warmest April heatwave since 2011. It was remarkable that such an anomaly happened so close to a record negative anomaly the previous month.
Yet, just over a week later, temperatures lurched cold again with one of coldest last days of April on record. Though the 24hr record wasn’t broken the noon-6pm record going back 60 years was beaten.
The wettest day occurred on the 9th with 10mm falling.
Air frosts: 0, Ground frosts: 1
April 30th provided a timely reminder after the heatwave to ne’er cast a clout till May is out. A low pressure system in the North Sea brought a thoroughly miserable day though even more rain fell across the Channel.It was a month with some amazing sunsets. This one, on April 30th, happened just as the sky cleared before dusk
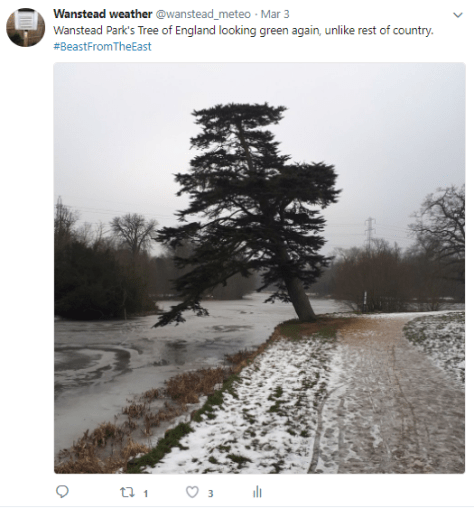
Though March is usually, meteorologically speaking, the first month of spring this year it felt more like an extension of winter.
This graph shows that the two visits from the “Beast From The East” were only enough to momentarily dent the average.
The mean temperature for March 2018 finished 6.3C, that’s 1.4C below the 1981-2010 average, the coldest for five years but still nearly 3C warmer than the exceptional March of 2013.
Some 61.5mm of precipitation fell, that’s 151 per cent% of average and the wettest for 10 years, pipping the wet March of 2016 by just 1.2mm. The 38th= wettest March since 1797.
The wet end to the month is shown on this graph.
Perhaps most notable in this region was the lack of sunshine. There was just 59.1hrs recorded, that’s just 54 per cent of the 1981-2010 average. The dullest March since 1984 and, more notably, the 5th dullest March back to 1881!
Though there were no notable night frosts, the coldest night fell to just -3.8C, the cold pattern was enough to create three new entries in the top 10 of coldest March days in Wanstead and further afield in the capital.
With 6 more days of ‘snow lying at 9am’ winter 2017-18, the snowfall season stretches from October to May, was boosted up to 20th place on my snow index.
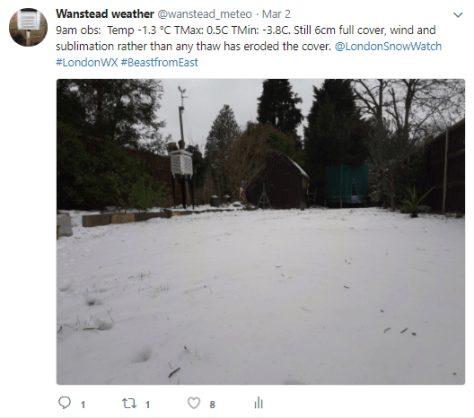
February 2018 saw the start of the first decent cold spell since 2013 with thick (by modern standards) snow cover, deep cold air and bitter winds.
February 2018 is marked by the steady downhill temperature trend from the 18th.
It was the coldest February since 1991, the mean temperature of 2.8C was just over 2.5C below average. The month was ‘cold’ though it was the 19th onwards that really dragged the value down.
Precipitation was just below average; just over 34mm is 87% of average.
It was a sunny month, the sunniest February since 2012 and the 12 sunniest in a local record going back to 1881. Some 87.9 hours were recorded, 120% of average. Of that top 12, eight have occurred since 1988! A mix of changes in weather patterns, industry and council action?
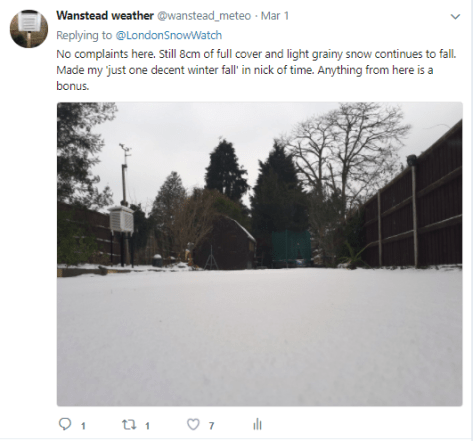
Air frosts: 16. Ground frosts: 19. Snow falling: 6 days. Snow lying: 3 days (greatest depth 8cm 28th)
December 2017 was a wet month. Just over 83mm of rain was recorded, 157 per cent of average, the wettest December since 2012 and the 38th wettest since 1797.
The snow depth on December 10th reached 5cm at its maximum
The monthly mean finished 5.6C, precisely average and the coolest December for five years.
Some 48 hours of sunshine were recorded, 120 per cent of average, slightly less than last year.
January (on the 3rd) is looking like it may produce more snowfall events similar to December though, with models suggesting a build in heights to the north. A look at the output, including GFS and ECM, suggests the UK will be in a battleground between a cold airmass to the east and warm Atlantic air to the west.
It would seem to back up my winter forecast and also the December analogues with nothing warmer than average.
Average: 33%
Rather cold: 17%
Cold: 17%
Very cold: 0%
Severe: 33%
November 2017 was another dry month. Just over 33mm of rain was recorded, the driest November since 2011 and the 40th driest since 1797.
The monthly mean finished 7.1C, 1C below average and only the fourth cooler than average month this year.
Some 71 hours of sunshine were recorded, 122 per cent of average – the sunniest November since 2007.
Air frosts: 6, Ground frosts: 17, snow falling: 1 (just a few flakes on the 30th, the first November snow in years.)
The start of December looks like it start mainly dry, an anticyclone over the Atlantic that has brought respite from last week’s cold weather will pull away into the continent to be replaced by low pressure. This depression will track across northern England gradually pulling cold, Polar air across the UK on Thursday.
The models go against what has followed dry Novembers in the past – patterns overwhelmingly suggest that December will be average to rather mild and on the dry side. Winter is looking average overall.
Here follows the full weather diary for November…Full stats for the month here:http://1drv.ms/1rSfT7Y


You must be logged in to post a comment.