A blog that tries to make sense of how the UK's national climate translates into local weather for Wanstead and the surrounding regions of east London and west Essex.
Check out my twitter feed @wanstead_meteo for local weather forecasts, stats, records and phenomena for the east London areas of Wanstead, Aldersbrook, Leytonstone and Stratford. And anything else weather
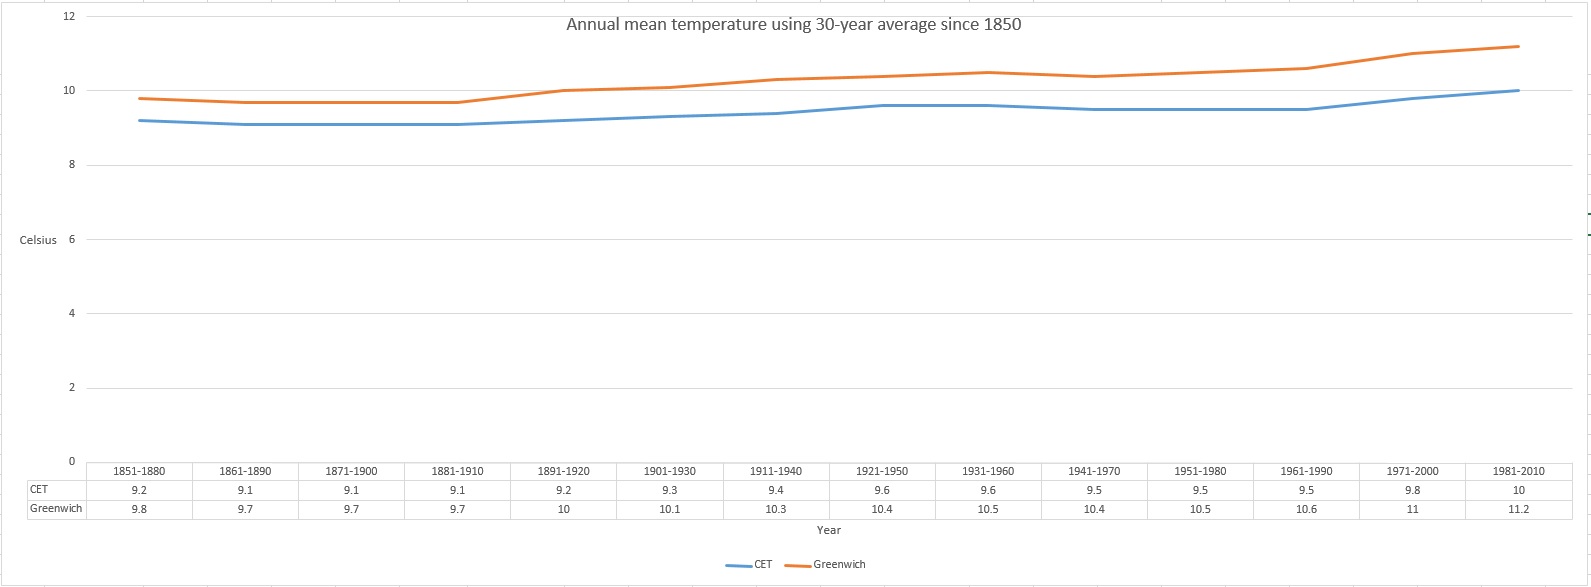
The climate of London can vary greatly to figures revealed in the Central England Temperature series. Because this dataset covers an area of the UK enclosed by Lancashire, London and Bristol the resulting monthly mean temperature can often be quite a bit lower than what is experienced in the capital.
Though these anomalies are smoothed in the monthly series that stretches back to 1659 notable daily extremes that happen nationwide tend to get lost. One example was earlier this month when the UK’s November maximum temperature record was broken. Trawsgoed in Wales reached 22.4C on the afternoon of the 1st whereas a largely foggy east London recorded just 11.5C.
Comparing CET with data from Greenwich back to 1850 reveals a gradual decoupling between the two series, the warmth of London’s urban heat island effect an ever-growing influence.
The 1851-1880 30-year average means show that Greenwich was 0.6C warmer than the CET series. By 1981-2010 this gap had widened to 1.2C – indeed the London series is today 1.4C warmer than it was in 1851-80 whereas CET has warmed by only 0.6C.
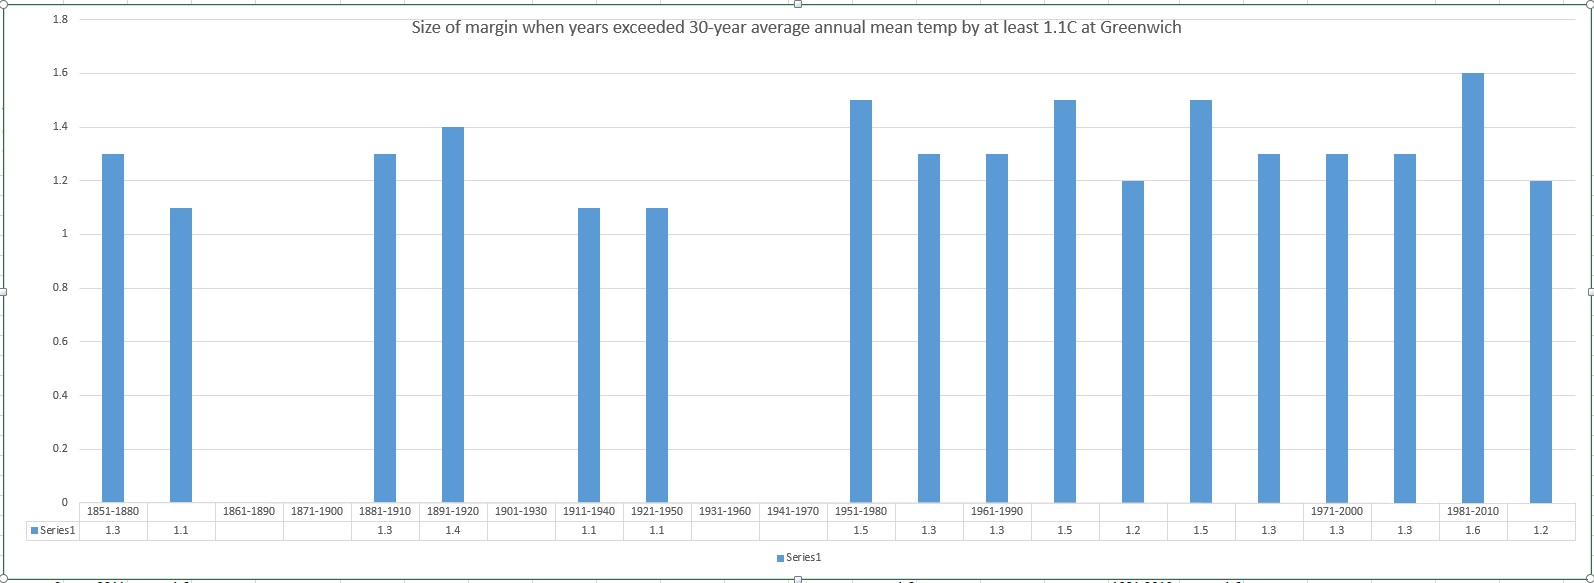
Delving further into the data reveals an increase in the number of times that the 30-year average mean is being breached by at least 1.1C. The period 1961-90 was the warmest in both cases with the mean being breached by 1.1C or more on four occasions in the case of CET and five in London. It is interesting to note, however, that the largest anomaly in the CET series is 1.3C in 1921, greater, albeit by only 0.1C, than the warm years of 1990 and 1999.
The largest anomaly in London, 1.6C, was set in 2011, 0.1C higher than 1999, 1997 and 1989.
The graph below shows the number of occasions that the 30-year average has been exceeded in each period by 1.1C or more. With 1961-90 being so warm it appears that CET warming has slowed though it should be borne in mind that we have another five years before the 1991-20 series can be released.
With reference to the London graph below showing the number of occasions that the 30-year average has been exceeded in each period by 1.1C or more merely confirms that the level of the anomalies have increased but, as already mentioned, there are probably far more outside influences affecting the outcome such as UHI, population growth, further industrialisation etc.
The accelerated warming is a worry in terms of how London would adapt should summer temperatures greatly increase, though, of course, it remains to be seen if the anomalies will advance even further from current levels.
Global temperatures are on the rise though our part of the globe may not be as adversely affected as elsewhere.* The CET dataset is the longest instrumental record of temperature in the world. The mean, minimum and maximum datasets are updated monthly, with data for a month usually available by the 3rd of the next month. A provisional CET value for the current month is calculated on a daily basis. The mean daily data series begins in 1772 and the mean monthly data in 1659. Mean maximum and minimum daily and monthly data are also available, beginning in 1878.
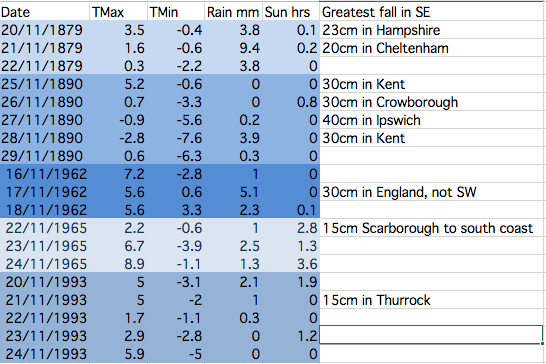
This table shows the stats for Greenwich during spells when there has been heavy snowfall somewhere in the south-east. The figures reveal that it is very hit and miss and that the associated air doesn’t stay cold for long. There is a link to UK-wide November snowfalls here: http://1drv.ms/1PjOB9H
November has produced some potent snowfalls in Scotland and northern England over the past 150 years. These brief shots of cold air, often direct from the North Pole, however very rarely produce anything that can sustain long-lasting low-level snow in London and the Home Counties.
With the GFS weather model occasionally hinting at a blast of polar maritime air I decided to have a look back through the records to see how frequently the capital has turned white during the eleventh month.
Anyone who is familiar with the Objective Lamb Weather Type (LWT) data series will know that there may be an increased likelihood of things turning colder at some point this month. Last month was the joint 5th most anticyclonic October in the LWT series data series that runs from 1871; resulting stats closely resemble both October 1946 and 1962 as being very anticyclonic. Another similar year is 1972.
November 1972 was mild till mid month and then turned much colder with snow in places. November 1962 was cyclonic till the 24th, and then anticyclonic, with a cold northerly outbreak from the 18th for a few days with snow, before turning rather mild. November 1946 in complete contrast to both years, was a mild, dull and very wet month.
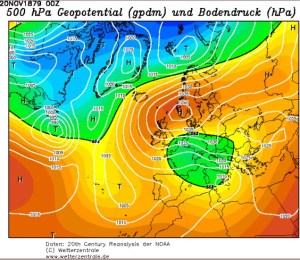
The most impressive November snowy spells seem to have occurred in the late 1800s. These two 500mb reanalysis charts show a cold feed from Scandinavia in both cases.
Snow and sleet falling in the London area is obviously much more common than snow lying. The snowiest Novembers were in 1919 and 1952 when snow or sleet fell for 10 days at Wallington and Hampstead respectively.
Kew saw snow or sleet on 8 days in 1919, while Heathrow and Northolt recorded snow or sleet on eight days in 1952.
This small article appeared on the front page of Reynold’s Newspaper in November 1890
The only decent snowfall that occured in London in my lifetime was November 1993 – and I was abroad for that. I remember my dad mentioning it in a letter written to me as I travelled round China. It arrived in the early hours of one Sunday morning and fell to a depth of five inches.
Given that was the last time London saw a decent fall I won’t be holding my breath that we’ll see any this month – though, if you live in Scotland, the odds are much narrower.
Before 1861 information on snowfalls becomes scarce – at least in terms of correct quantity. However, heavy snowfalls obviously did occur. On November 17, 1816, the Inverness Journal contained this report:
“The winter has commenced with a severity almost beyond example. Frost, rain and snow have been almost incessant during the last week and the greater proportion of corn still uncut or in stocks has suffered material injury.
“We regret to say that several lives have been lost. A postboy of Bennet’s coming from the south was obliged to leave his chaise on the road and would have been lost but for the lights shown from the windows of Moyhall which he reached nearly in a frozen state. The obvious advantage of keeping lights in stormy nights in the windows of houses in the country has thus been illustrated
“The winter it appears has set in with extreme severity in the interior of the continent. At Augsburg on the 19th of November the eclipse of the sun was entirely obscured by a fall of snow which commenced at 7 o’clock in the morning and lasted till noon. The ground was covered with snow a foot in depth. There was a great fall of snow at Frankfurt on the same day and Reaumur’s thermometer showed at from 9 to 10 degrees below the freezing point.”
Perhaps the most impressive, modern day snowfall in the south of the UK occurred around November 18th 1972 when observers recorded 60cm of snow on Dartmoor. Synoptic charts and other data are attached below.
Image courtesy of the Met Office
Image courtesy of the Met Office
Image courtesy of the Met Office
Image courtesy of the Met Office
Inspiration for this piece came from Dr Richard Wild’s PhD study on snowfall which you can find here.
Geoffrey Prater served in the 51st Royal Tank Regiment during his five years’ national service and saw action during World War II in Italy and North Africa.
I met the 91-year-old Wanstead resident earlier this year after my article on the Blitz prompted him to write to the editor explaining what life was like during the war 75 years ago.
Over a cuppa we spoke at length of how he and his family coped with the Blitz. Carefree days spent playing over Wanstead Park and Wanstead Flats were brought to an end in September 1940 as the Luftwaffe’s bombs started to rain down. In November 1940 Geoff lost his elder brother, Doug, during an air raid in Stratford.
He was called up for national service in September 1942 and, after a year of training at Brentwood, Farnborough and Barnard Castle, his regiment set sail from Liverpool docks in December 1943. Five days on mountainous seas, through the Bay of Biscay, ended with arrival in north Africa on Christmas Day from where he was posted to Italy to fight the Axis.
On returning from Italy Geoff had to come to terms with the fact that his family home in Devonshire Road, Leytonstone, had been destroyed by a V1 doodlebug bomb. His mum and younger brother, Dunc, who only narrowly escaped the bomb, had to move to a flat above a shop in Chobham Road, Stratford.
Geoff has written an account of his experiences during World War II. It’s an absolutely fascinating read and is available both in paperback and download here.
I feel privileged to have met Geoff. We owe so much to his generation’s fortitude and courage in the face of adversity.
In his own words, from the introduction of his book:
“Most people of my generation are proud to have been part of those momentous days, whether in the Services, or at home. They all suffered the grim hardships that existed at that time, with determination to see it through, whatever the cost. So, next time you see some old boy, walking down the road wearing his medals, usually at November time, don’t say, ‘Look at that silly old fart’. Just respect his pride in wearing them, after all he might be one of those ‘old boys’ who saved your way of life.”
Between 2mm and 3mm is estimated to fall between 6pm and 9pm . Fog cancelled fireworks organised for Wanstead Flats on Sunday
Bonfire Night celebrations are looking a bit damp tonight with rain spreading in just at the time many will be looking to light the fuses of fireworks as darkness falls.
According to the Euro4 model revellers can expect light but steady rain between 6pm and 9pm – annoying given that Sunday night’s festivities on Wanstead Flats were cancelled thanks to thick fog forming during the late afternoon as the sun began to set.
Wanstead Flats has put on some spectacular Guy Fawkes’ nights over the years. I didn’t realise quite how many years until I stumbled upon this old British Pathe clip which shows nurses at Wanstead Children’s Home building a huge bonfire for the children in 1934.
The footage shows the nurses struggling to get the Guy atop the bonfire, using numerous ladders, while the children, including 12 sat in an old perambulator, look on. The stats for the day reveal that the temperature fell to a chilly 2.7C after a day high of 7.9C. There was also some drizzly rain, though less than 1mm.
The Aldersbrooke Childrens Home for Waifs & Strays is still there in Brading Crescent on the Aldersbrook Estate, although the five lodges have been converted to flats.
In 1907, the West Ham Guardians purchased the Aldersbrook site. In 1911, five receiving homes were completed. The homes were called lodges and were: Elizabeth Fry Joseph Lister, Tom Hood, Edward North Buxton and William MorrisA bit of history…
In 1913, a workshop, for training of the older boys and girls was opened. Skills learnt were in tailoring, carpentry, laundry work and needlework, under skilled industrial trainers.
In 1930, on the 1st April, the ownership of Aldersbrook homes and the leases of the Scattered Homes, were under the 1929 Local Government Act, and by agreement with the Essex County Council and the West Ham Corporation, vested in the East Ham Corporation who are required to continue to receive destitute children from the Essex County Council and West Ham, formally comprised in the West Ham Union area.
On 27th May 1933, the Aldersbrook Children’s Homes new nursery was opened. The County Borough of East Ham owned it. Alderman T.W.Burden, Chairman of the Public Assistance Committee, opened it. The Mayor of East Ham, Alderman G.H.Manser J.P, proposed a vote of thanks, which was seconded by Alderman C.W.Brading J.P, and supported by Alderman Mrs Taylor (East Ham) and Councillor G.Doherty, of West Ham. After the official opening, the older children (14 to 16 years old) of the homes put on the play “David Garrick”.
The superintendent of the home was W.T.P. Steele, and the matron was E.M.Steele. S.R.N. The building was described as being divided into three sections – ground floor, babies under twelve months and toddlers one to three years, first floor staff. Accommodation is given for ninety infants under three years. Wards are provided for these age groups were newly admitted children will be housed for three weeks before being sent to the general rooms. Two ranges of isolation rooms are also provided where “suspects” can be nursed to reduce the risk of infection. The south end of the building is allotted to the youngest or cot babies and comprising of long dormitory with sun rooms at the end, designed to catch the winter sun.
The former Aldersbrook Children’s Home is still there in Brading Crescent but has been converted to flats
The programme went on to describe the building as being the most modern of children’s institutions. The building has a veranda at the front. The first floor has 21 separate staff bedrooms. The building had an oil fired heating system and flooring with fire resistant Terazzo material whilst the children’s play room and dormitories are protected by rubber flooring. The lighting and power points are controlled by locking device to prevent the children switching them on and off. The building was built by Messrs Hammond & Barr Ltd Chelsea.
The Nursery is now gone and the Aldersbrook estate covers the area, although the recreation Hall, the lodges (See photo) and the porters lodge are still there.
The incident of frosts during the season from October to May. There has been a general uptick overall since 1999/2000
1934 and this year, together with the last couple of years, is a far cry from my memory of Bonfire Night being a frosty affair – despite the fact that frosty nights during the season from October to April have been showing an uptick since 1999/2000.
The synoptic chart on November 5th 1934 portrays an unsettled regime
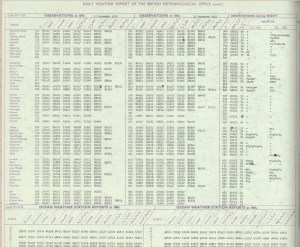
The synoptic chart from 7am on November 3rd 1940 showed a deep depression crossing the country that brought over 40mm of rain to Greenwich Image: Courtesy of Met Office
November 1940 was the wettest on record for this area. Over 170mm of rain fell in Greenwich, beating the previous record set over a hundred years before in 1836.
Other areas of London were even wetter: Croydon was wettest with just under 196mm while Addington recorded just under 194mm, Bromley 179mm and Regent’s Park 175mm.
Nearly a quarter of the month’s rainfall fell on the 3rd. The total of 40.8mm is a daily November record that remains to this day. Indeed, throughout the month, there were falls of more than one inch (25.4mm) somewhere in the London area on four days: 40.8mm (3rd, Greenwich), 26.7mm (4th, East Ham), 26.4mm (11th, Camden Square), 27.4mm (13th, Southgate).
In Wanstead and Woodford the inclement weather coincided with a 6-day pause in bombing incidents during the Blitz. November was a very cyclonic month that probably hampered German air operations.
Another 6-day pause in the bombing happened after November 16th. When the Luftwaffe returned on Saturday, November 23rd, it was Wanstead that bore the brunt. At 4.12pm, as light was fading on a dull, dreary afternoon, high explosive bombs caused fires at and partly demolished nos 78 and 89 New Wanstead. A minute later another bomb ruptured water and gas mains in Spratt Hall Road. At 4.30pm a further high explosive bomb fell in the High Street, killing 4 people. The raid ended at 5.16pm as a bomb fell in Fitzgerald Road though this time there were no injuries.
By now the weather was beginning to quieten down though weeks of deep depressions with associated gales and heavy rain had taken their toll – many residents reported problems of Anderson bomb shelters being constantly flooded – but it was probably the design as much as the weather that was to blame.
As pressure built in the last few days of November the first frosts of winter arrived but the bombs returned. High explosive devices fell in Woodford New Road and Bunces Lane on the 30th, fracturing a water main.
To put November 1940 into some sort of perspective the average fall for the month in this area, with regard to the 1981-2010 average, is 59mm. The closest this area has come to matching the record was 2009 when 150mm was recorded and preceded a cold winter.
The following synoptic charts are for each day of November at 7am. All courtesy of the Met Office
This October was the coolest since 2012 though the mean of 11.7C is just 0.1C below average – nearly 2C colder than the same month last year.
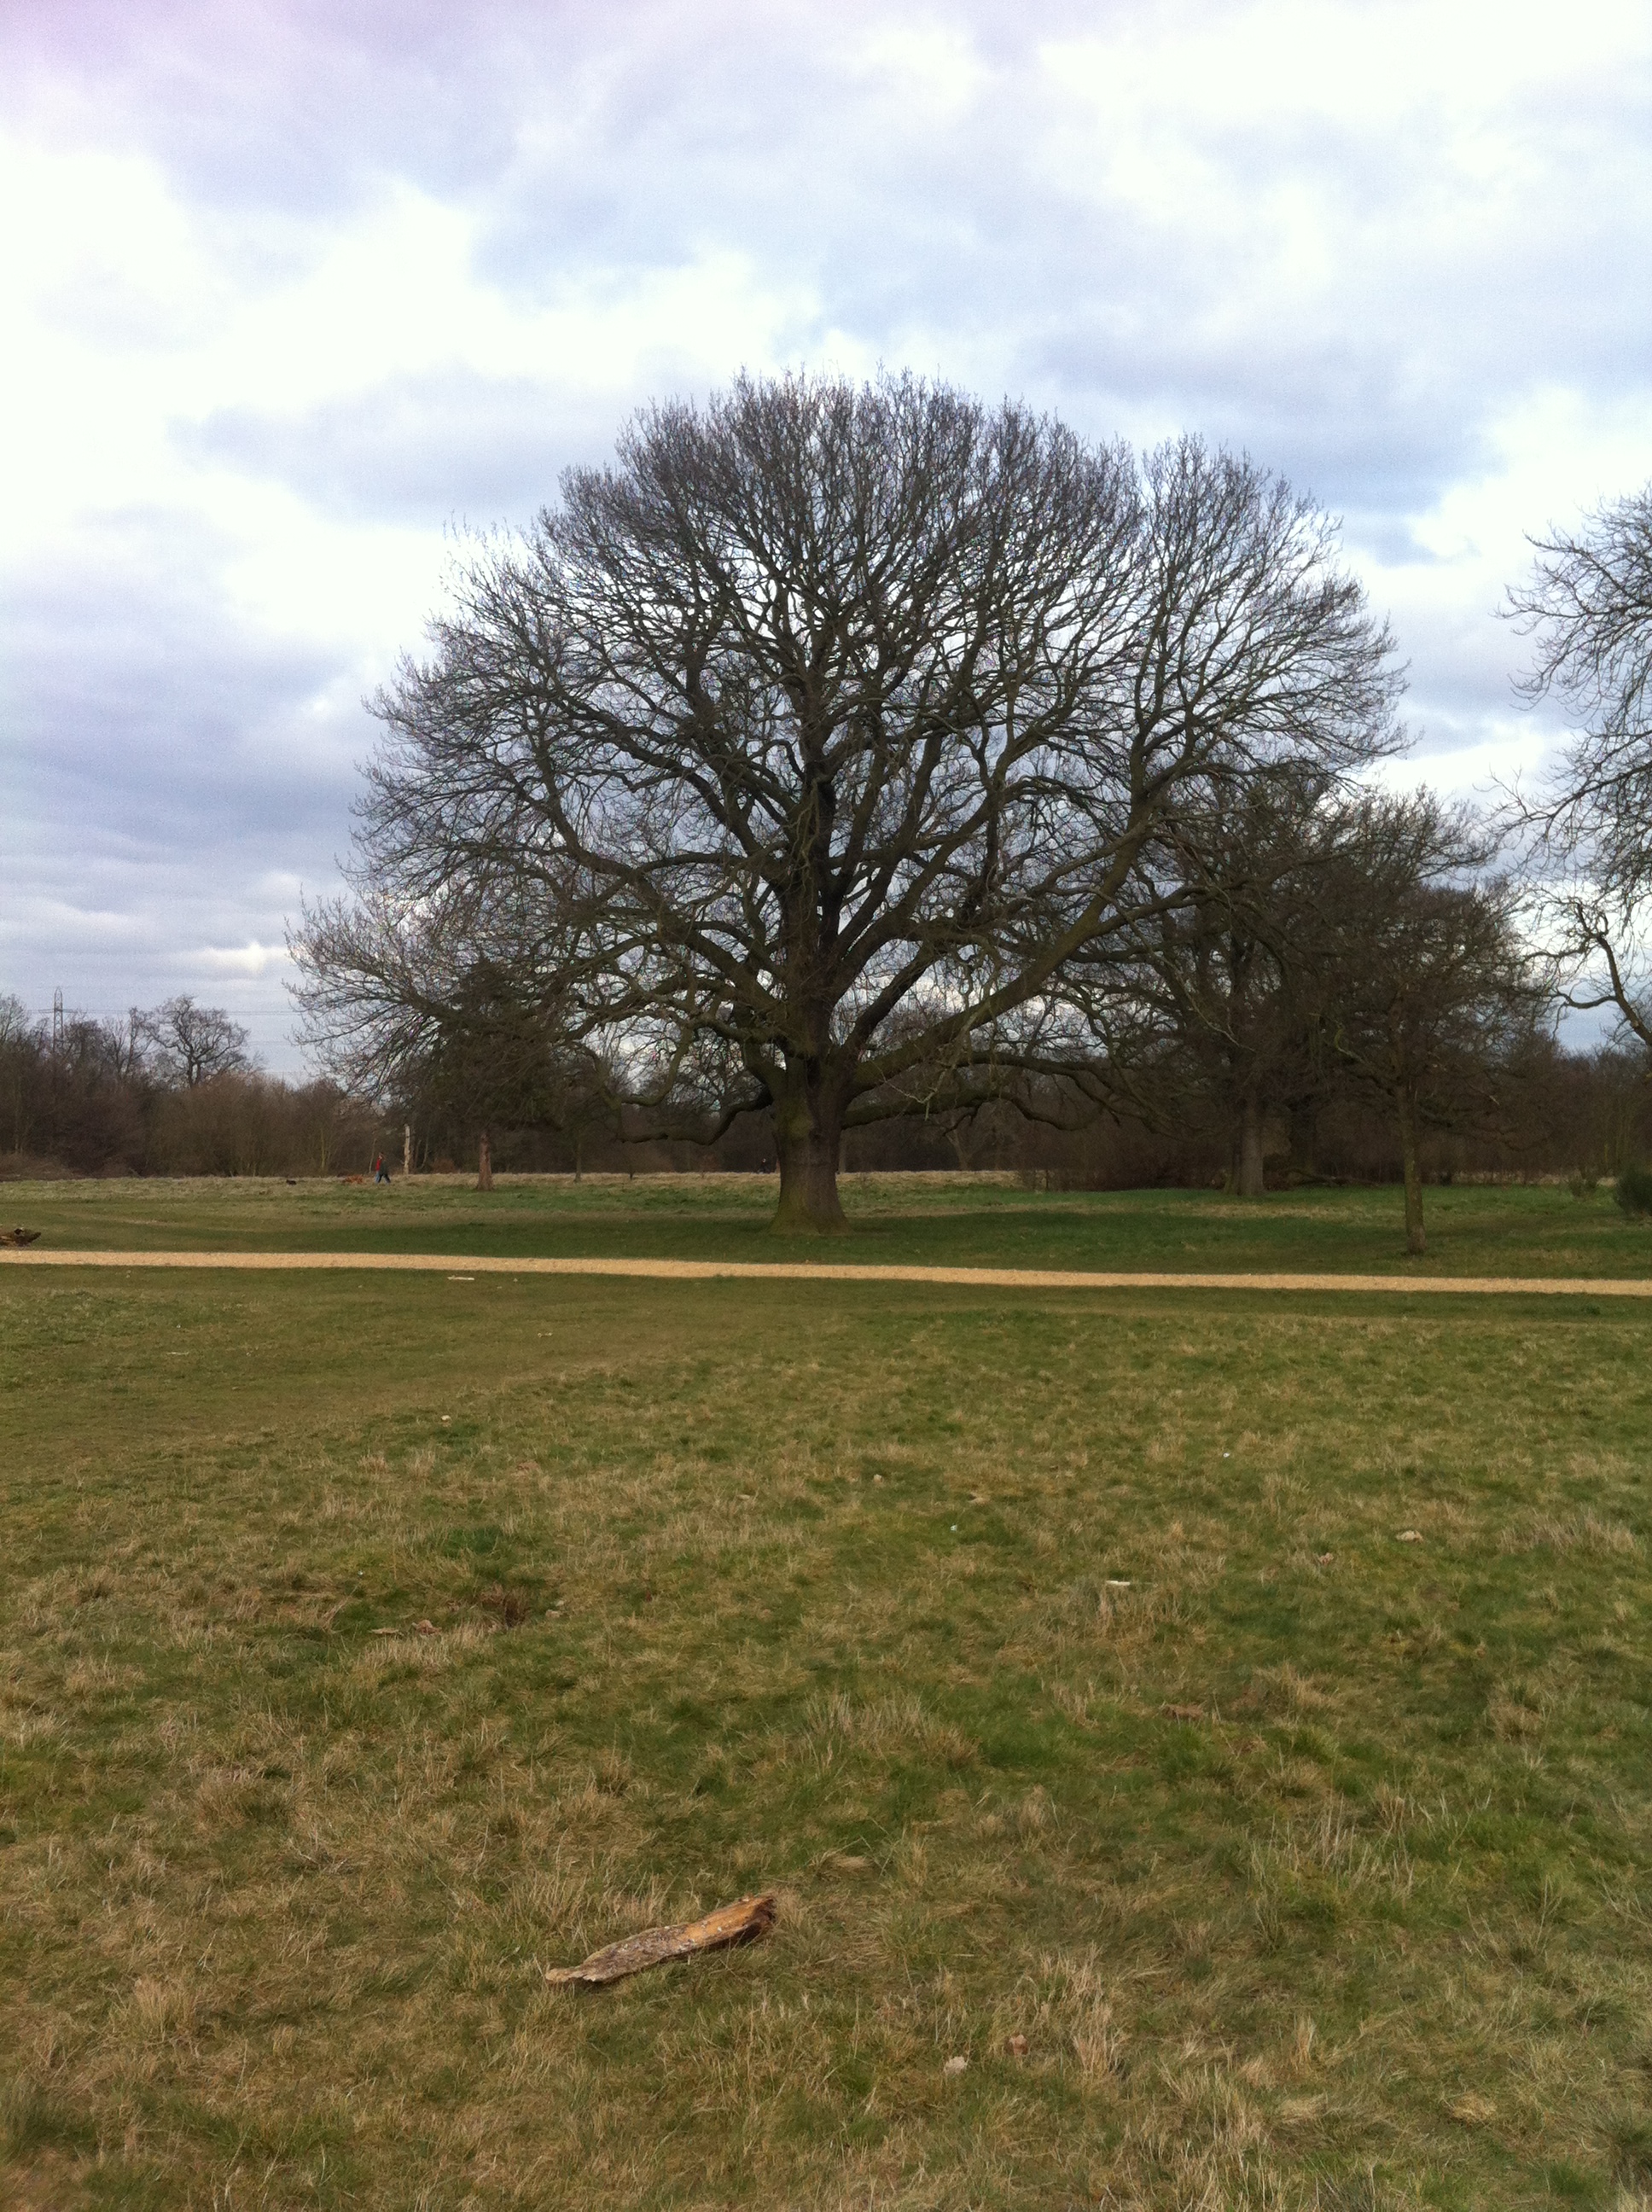
The last week of the month saw the leaves turning in earnest. The horse chestnuts, such as this one in Wanstead Park however, turned much earlier because of the leaf miner pest
A persistent anticylone around mid-month pumped quite cool air from the north-east for a time, prompting some cold nights. Though we have yet to experience an air frost this autumn the ground temperature fell below freezing on five nights – that’s five occasions more than last year: -2C was recorded during the early hours of the 8th.
The month was rather dry: some 46.8mm of rain fell which is 70% of what we can expect in an average October. The wettest day was the 27th when 19.4mm fell. The heavy rain in the early hours of the 28th was quickly replaced by sunshine and a stunning day followed.
Just over 91 hours of sunshine were recorded – that’s 86% of what we can normally expect in an average October.
What has November got in store weatherwise? The models today (November 1st) suggest this week will see a gradual decline in conditions overall as the ridge from Europe weakens and weak Low pressure edges up from the south and SW. Thereafter it looks like winds will settle SW’ly as high pressure relocates to the south of the UK, bringing this area mild temperatures and mostly dry and bright conditions – though a little rain will be possible at times. Overall the models continue to have little appetite to serve us up anything remotely cold and stormy.
My long range outlook method suggests that November will be average to rather mild temperature-wise, a mean of about 8.9C, at 56% probability. The next highest probabilities are for rather cold or cold, at 18% probability. The chance of a very mild month comes out at just 6% probability.
The highest probability for rainfall is 69% for something average to rather dry, between 37mm and 59mm. A wet November comes in at 20% probability.
My data for sunshine only stretches back to 1878. The signal is for something average, at 60% probability.
Looking beyond November it is notable that October 2015 was very similar to October 1997 – the year another strong El Nino occurred. A very mild winter unfolded from 1997-98, though I’m sceptical about how much influence ENSO has on our part of the world.
With the sun lower in the sky at this time of year there’s often a great opportunity for a decent sunset
My October outlook for temperature was good in that I estimated that there was a 44% chance of the mean being average. My rain estimation was way out in that a signal for a rather dry October was only a 22% probability – though bearing in mind that the probability for a wet October was only 33% it is not surprising the outcome was wrong.
Here follows the full weather diary for October…Full stats for the month here:http://1drv.ms/1rSfT7Y
1st Sunny with just a few wispy clouds. Heavy overnight dew.
2nd Sunny and clear all day and evening. Mist thickened overnight with fog elsewhere in the UK.
3rd Misty start and cloudy till midday. Evenutally cleared to leave sunny spells. Cooler than yesterday.
4th Sunny start but with a few cumulus developing during the day. Clouding over during the night with few drops of rain from high-level feature before obs time.
5th Cloudy start with rain spreading in after midday, this being steady on and off into evening before turning to drizzle late evening and lasting into early hours. Another outbreak of rain at 9.30am to obs time.
There were five ground frosts during the month of October
6th Rain to start, some of it heavy. Drying up a bit at 11.30am. More rain in the evening and overnight into the early hours. Rain again at 9.20 until obs time.
7th Cloudy start but with rain moving in again. This rain dried up a bit at 11am but then more rain at 2.30pm before petering out and clearing overnight to leave it cold.
8th Sunny, clear start with just a few cirrus. More cloud at noon and through the day. Cleared at dusk to give a cold night and heavy dew.
9th Sunny start but cloud bubbled up from noon to give cloudier periods.
10th Bright start though stayed mostly cloudy and cool. Milder overnight than of late.
11th Sunny start with a bit more of a breeze. Some alto-cumulus late on made for a stunning sunset. Cloud overnight held up temperature.
12th Cloudy start, some brightness at 11am.
13th Cloudy, cold start with cloud off North Sea making it feel colder. Cloud was very thick at 3pm with drops of drizzle.
14th Clearer periods overnight saw temperature fall sharply but too much wind for frost.
15th Sunny with just a few cumulus – very cold wind though. Cloud thick enough at times for brief showers through day. Quite overcast at night
16th Cloudy start though with some brightness. Strong easterly breeze.
17th Cloudy though warmer than past week. Felt a bit muggy.
18th Cloudy and breezy start, cloud persisting through the day.
19th Bright start and was more glimpses of sunshine than past few days. However, cloud returned with a vengeance last afternoon – felt like it was getting dark at 5pm.
20th Cloudy all day. Clearer overnight.
21st Cloudy start. This turn to long sunny spells and a pleasant afternoon.
22nd Rain to start which fell until 2.30pm. Then outbreaks of rain into the afternoon. Cloudy and damp overnight.
23rd Bright start though mostly cloudy through the day.
24th Cloudy all day. Feeling colder.
25th Cloudy start with light rain around 10.40am then intermittent. Very heavy burst of rain after dark before the skies cleared to leave a cold night.
26th Bright start with cloud breaking to long sunny spells – pleasant in the sun. Temp fell away quickly at dusk. Precip was dew accumulation.
27th Sunny start. Some cloud developed through the day but then largely melted away to leave a warm late afternoon.
28th Cloudy start. This broke to sunny spells into the afternoon in Rye. Light rain seen in Rye at 8pm – this turned heavier into the evening but most fell at dawn.
29th Bright start but quickly clouding over with rain in the evening and overnight.
30th Light rain and drizzle to start then cloudy all day and overnight.
31st Bright start, the cloud gradually clearing to leave a warm afternoon.
Plans to build 200,000 homes in East London over the next 20 years should be music to the ears of anyone struggling to find a place to live in our overcrowded capital.
But unless planners are willing to spend billions on new flood defences it is possible that these new homes will be particularly at risk of flooding should rainfall levels increase with climate change.
The Environment Agency’s Flood Plan map of the Thames illustrates how much of the land that is designated for development is at risk of flooding
Many of the developments mooted in London Mayor Boris Johnson’s plan for a City in the East are situated on flood plain, according to the Environment Agency.
On reading through the blueprint flood risk isn’t mentioned once.
A report in the Financial Times, citing the new plan, says there is much more potential than previously thought to increase housebuilding in east London, the capital’s planning chief estimates. Sites earmarked include the Lea Valley and areas along the Thames beyond Canary Wharf.
‘Thames Riverside’, the term for an area along the north side of the Thames including Barking and Beckton, could host 27,000 homes, while areas on the opposite side of the river could hold 22,000, according to the report. There could be 52,000 more homes in Lea Valley, 30,000 on the Isle of Dogs and 15,000 in Woolwich.
Sir Edward Lister, deputy mayor for policy and planning, believes the capital’s authorities had learned from their experience with the Nine Elms regeneration area, where a statement of intent had galvanised developers.
“We just have to commit and then the developers can move in,” adding that there were “vast” amounts of underused post-industrial sites along the river in east London.
The housing plans also include commercial and industrial buildings, giving potential to create 280,000 jobs, as well as supporting infrastructure such as schools and hospitals. Transport improvements, such as Crossrail and a new London Overground line, would make the developments ‘desirable’. But costs would be dwarfed by any flood defence improvements.
Previously the Environment Agency has outlined a range of options for the future of the Thames Estuary flood defences. None are particularly cheap.
As a minimum, the EA estimates that the cost of maintaining the defences until 2035 will be around £1.5 billion, with an additional £1.8 billion needed to repair and upgrade the defences until 2050. Particular bits of marshland could also be set aside to store tide waters.
The River Lea close to where Luke Howard’s laboratory stood. Since it was completed in 1976, there have been no major flood events in the Lea Valley, although there have been three occasions when the river system was full virtually to its capacity: in 1987, 1993 and 2000.
More ambitiously, the government could fund a new barrier in either Tilbury in Essex or Long Reach in Kent. Such a barrier would be designed to resist the highest surge tides identified by the Met Office’s analysis of how conditions will change this century. The EA estimates a new barrier could cost as much as £7 billion, though that figure could go up if conditions change significantly as the climate changes.
The Agency also say the existing barrier could be converted to include locks, which could open and close more flexibly and extend the life of the defences. The EA report says a decision on a new barrier will have to be made by 2050.
It may turn out that there’s a more pressing reason to spend. The EA says 50 is the maximum number of times the barrier should close each year, and beyond that, the barrier could start to fail.
How high is the likelihood of flooding in this part of London? A look back through history shows the geography of the Lea Valley has made the area prone to inundations for hundreds of years.
The Environment Agency’s Flood Map for Planning shows the flood zone risk of the area. And endorses Howard’s account that the river Lea was ‘a mile wide’ at its peak
In January 1809 the lower River Lea burst its banks in several places following a deluge that dumped two inches of rain in the space of 24 hours. The rain abruptly ended a snowy cold spell that had begun over a month before in the middle of December. From Luke Howard’s readings it is likely that up to half a metre of snow had fallen in the previous weeks in the upper parts of the surrounding countryside with only slight thawing. With the frozen ground unable to absorb any of the rapidly melting snow and rainfall the amount of water flowing downstream must have been immense. Howard takes up the story…
“The River Lea continued rising the whole of the 26th… The various channels by which it intersects this part of the country were united in one current above a mile in width which flowed with great impetuosity and did much damage.”
Howard, his chemical factory located on the banks of the river Lea close to what is now Bow flyover, wrote at length about the event, his account replacing the usual brief notes about daily weather in his book The Climate of London.
He talks of embanked pasture land being “filled to the depth of eight or nine feet” and people driven to their upper rooms relieved by boats plying under the windows.
“The Thames was so full during this time that no tide was perceptible.” It took until February 23rd for things to return to normal.
Wanstead Flats: another area of east London that is traditionally flood plain
Miraculously no lives were lost in the flood and cattle “by great exertions” were saved by being kept in their stalls. Howard, saying that the flood could have been far worse, believed a neap tide, strong westerly winds urging water down the Thames and mild weather helped avert a tragedy.
Howard’s statistics of the previous months show that the second half of 1808 were wetter than average – though not especially so. And nothing like the rainfall this area recorded during the winter of 2013/14. From December 1st until February 8th 1809 Howard recorded 130mm of rain, which is about 100mm less than what was recorded during 2013/14.
This fact alone shows just how much the nature of the river has changed in the last 200-odd years thanks to spending on flood defences.
Work to improve the defences was prompted 67 years ago when similar catastrophic flooding came with the thaw that ended the severe winter of 1947, one of the coldest winters in history and an episode remarkably similar to what Howard recorded in 1809.
The Lea Valley, along with many parts of the country, saw some of its worst flooding in a generation. The river burst its banks at several points bringing misery to surrounding communities. Valleys turned into lakes in 40 counties and East Anglia’s fens were a sandbagged inland sea. More than 100,000 properties were damaged and, then as now, heroic battles were fought by the military to keep water-pumping plants and power stations dry.
A marker of that flood, together with a history of flood defences, can be found here. There is also British Pathe footage of another flood between 1910 and 1919 here .
The iconic Spillers’ Millennium Mills building has been redeveloped
The River Lea Flood Relief Channel, that flows between Ware, Herts, and Stratford, took almost three decades to complete. The channel incorporates existing watercourses, lakes and new channels. Since it was completed in 1976, there have been no major flood events in the Lea Valley, although there have been three occasions when the river system was full virtually to its capacity: in 1987, 1993 and 2000. Since its completion, the level of protection afforded by the structure has declined, so that in some areas it offers 2 per cent protection, and in some, only 5 per cent protection. The EA published a strategic environmental assessment in 2008, which looked at ways to maintain the flood defences in the Lea Valley.
In summing up its ambitions for a new development the Greater London Authority says it is trying to “overturn the historic perception of the east being seen as apart from London, rather than as a part of London”.
Jim Ward, a director of research at property consultancy Savills, said the challenge was “building something that makes people want to live and work there”, he said. “You need to build more than homes, you need to build a place.”
Boris’s record of late has not been good: an estuary airport to replace Heathrow has been dismissed as pie in the sky while his promise for a 24-hour Tube was made without first consulting unions that it was possible.
London’s safety from flooding is an altogether different proposition, both for old and new developments. Boris really needs to get London’s flood defences right before any brick is laid on these desperately-needed new developments.
Every so often the UK experiences severe weather which shocks a population that is very used to our mostly benign climate.
Newspapers and media agencies, in an age where a culprit must be found to blame, are quick to connect every gale, flood and snowstorm with climate change. To say it is just ‘weather’ doesn’t compute with the average news editor.
The year 1868 saw months of extreme weather that led newspapers on a mild and rain-sodden Christmas Eve to first ask the question: ‘Is our climate changing?’
A look back through archives from the 19th century reveal that this is not a new phenomenon. Though extreme weather events, including the heatwave of 1808 and widespread floods of 1811 and 1828, were always well documented, it wasn’t until the advent of reliable meteorological readings in the mid 1800s that scientists could analyse what was happening to the atmosphere with any authority. This, coupled with an explosion in literacy rates and the British fascination with the weather, helped build an appetite for news stories that went beyond covering each gale, flood and blizzard.
The year 1868 saw months of extreme weather that led newspapers on a mild and rain-sodden Christmas Eve to first ask the question: ‘Is our climate changing?’ The year had been the warmest for 34 years. The CET mean for 1868 was 10.4C, a figure nearly 1.3C above the 1831-1860 average. To put that into perspective 2014 was only 1C above the 1981-2010 average.
A review of weather in 1868 in the Falkirk Herald said the year had started very wet – a farming diary kept in Connaught, Co Mayo, said that January was so wet it was impossible to plough the land. The very wet weather lasted until the last week of March. In the Armagh record, all three months had well-above average rainfall, with the three-month total of 363 mm representing around 180 per cent of the long-term average.
By contrast the summer of 1868 was very hot and dry, with some of the highest temperatures ever recorded for the second half of July occurring in this year. There was a remarkable spell of hot days, with temperatures over 30C in England. For the south-east specifically, a maximum temperature above 32C was recorded in each of the months from May to September, and in July, the temperature exceeded 32C on 9 days. It was regarded for many years, until 1976 at least, as the longest (because of a lack of rainfall) and hottest in the instrumental record for England.
Although not accepted under modern methods, because of problems of comparison between Glaisher stands and Stevenson screens, the maximum temperature recorded on July 22nd, 1868 at Tonbridge, Kent, is still remarkable: 100.6F (38.1C). It is thought that this value, when compared with a standard Stevenson screen, is about 1.5C or 2C too high.
The subsequent ‘standard’ winter (December, January and February) became the warmest winter in the CET series which began in 1659, a record that still stands today.
The mild temperatures suggest a highly zonal, westerly pattern held sway from late November 1868 until at least February 1869. Snow was scarce in 1868 – with the only heavy falls on March 3rd and 8th and November restricted to northern England and Scotland.
Gilbert White, in his journal Natural History of Selbourne, tells of a visit to London in January 1776 when the metropolis was completely embedded in snow. He says that snow remained on houses in the City for 26 days – these days it is unusual for any snow to fall in the centre
The Falkirk Herald goes on to point out that winters, for the past 25 years, were mostly mild and wet – any bitter spells were short-lived. The piece cites Gilbert White’s Natural History of Selbourne which tells of a scene in January 1776 when “narrow roads were filled with snow to the tops of the hedges”, stopping road wagons and coaches in their tracks. White, regarded as England’s first ecologist, remarks that on a visit to London on the 22nd the metropolis was completely embedded in snow. A frost on the 27th lasted four days and was so intense that the Thames froze sufficiently enough for crowds to run about on the ice. More tellingly the snow remained on houses in the City for 26 days – these days we’re lucky if we see snow fall at all in the centre.
The paper professes that an increased occurrence of gales in mild winters were preferable to the ‘wave of death’ that accompanies bitter winters:
To the strong and hearty the frosts and snows of a bitter winter may seem genial and invigorating ; but they bring death with them to the weak, the ailing, and the aged.
It had been nine years since Charles Darwin published On the Origin of Species and many people were starting to turn away from the popular theory that many weather disasters were the work of God.
Nine out of ten of the warmest years have occurred since 1989
Less than 5 years later the question ‘Has our Climate Changed?’ was being asked again. An article in the Fife Herald on January 30th, 1873, reported that winters were milder and that summers were colder – less frost and snow and much more rain. The month had been mild, nearly 2C above the 1841-70 mean, but the rain was more notable: 80mm, 136% of the EWP average. The wet January was a continuation of the previous 12 months which had been the wettest on record: 1284.9mm, a record in the EWP series that remains to this day. There has been a wetter 12 month period just once – April 2000 to March 2001.
The wet conditions extended across Ireland too; in the Armagh record, the 12 months from February 1872 to January 1873 saw 1251 mm of rain fall, which represents about 150 per cent of the long term average for this station. A farming diary in Connaught, Co Mayo, stated that the persistent wet weather caused considerable distress through loss of harvests and difficulty of working the land.
By the time the question: “Is our climate changing?” was asked again, 16 years later, the climate had turned much colder with the return of snowy winters. Snow fell on 16 days in February 1889 – a storm on the 10th and 11th dumped 20-30cm of snow widely across England. Days later the Hull Daily Mail reported a statement by Professor Cleveland Abbe which said that the climate of the earth had not changed in 2,000 years.
The comments of Professor Abbe, today considered the father of the US National Weather Service, were drawn from a report in the US magazine, The Forum, and referred to temperature, rainfall, early and late frosts, freezing of rivers, periods of cold winters and hot summers, the opening of navigation and the temperature of the earth. He said:
The study of each and all of these phenomena has failed to establish that there has been any sensible change in the climate at any point of the earth’s surface during the past 2,000 years.
It is not clear if Professor Abbe’s words were taken out of context but it is interesting that such a well-respected scientist had the confidence to make such a statement.
Rainfall shows a much more even spread of records through the years than temperature
The year 1888, part of a string of colder than average years that followed the huge Krakatoa volcanic eruption in Indonesia in 1883, had seen other extreme events. In July ice is reported to have disrupted the fishing fleets around the Faroe Islands, implying cold conditions at these latitudes, probably extending to at least the Shetland Isles. It was a notably cold summer; a mean of 13.7C puts it just outside the ‘Top 10’ of coldest summers in the CET series. In London the summer was 1.8C cooler than average and rainfall was 139 per cent of normal for that period. It was also the dullest on record.
Two decades were to pass before the question: ‘Has our climate changed?’ appeared again following a fairly mild and wet winter. The Dundee Courier, on April 9th 1908, suggested that winters had grown milder but admitted there was no known cause. It said that the Thames had not frozen over for nearly 100 years but that this was partly caused by the fact that London Bridge was replaced 80 years previously, totally changing the tidal flow of the Thames.
Five months later a soggy Dublin Horse Show prompted the Wells Journal on September 10th to report on findings by the meteorologist Sir John Moore featured in the Geographic Section. He looked at Rev William Merle’s writings from the 14th century and observations made in Greenwich from 1774.
The facts prove that within the last six centuries at all events appreciable change has taken place in the climate of the British Isles. There is no scintilla of evidence to show that such change has taken place in the past or is likely to take place in the future.
On Boxing Day 1908 the Gloucestershire Echo cited an ancient weather report featured by Sir John Moore. In 1341 the month of April saw continuous frost from 6th to the 13th while the following autumn saw spring-like weather persist from September to December: “Our climate hasn’t changed in 600 years.” was the claim.
A poor summer in 1909 that began with the coldest June for over 230 years once again prompted the question ‘Is our climate changing?’ to be asked again by the Wells Journal on August 5th, 1909. The report says that the climate of Europe is growing colder – with periodic cold summers. It goes on to say that cold summers have happened in the past, mentioning the following years: 820 (cold and wet – most crops perish), 1033 and 1044 (cold and wet, caused famine), 1151 (rain falls in France continuously from end of June to middle of August), 1219, 1315, 1423 and 1512 (cold and wet summers) – in 1512 several people, accused of causing bad weather, were burned at the stake. Other years: 1596, 1639, 1641, 1667 – all had very cold Junes. The years 1809, 1812, 1813, 1816 all had cold summers.
Around the country there were some notable readings. On June 6th a high of just 10C was reached in Oxford and Bath. It was notably cold and wet with significant thunderstorms from 10th to the 12th and 20th to 28th. In London the Trooping the Colour ceremony on 24th was cancelled because of poor weather – one of only four occasions it has been cancelled due to weather since its inception in 1895. It was also a very dull month with no sunshine at all in London from June 2nd to 6th.
The year 1911 produced more remarkable weather and some violent thunderstorms. On May 31st, as the Titanic was being launched in an overcast Belfast, some 17 people were killed by lightning strikes across London and four horses died on Epsom downs on what was the day of the Derby. About 62mm of rain fell in 50 minutes on the Downs and there were 159 lightning strikes in 15 minutes around 5.30pm.
The summer season that year was the warmest for 65 years with many areas having less than half their normal rainfall. July was spectacularly sunny with an average of over 10 hours of bright sunshine over much of southern England: 384 hours of sunshine were recorded at Eastbourne and Hastings, East Sussex, during this month, and these are thought to be the highest sunshine totals recorded anywhere for July in the UK.
August 9th, 1911, saw the first incident of 100F (37.8C) being recorded in London. The record beat the previous high of 97F. The report also makes mention that many areas recorded at least 97F
For the SE of England, with something like 300-350 hours of bright sunshine, this month (with July 2006) is regarded as the sunniest month on record. The month was also exceptionally dry and is still among the ‘Top 5’ dry Julys in the EWP series. August was also warm: the 9th produced the first occasion when 100°F was recorded in London.
During the autumn of 1911, the Shields Daily Gazette on Wednesday, October 25th, was reporting that ‘weather prophets’ were predicting that the UK was in for an exceptionally cold winter. The predictions were based purely on the fact that the country had not had a bad winter in more than 15 years, the last occasion on which the Thames was partly frozen over in the early part of 1895.
“If very cold winters come on an average once every twelve years, an old-fashioned winter is certainly overdue, for there is no ground for supposing that our climate is changing. But it is not the case that cold winters follow hot summers as an invariable rule. They sometimes do so, but the contrary would seem to be as often the case, for the hot summers of 1868 and 1887, to quote two examples, were followed by comparatively mild winters.
The law of averages is certainly on the side of a severe winter this year, but in the case of the weather it is never safe to argue from any law, and as the price of coal is going up, everyone must hope that this time, at all events, the Clerk of the Weather will be merciful.
In the event the Clerk was merciful and winter was mild.
Warm winters are often thought of as a modern phenomenon but there were plenty in days past
This mild theme continued for a period prompting the Dundee Courier on Monday, January 2nd 1922 to ask: “Where are our winters? Is our climate changing?” The leading article goes on: “Here we are in January, and so far we have had no snow to speak of. Yes, our climate is changing, and has been for many years. We do not need weather records to tell us that. Our memories provide striking comparisons. In our boyhood days we greased our boots, tucked our trousers in, pulled the ear-flaps of our caps (you remember the style) down tight, wrapped mufflers around our necks (but not for fashion sake), then stood by the big fire to warm up before starting to plod our way through deep snow school.
“Who can forget the snowball battles after school; the hustle home for skates and to the ponds until nightfall; and then some? In those times we planned skating parties, and we were not disappointed. Do we need the records of thermometers and snow gauges to remind of the days of stinging cold and streets “piled high with snow ?
Anyone who says our climate is not changing has not been on this earth long enough to know. The severe winters left indelible marks upon our grandparents and great-grandparents, and the weather developed strong constitutions. They tell of successive winters of heavy snow and intense cold, beginning early in November and lasting until late in March. The snow often was piled up from four to six feet deep on the level.
There’s been far more wet winters than dry winters in modern times
“The seasons in those times were evidently well marked, for frequently made of their definite beginning and ending. Winter evidently was the season that concerned our ancestors most, for only slight mention made of any unusual summer.
In Britain the last few years winter temperatures have been higher than the average. The cold period has several times occurred in the autumn and May is showing a tendency to become the most pleasant month of the year, and so we are again reminded that the climate is changing; while statisticians say that average temperatures have remained practically the same for the last 600 years.
“A change in climate does not necessarily involve a change from the average mean temperature. It frequently happens that a warmer winter and a cooler summer or vice versa, or even a moderate winter and an unusually hot summer leave the average practically the same, while climatalogically very decided changes have taken place.”
Six years later a very poor summer prompted the Dundee Evening Telegraph on Tuesday, July 3rd 1928 to again ask the “eternal question”: Is Our Climate Changing? “With days of wind and rain that have made June and July days seem more like March and at times, even November, we are still awaiting our real summer. It is not uncommon to hear people speculating as to whether, after all, our seasons are not in process of changing.
“It is interesting, even if is not comforting, writes a correspondent, to know that people were speculating on exactly the same matter many years ago, and that in 1892 the author of Dundee and Dundonians Seventy Years Ago, when writing on Olden Rime Storms, Floods and Droughts, thought to ask: “Is our climate changing?”
Five of the ten warmest summers have occurred relatively recently
“In a climate like ours,” says the writer of that interesting little book, the weather is a never-ending topic. Warmer and Colder. I have often heard old people speak of the weather changes that had taken place since their young days, as they expressed it. The summers, they said, were then much warmer, and, as an instance, they said that barley would be above the ground in forty-eight hours after sowing. It was then, they admitted, the last grain that was sown.
The summers then were so hot that the cows could only be put out to pasture in the early morning and evening, as they were driven mad by the ‘glegs’ or horse flies biting them. Then the winters were almost arctic in their severity and length. The seasons were also more sharply divided, approaching those of Russia and North America in their rapid seasonal transitions.
“I know that many about my own age have the same ideas of what has taken place in their time. A very hot or a very cold season or two may, as we get older, come to assume the general character of that far-off time, still I cannot but think that for a good many years past there has been more of a mixing of summer and winter than was the case fifty years ago, winter now being often found in the lap of spring, and summer-like weather about the new year.
“On a New Year’s Day – I can’t remember the date – I gathered blossom from our gooseberry bushes to show to a friend.”
On February 5th 1929 the newspapers were promoting a “new series of talks entitled ‘Is Our Climate Changing'”. The first speaker was a Mr Gordon Manley of the University of Durham. The paper said that the talks, in view of the widespread interest in weather conditions and forecasts, should prove of rather more than usual interest.
Three of the ten driest summers have occurred recently though it is notable that 2012 ranks 4th wettest summer
Manley later became probably the best known, most prolific and most expert on the climate of Britain of his generation. It took him 30 years to assemble the Central England Temperature (CET) series of monthly mean temperatures stretching back to 1659 – the longest standardised instrumental record available for anywhere in the world.
In the Dundee Courier on Wednesday, July 29, 1931, a report on a recent article “Has our climate changed?” had aroused considerable interest. David Grewar, the well known Glenisla authority, who has a long experience of the glens, gives his views below.
“Such variety of opinion exists as to whether or not our weather has changed. Some say that it has, others that it has not, and that any supposed change is due to the exaggerative effects of memory. These differences of opinion do not only exist among laymen, but among scientists as well.
Making all due allowance for changed habits and the tricks of memory, the older among us are undoubtedly correct when we say that the seasons now are different from our younger days. Then our winters were more severe, our summers better; now there’s more of a levelling up between the two.
“Mere meteorological records of temperature and precipitation cannot be taken as proof of what popularity constitutes severe winter. Suppose, for instance, that a heavy fall of snow is experienced in December, and is slightly augmented now and again for the next two months, and that never more than a few degrees of frost are registered, records would represent that as a mild winter; whereas reality it would be a severe one, because the ground would be deeply covered with snow for the whole winter. On the other hand, we may have a winter of severe frost, with little or no snow, claimed as a severe one.”
Eighteen months later and the Gloucester Citizen, on Friday, January 6th 1933, asked: “Is our climate changing?” The sub heading “January mends its manners” again enquired about whether the persistent succession of mild Januaries in the present century suggested something in the nature of a change in climate?
In the French Revolutionary calendar the division of the year from the middle of December to the middle of January was the month “Nivose” or “snowy”. The Anglo-Saxons called January “Wulfrnonath” because the weather was so intense that wolves, emboldened by hunger, left the forest and invaded the villages. The Dutch used to call January “Lauw-maand” or “frosty month”.
Today, in many parts of the country, particularly in the south and west, amateur gardeners have the delightful rare experience of seeing standard and rambler roses in full bloom, primroses blooming in rich clumps, stocks, polyanthus, indeed, show off flowers usually retarded by frost until the spring.
This changing character of “January freeze-the-pot-by-the-fire” is commented upon by a writer in the current issue Nature:
“January, the coldest month of the year in England, is proverbially associated with snow and ice. During the twentieth century, however, January has not lived up to its name but has been much more open, mild and stormy. with few prolonged frosts.
“At Greenwich the mean January temperature during the decade 1921-30 was 41.3Fs, more than two degrees above normal and probably five or six degrees higher than in some of the decades of the late eighteenth and early nineteenth centuries. This persistent period of mild winters has extended over the whole of western and central Europe and is associated with a greater frequency of south-westerly winds and may almost be regarded as a change of climate.”
Within five years, in 1938, Guy Callender produced a paper that developed a theory that Earth temperatures had been rising in line with increasing concentrations of atmospheric carbon dioxide. It was the first time that somebody had made this connection: the birth of the science of man-made climate change.
If the oak before the ash…
In 1942, the Buckingham Advertiser and Free Press, on Saturday, February 21, was discussing old weather rhymes.
“The speaker gave the following to us as among the most reliable weather verses:
“Livening red and morning grey, are surest signs of a very fine day.”
“When the dew is in the grass, rain will never come to pass.”
“There was a flicker of reason, he said, in the rhyme “rain before seven, fine before eleven”.
“Is our climate changing? Dealing with the question of our climate changing Mr Pettipher observed that people’s idea that the old-fashioned type of weather had gone forever, and that some such solution as the diversion of the Gulf Stream was the cause of the winter warmth, received a rude shock in the early months of 1939 and 1940, which, with the exception of 1929 were probably more severe than anything since 1895.
“Hot summers seemed to have been rather less frequent than in years past ; but our land was not really one of perpetual fog and gloom some novelists would have us believe, nor as bad as American thought when he wrote :
Dirty Days hath September, April. June and November ; from January up to May, the rain it raineth every day ; all the rest have thirty-one, without a blessed gleam of ; and if any of them had two and thirty they’d be just as wet and twice as dirty ! (Laughter.)
“In terms of Buckingham rainfall the speaker emphasized the necessary practical value, especially to sailors, fishermen, agriculturists and sportsmen, and now to our airmen, of weather study and manv observations with regard to rainfall described the Air Ministry’s organisation of 6,000 observers in the different parts of the country, of whom he was one, pointing out that the work had been described as of “national importance” because of its practical value.
“He emphasized that it was not a dry, hot summer that caused anxiety regarding water supplies; but a dry winter season. Buckingham’s average rainfall over a 20-year period was 25.43 inches. During the remarkable thunderstorm of May 19th when the roof of Buckingham Hospital was set alight by lightning 1.01 inches fell in thirty minutes, the percentage of 2.02 inches in the hour qualifying for a place in British Rainfall for a fall of unusual intensity.”
Much has been written about climate change in newspapers and scientific papers since the war. For a long period during the 1960s and 1970s the concern was about global cooling. But this changed in the 1990s when it became scientists identified that the Earth was beginning to warm.
A search of Wiley, the publisher shows a sharp increase in incidences of articles and papers that feature climate change. It is surprisingly just how big the increase has been since the beginning of the 1990s.
Looking at the last 10 years the Financial Times mention of the phrase ‘climate change’ is much more variable, perhaps reflecting the world financial crash of 2008 when concern was deflected away from the environment and on to the economy.
Concerns over climate change today have moved on immeasurably since those first lines of concern were vented in newspapers in 1868. But the socio-economic and geo-political arguments that are associated with the science deserve a blog all on their own. The long-range models that are still being developed, together with further study of ocean sediment, ice cores, tree rings etc illustrate that there is so much more we need to learn about this fascinating subject.
News editors would do well to take a moment the next time they report a hurricane, tornado, flood or snowstorm and realise that ‘freak’ events do happen and that it is not necessarily climate change that is the cause of that particular event in time.
As Mark Twain apparently said in 1887: “Climate is what we expect, weather is what we get.”
* Articles featured in the British Newspaper Archive were referenced in compiling this blog
This September was the coolest since 1993. The average mean of 13.4C is 2C below average – a surprising statistic given that the month ended with many bright and sunny days with respectable temperatures. But, with the wind in the east, caused by an anticyclone anchored to the north of us at the end of the month, the air was dry and allowed temperatures to fall smartly away after dark. The average minimum temperature was just under 8.8C, 2.3C below average and the coldest since 1986.
The month was rather dry: some 42mm of rain fell which is 81% of what we can expect in an average September. The wettest day was the 16th when 17.6mm fell.
Just over 140 hours of sunshine were recorded – that’s ‘on the nose’ of the monthly average and 20 hours more than was recorded during the very dull August.
What has October got in store weatherwise? The models today (October 1st) suggest an end to the fine and sunny weather as high pressure declines and is replaced by a trough moving up from the southwest on Monday. Less clear is how the weather evolves from then with the majority of models showing this feature opening the door to a lengthy period of SSW winds and possible rain at times. However, the rain would become more restricted to our northwest as pressure builds from the continent. So a return to something more autumnal looks likely though temperatures will remain on the mild side, especially at night.
This chart shows the low pressure system that brought September wettest day for this area
My long range outlook method suggests that October will be average temperature will be average temperature-wise, a mean of about 11.8C, at 44% probability. The next highest probabilities are for something cool, at 22% probability. Something rather cool or very cool comes out at 11%. There appears no chance for a mild month.
The highest probability for rainfall is 33% for something rather wet: between 84mm and 100mm. The next highest probabilities is for an average, rather dry and dry October at 22%.
My data for sunshine only stretches back to 1878. The signal is inconsistent so I would guess sunshine will be average.
My September outlook for sunshine was good in that I estimated that there was a 60% chance of average sunshine. Less good was the finding that there was only a 23% chance of a dry September – the highest probability was for something average. And my temperature estimation put the probability of a rather cool September at only 14%. So, all in all, not great.
Here follows the full weather diary for September…Full stats for the month here:http://1drv.ms/1rSfT7Y
1st Cloudy start though with some brightness. Small shower mid afternoon which was the edge of large storm that affected Essex.
2nd Sunny bright start though with lots of cloud from noon. Lots of convection.
3rd Cool, cloudy start. Some brightness but feeling cool in the wind. A few spots of rain.
4th Bright start with some sunshine tempered by the breeze. Mostly cloudy all day.
5th Light rain to start with brighter spells. Problem of being on the edge of high pressure. A sunny afternoon.
6th Sunny start with just a few clouds during the day.
7th Sunny start but cloud gradually increased during the day.
8th Cloudy start, overnight ‘rain’ was dew. Mostly cloudy all day. Warm overnight.
9th Cloudy start but a few holes appearing as the day wore on and sunshine at 1330.
10th Sunny start though with cloud bubbling up sunny spells followed. Clear with heavy dew overnight.
11th Sunny start with wispy cirrus – more cloud bubbling up during the day.
12th Cloudy start over overnight rain. This breaking up toward late morning to leave a sunny spells afternoon.
13th Cloudy start – this breaking up toward noon to leave bright afternoon. Some rain overnight.
14th Cloudy start, rain arrived soon after 10am and lasted over an hour. Then bright spells and more showers through the day and into the evening and overnight.
15th Cloudy start with heavy shower moving in at 12.30pm. Showers cleared through to leave cloudy early evening.
16th Cloudy start with rain spreading in at 12.30pm. Some heavy bursts through the day. Rain all the way in to work and torrential rain coming back from school at 5.30pm. Bursts through the evening and light drizzle was falling on way home at 1am, tending to peter out.
17th Sunny start tending to cloud in more.
18th Bright but cloudy start with clouds bubbling up. A heavy shower by 1pm.
19th Sunny all day with odd cloud. Warm in sun.
20th Sunny all day, any cloud decreased.
21st Spots of rain just before obs time. A mostly cloudy day. Heavy, showery rain between 5.30am and 7.30am.
22nd A cloudy, chilly day with rain after noon.
23rd Sunny, gin clear start. Clouding over by 2pm with rain at 1am.
24th Bright start after rain overnight. Sunny spells developing – a late shower at 1534. Dry and clear overnight.
25th Sunny start though with cloud bubbling up the sun disappeared at times. Cold overnight with a heavy dew.
26th Sunny and clear to start, though with cloudier periods through the day.
27th Sunny clear start with a few clouds bubbling up through the day. Mostly clear for lunar eclipse totality at 3.11am.
28th Sunny start with long clear periods during the day.
29th Mostly sunny with just some cirrus.
30th Sunny start with just a few cirrus. Stronger breeze than yesterday.
Today, 75 years ago, saw the heaviest casualties of the Blitz in South Woodford – a parachute mine in the Stanley Road area killed 17 people and injured dozens more.
George Lane, South Woodford, during the Blitz
The day, a Monday, dawned bright and sunny and revealed yet more destruction from the previous night’s raid as shopkeepers in George Lane cleared away shattered glass caused by a high explosive bomb.
Some 10 hours of sunshine lifted the temperature to above 18C, conditions brought thanks to high pressure building in from the west. But the fair weather was in complete contrast to what lay in store as night fell.
At 9.19pm two high explosive bombs fell on 62 and 74 Gordon Road, South Woodford, demolishing four houses. Over the next 15 minutes three similar missiles fell in Broad Walk, Cheyne Avenue and Chelmsford Road, leaving people trapped and bursting a water main.
However, a couple of minutes later, a parachute mine landed on Stanley and Chelmsford Roads, killing 17 and injuring dozens. Some 36 people needed hospital treatment. Further bombs damaged a nursing home in Grove Hill.
The air raid brought the highest number of fatalities in any single incident of the Blitz in Wanstead and Woodford. The extent of the damage to property was considered the first affair of real magnitude that the local Civil Defence services had faced.
* The first paramine fell early on the morning of September 21st. A plane carried two mines, one under each wing, and released them simultaneously. Controlled by its parachute, 20 feet in diameter, the mine, containing an explosive charge of one tonne, drifted slowly down. If the first explosion was not followed quickly by another, it was fairly certain that not too far away was an unexploded mine. Discovery, as of all unexploded bombs, was the job of the warden who was working in the blackout.
** The area of damage cased by the blast effect of the paramine could extend 650 yards from the landing point


 * The CET dataset is the longest instrumental record of temperature in the world. The mean, minimum and maximum datasets are updated monthly, with data for a month usually available by the 3rd of the next month. A provisional CET value for the current month is calculated on a daily basis. The mean daily data series begins in 1772 and the mean monthly data in 1659. Mean maximum and minimum daily and monthly data are also available, beginning in 1878.


You must be logged in to post a comment.