The last three months in east London have been sunnier than average – hard to believe as we move into a regime of easterlies that will bring showers and anticyclonic gloom.
A sunless outlook from the Met Office last December
With no sun and short days it is no surprise that many are probably already feeling short-changed in the solar stakes.
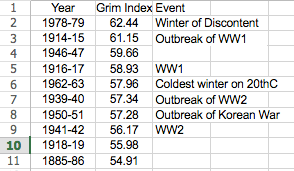
A blog by XMetman on a ‘grimness index’ got me thinking how London fairs in terms of sunshine, temperature and rain in any given winter season.
Using the same criteria, and assuming that most people welcome sunshine, it can be seen that since the least grim winter of 2007-08, the season, over the past 10 years, has been growing steadily worse.
The grimmest winter, considering statistics back to 1881, was, ironically, the 1978-79 ‘Winter of Discontent’ when, again ironically, ‘Sunny Jim’ Callaghan was in Downing Street as widespread strikes coincided with the coldest winter for 16 years. On looking at the Top 10 of grim winters it is striking how most coincide with depressing world events, the Great War, World War 2 and the Korean War!
The Tory ‘Crisis? What Crisis?’ campaign was probably my first memory of a general election broadcast.
Since the early hours of Sunday I’ve been tracking official sites around London to see how Wanstead fairs in terms of retaining cold temperatures and snow.
The results, comparing hourly obs over 62 hours, show that Wanstead was a degree cooler than St James’s Park, half a degree cooler than Heathrow and marginally cooler than Northholt. Only Kenley, with its whopping 170m of altitude, was cooler.
While half a degree doesn’t sound much it can make all the difference, as we saw at the weekend when some areas recorded inches of snow while others barely a centimetre.
Though the snow has pretty much vanished now it was evident yesterday that the area was far more wintry neighbouring Forest Gate, Leyton and Stratford which had pretty much lost all their cover.
* For anyone who has a fascination for the weather and whether their back garden in the Counties Estate is colder than their mate’s in the Warren Estate I notice that weather stations are now even cheaper and you don’t need to connect to the net via a dedicated PC. A unit from Ventus (the W830) allows you to connect to the amateur weather network Wunderground. The internet dealer Weatherspares has them on offer. (NB. I am not on commission but would be happy to offer anyone advice who wants to buy and set one up.)
Wanstead, Aldersbrook, the Flats and Wanstead Park are all part of a ‘green island’ in east London that tends to hold the cold better than surrounding built up areas
November 2017 was another dry month. Just over 33mm of rain was recorded, the driest November since 2011 and the 40th driest since 1797.
The monthly mean finished 7.1C, 1C below average and only the fourth cooler than average month this year.
Some 71 hours of sunshine were recorded, 122 per cent of average – the sunniest November since 2007.
Air frosts: 6, Ground frosts: 17, snow falling: 1 (just a few flakes on the 30th, the first November snow in years.)
The start of December looks like it start mainly dry, an anticyclone over the Atlantic that has brought respite from last week’s cold weather will pull away into the continent to be replaced by low pressure. This depression will track across northern England gradually pulling cold, Polar air across the UK on Thursday.
The models go against what has followed dry Novembers in the past – patterns overwhelmingly suggest that December will be average to rather mild and on the dry side. Winter is looking average overall.
Here follows the full weather diary for November…Full stats for the month here:http://1drv.ms/1rSfT7Y
I’ve been doing these written winter forecasts for five years now but this year I’ve never seen such a spread of probabilities as to how winter may pan out. So, if by the end of reading this you are none the wiser, you’re not alone!
The mean temperature for winter 2017/18 is looking average overall with average precipitation. While that doesn’t sound exciting for anyone looking for colder weather and snow I think the figures mask frequent 3 or 4 day-long cold snaps from the Arctic interspersed with milder interludes from Atlantic incursions; typical characteristics of a pattern driven by the troposphere. For anything longer term we have to hope for a warming of the stratosphere, a sudden stratospheric warming over the Arctic, that downwells into the troposphere, reversing the general westerly circulation. We are overdue an ‘SSW’ event but, even if one were to happen, its effects wouldn’t be felt until much later in the winter.
The current cold snap follows the recent disruption of the polar vortex. The ‘displaced polar vortex’ regime seems to be becoming more common as the Arctic gets warmer and maintains more open water during winter. This leads to anomalous ridging over the Arctic, which results in a displaced or bifurcated vortex, which leads to somewhere in midlatitude getting persistent anomalous cold. There was very cold air around last year but the UK missed out; the heart of the cold plunging down far to our east with snow falling on beaches in Crete!
This week’s cold snap looks like it will be short lived though the ‘displaced vortex’ could be an early sign of yet another pattern transition in the troposphere. Looking at the latest model output it is uncertain how long the next polar vortex perturbation will be.
So, whether we see any cold, snow-worthy, air this winter is a lottery – though I think our chances are a lot better than they have been for the past 5 years.
Because October and November have been so dry I’ve had very little to work with in terms of stats to try to find if the current pattern is similar to previous autumns. Instead I’ve looked in depth at ENSO, QBO and local meteorological data.
ENSO
The El Niño–Southern Oscillation (ENSO) is a periodic variation in winds and sea surface temperatures over the tropical eastern Pacific Ocean. It is forecast to be mildly negative (La Nina) over the coming winter. Many doubt whether it has an impact on our winter but there seems to be a connection with strong La Ninas and very mild winters. Because it is forecast to only be mildly negative it’s impact may be very small. I had a look at similar years were ENSO was -0.4 in September and came up with the following.
QBO
I also had a look the quasi-biennial oscillation (QBO), the quasiperiodic oscillation of the equatorial zonal wind between easterlies and westerlies in the tropical stratosphere. This produced the following table of probabilities.
Singularities / patterns
My traditional method of looking back for similar patterns of weather in the autumn produced this table.
So, considering all three tables together, would suggest, probably bizarrely given the cold start to this month, a rather mild December followed by an average January and February.
October 2017 was a very dry month. Just 12.6mm of rain were recorded, the driest October since 1995 and the 11th driest since 1797.
The monthly mean finished 13.1C, 1.3C above average and the seventh warmer than average month this year.
Some 81 hours of sunshine were recorded, 76 per cent of average – the 4th duller than average month in a row. Just three months have been sunnier than normal in 2017!
Air frosts: 0, Ground frosts: 2
The first half of November looks like it will be predominantly anticyclonic. Expect lots of calm weather with the usual frost and fog.
Here follows the full weather diary for October…Full stats for the month here:http://1drv.ms/1rSfT7Y
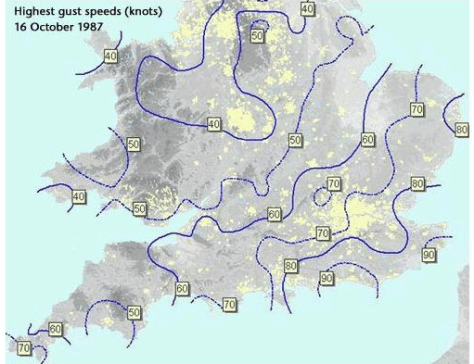
This month marks the 30th anniversary of the Great Storm. Some 18 people were killed as winds gusting to nearly 100mph affected London and the South East. Around 15 million trees were lost with Sevenoaks in Kent losing six of its seven historic trees.
Courtesy of the Met Office
The rapid development of ‘Low M’ took forecasters by surprise, the favoured outcome was for the low to move up through Brittany, remaining in or to the south of the English Channel.
I was living in a fairly sheltered corner of the London borough of Havering in 1987. I remember heavy rain just before midnight, around three hours before the storm reached its height, was heavy enough to send water trickling into my room, thanks to an overflowing roof valley. I thought it strange that Michael Fish hadn’t mentioned its severity in his lunchtime forecast.
I was awoken around 3.30am by a loud crash. Looking out the window I saw two dustbins flying down the road. You could sense each gust building in strength – the next dislodged a roof tile, sending it crashing on to the family car. By this point my mum and sister had awoken, my sister swearing she could feel the whole house moving: Mum ordered us downstairs. By this point the power had gone off and we sat listening to a small battery-operated transistor radio. We listened to updates from BBC Radio London where, like most other people, nobody knew what the hell was going on. The storm continued and first light gradually revealed the damage in the garden – a couple of trees over and next-door’s shed on its side; nothing compared to the rest of the region. But the disruption meant I didn’t attend school that day.
The storm was obviously a weather nut’s dream, and following so close on the heels of the coldest January I can remember. John Hall, of Surrey, can remember the storm well: “I’m not normally a very heavy sleeper, but I somehow managed to sleep through the worst of it (in Cranleigh, then as now).
“It was still windy when I woke around 7 am, but presumably not nearly as much as it had been earlier. By some miracle we still had mains power, and it was only when I switched on the radio and there was no sign of Radio 4 that I realised that something was up. (I assume the transmitter must have been damaged.) I walked the half-mile to the centre of the village to get my morning paper and then to catch the bus to Guildford station for my journey to work.
“It was only then that I learnt from the newsagent that there were no papers and wouldn’t be any buses, as every road in and out of the village was blocked by fallen trees. So I went home, switched on the TV and learnt all about what had happened.”
Dave Cornwell, of Laindon, south Essex, said: “Quite exciting but scary for me at home in Laindon. I awoke probably around 3.00 am to the sound of a metal dustbin lid (remember those?) flying down the street.
“Things sounded pretty bad and my sixth sense told me this was no ordinary windy night. I got up and looked outside and there was stuff flying by and lots of strange noises. One was my plastic gutter blown down and banging against the side of the house. I can’t be certain of the timings but we awakened our two young daughters and took them downstairs as I was worried as they slept in a room with a flat roof dormer window and there was a tall brick chimney stack directly above it. I heard more crashing sounds which unfortunately turned out to be a couple of roof tiles landing on my car roof which was parked in the drive. Of course with no internet then I did what a lot of people did and tuned into the police FM radio network. This gave me a better realisation that it was serious as they were describing the carnage on the roads and all of the emergency calls they and the fire brigade were getting.
“At about 5.30am I ventured out into my driveway to see if there was any serious damage but the storm was still raging and I can honestly say I couldn’t stand up and was unable to keep my balance so went back indoors. I think the wind speed was probably over 100mph at this point being funneled down the side of the house which runs south-north.
“By 8.00 o’clock I was getting ready for work and although by then people were being advised to stay at home I worked in a fairly essential service so thought I would give it a try. I managed to get to East London but there was debris everywhere and I saw a car completely crushed by a one of many trees that were blocking some side roads.
“Another thing I noticed that evening was my south facing windows had a layer of salt on them which must have been blown in from the south coast 60 miles away. It was a sight I’ll never forget and to this day I don’t like strong winds (had a scary flight at Heathrow in a severe gale as well) and always get a nervous feeling if I hear the wind getting up. Probably the most dangerous weather I have experienced anywhere in my lifetime.”
Much has been written about the storm, a ‘once in 500 year event’, including this summary by the Met Office. There is also an excellent paper by Bob Prichard published in Weather. The synoptic charts below show how Low M develops from 1200 on the 15th to 1800 on the 16th.
15OCT87 1200
15OCT87 1800
15OCT87 2400
16OCT87 0600
16OCT87 1200
16OCT87 1800
Because of widespread power cuts many television viewers didn’t see this recording of ITV’s Good Morning Britain at the time of transmission. A round up of the immediate aftermath of the storm, including comments from Jack Scott, can be seen in this edition of Thames News.
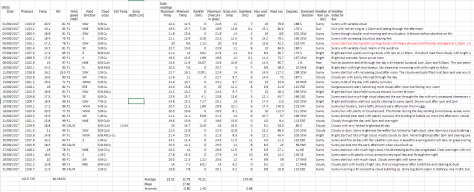
The following Daily Weather Report was published by the London Weather Centre:
An intense, and almost certainly exceptional, depression crossed the coast of south Devon soon after midnight, moving quickly, and deepening rapidly, with a track across the Midlands and out towards the Humber Estuary, leaving the United Kingdom land area around 0700 hours.
Some very severe conditions due to storm force winds were generated around the southern and eastern flank of the low, with gusts from approximately 0200 hours well in excess of 70 knots, and reaching a peak in the period 0300 hours to 0700 hours, with gusts to 90 knots reported from Herstmonceux and St Catherine’s Point in the early hours, and similar value gusts from the Channel Islands. The very stormy conditions were accompanied by some heavy rain, this rain pushing into Scotland and parts of Northern Ireland after dawn.
Clearer weather, on westerly winds, swept across southern Britain, pushing the worst of the stormy winds away into the North Sea. During the afternoon the country settled down to a blustery westerly with some heavy and thundery showers developing in clusters, running especially into western and southern coastal regions and parts of southeast England.
Across Scotland and northern England the skies remained cloudy, with outbreaks of mostly light rain, but troughs enhanced the showers in the northwest later in the evening with heavy rain. It was a rather cold day in most places, although the temperatures were near normal in the southeast.
The storm remains the most severe I have experienced in this part of the UK. The Burns’ Day storm in 1990 brought severe gale force winds in the London area but the low pressure was centred much further north.
The most recent severe windstorm in the London area, the St Jude Day storm of 2013, brought strong winds but nothing on a par with 1987.
15OCT87 2400
25JAN90 1200
28OCT13 0000
The anniversary of the storm, complete with a question and answer session attended by Michael Fish, will be marked at the Royal Met Society’s WeatherLive event in November.
The first month of autumn continued in the same vein as the last month of summer .
The mean temperature finished 14.8C, 0.6C below average and very similar overall to September 2013.
Some 53.5mm of rainfall was recorded, 103% of the 1981-2010 average. Some 114 hours of sunshine were recorded, 81 per cent of average, so on the dull side.
Overall the month was typical for early autumn – though possibly felt more autumnal because it was around 3C cooler than September 2016 and much wetter and duller than that month.
As usual at this time of year there is already much speculation about how cold the coming winter may, or may not, be. Winter has arrived over Siberia and early season snow cover is predicted to increase over the next week. However, the factor of early snow over Siberia being a sign of a cold winter to come in NW Europe is is only one piece of the jigsaw and I have seen it proved wrong a few times.
Snow cover: 2/10/2017
Modelled snow cover: 9/10/2017
Summary for September 2017
Temperature (°C):
Mean (1 minute) 14.4
Mean (min+max) 14.8
Mean Minimum 10.7
Mean Maximum 18.9
Minimum 5.3 day 21
Maximum 22.7 day 04
Highest Minimum 16.7 day 04
Lowest Maximum 15.2 day 19
Air frosts 0
Rainfall (mm):
Total for month 53.5
Wettest day 16.1 day 27
High rain rate 16.1 day 13
Rain days 19
Dry days 11
Wind (mph):
Highest Gust 28.9 day 12
Average Speed 2.3
Wind Run 1670.8 miles
Gale days 0
Pressure (mb):
Maximum 1022.7 day 01
Minimum 989.1 day 12
Summer 2017 was a season of two halves, the mean temperature of 18.5C (1.3C above average) made it the tenth warmest summer since 1797.
Though it was warm overall it was also wet. Nearly 234mm of rain were collected, 159 per cent of average, making it the wettest summer since 1987.
Just under 535 hours of sun were recorded, 94 per cent of average and the sunniest summer for three years.
The graph of the mean temperature for the 3 months shows a marked decline from the second week of JulyThere were at least 3 falls of rain greater than 30mm over 24 hours though classic thunderstorms of recent years were notably lackingSunshine was broadly average
The 8th and 9th of August 2017 has produced probably the most miserable weather of this summer.
A rainfall event that began just after 8am on the 9th deposited nearly 36mm of rain in the Wanstead area over 14 hours.
The 09-09 total of 33.7mm made it the fourth greatest daily August rainfall since 1960.
The heaviest rain fell in a fairly narrow band, as shown by the official 24hr totals on ogimet.com. The low pressure system also produced a lot of rain for the east coast in the previous 24hrs with Bridlington recording over 56mm.
The rain brings the summer total to 207.7mm, just 0.6mm short of the amount recorded in 1997. Though it has been wet it is still a long way short of the wettest summer on record: some 391mm were recorded here in 1903.
In terms of temperature it has been a chilly start to August; the mean temp currently stands 1.2C below the whole month average. Considering CET it has been the coldest start to the month for 30 years.


 The grimmest winter, considering statistics back to 1881, was, ironically, the 1978-79 ‘Winter of Discontent’ when, again ironically, ‘Sunny Jim’ Callaghan was in Downing Street as widespread strikes coincided with the coldest winter for 16 years. On looking at the Top 10 of grim winters it is striking how most coincide with depressing world events, the Great War, World War 2 and the Korean War!


You must be logged in to post a comment.