Today marks the 866th consecutive day that the rolling 365-day mean has been above 12C, a level that is nearly a degree above the average annual mean temperature for this region.
The next longest period, back to 1960, was 499 days starting on June 9th 2003.
The graph below shows that since around 2015 this 23,644 day period has been stuck in a high rut.
Looking at months on their own it has now been over 20 since this station recorded a month around a degree cooler than average.
The monthly mean temperature anomalies considering 1981-2010 averages.
This September is looking like it will be yet another milder than average month. If the mean for 2024 finishes above the level of 12C it will be the third 12C year in a row!
Prior to this an annual mean of 12C has been recorded on only 11 occasions since 1960: 1989, 1997, 1999, 2002, 2003, 2011, 2014, 2018, 2020, 2022, 2023 .
The period around the autumnal equinox appears to be getting wetter in this part of the UK.
Since 9am on Sunday 36mm has fallen at Wanstead, some 60% of the monthly total so far! Elsewhere, not too far away near Milton Keynes, Flitwick has recorded 124mm!
A look at the local stats shows that the week either side of September 22nd has been getting wetter since 2010.
A look at the rolling 10-year average since 1960 shows an increase since 2011.
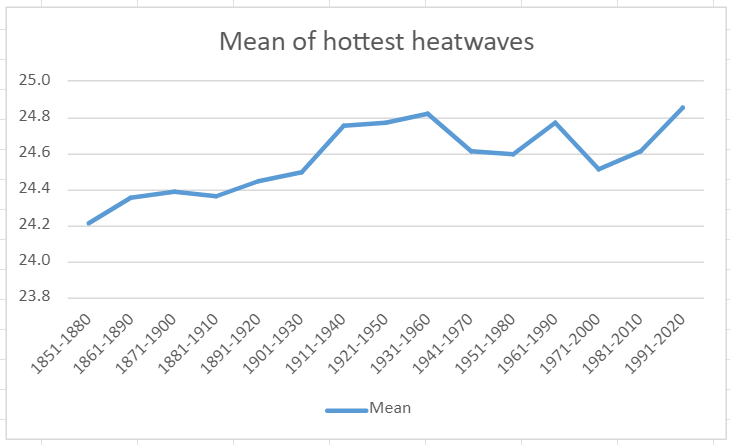
It is no surprise that London’s heatwaves are getting hotter but by what rate are they increasing?
Using a list of hot spells made nine years ago I set out to find how the 30-year trends have moved through the decades since 1852.
The mean of these hot spells has increased from 24.2C in 1851-1880 to 24.9 in 1991-2020, an increase of 0.7C.
Maxima during these spells, on the other hand, has decreased from 32.6C to 31.8C. It should be noted that the spell that produced this area’s hottest ever daily maximum, 40.1C on July 19th 2022, was a 2-day affair that didn’t qualify for the list.
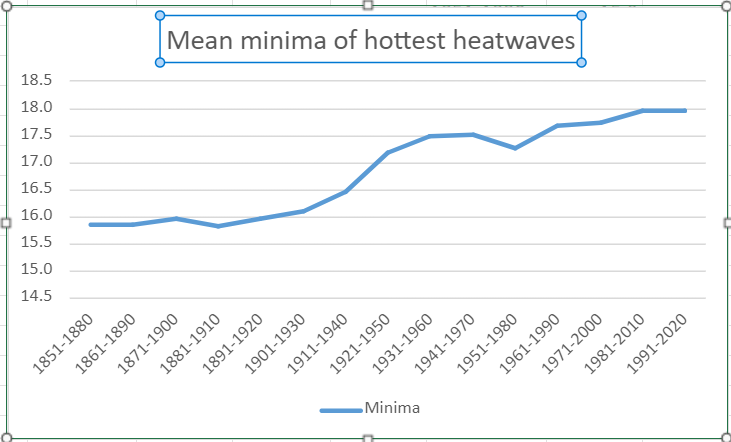
It is the minima that produces the most notable results with average low temperatures increasing over 2C from 15.9C to 18C! The urban heat island in full effect although the estate where a large proportion of these stats are gathered has changed little since it was built in the early 1900s.
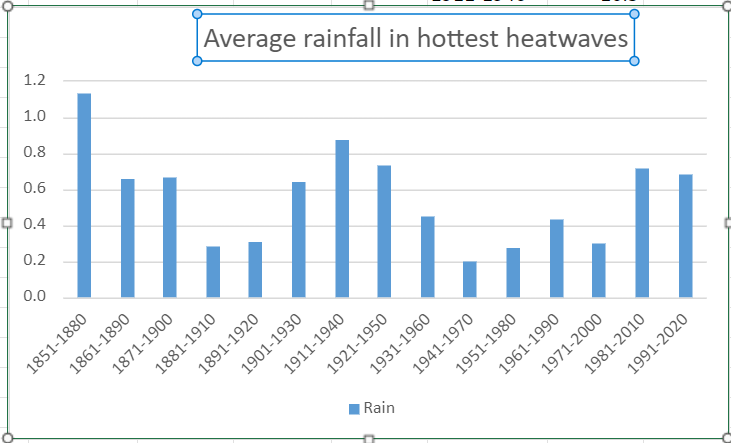
Rainfall during these hottest heatwaves is cyclical, in keeping with daily rainfall patterns observed over the same period.
Average sunshine in these heatwaves has shown a slight decline. It is no coincidence that maxima was at its highest during 1911-1950 when there was most sun. Increased cloud cover overall would take the edge off maxima while making the nights warmer.
Grass roots left for councils to grab, into darkness is nature plunged. By acres of green plastic drab, of reason, we are now expunged. But this is what the people want, of climate we are nonchalant.
Warnings are for other people, yet last year floods claimed your garage. Memories lost, in discharge faecal, not long before the next barrage. Clues are in that relentless march of CET upwards, landscapes parch.
On we go, no time for nature, let us now pave over that drive. Flat Earthers all, blind to danger of the abyss, we’re doomed to dive. Fear not we’ll scrub the atmosphere. Of carbon dioxide from air near.
Fly away we must on breaks grand, Worry about climate later. Holiday firms need that demand, from the poles to the equator. But it’s home, our backyards we need to restore nature, not concede.
The current site hosting Wanstead’s weather station has been running for 11 years next month; the automatic station uploading data every 10 minutes to the internet.
The 10-year averages from the station are now good enough to be listed on the Climatological Observers Link.
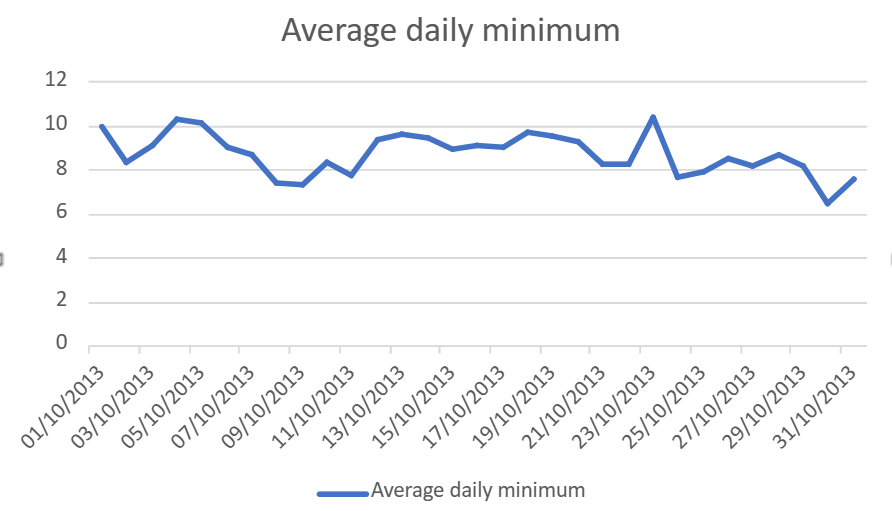
A look at the tenth month shows some interesting trends…
The 9am air pressure readings were not included in previous climate summaries owing to analogue barometers only giving approximate air pressure readings. The advent of AWS has changed that, particularly for independent amateur observers.
A look at the below graphic shows pressure lowest around the 21st, the stormiest weather of the month. Storm Babet in 2023 is proof of that.
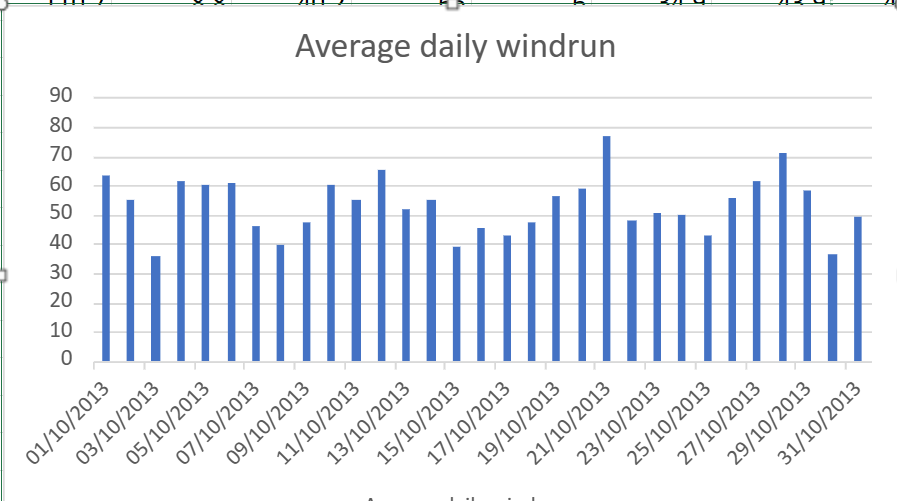
Average daily windrun is how much wind there’s been during a 24 hour period. Again the 21st comes out as windiest.
Last November was on the cold side prompting me to investigate whether we were about to record a third month in a row below average. December turned out to be mild and wet, the lack of snow especially stark in Scotland.
The findings of that study showed that any sustained period of colder than average months was more likely to happen during months of March, April and May, nothing unusual there, especially considering H.H Lamb’s weather types.
I decided to scrutinise further all the colder than average months in this area, considering the 1981-2010 average, back to 1981. This gave the below results.
The dataset covers 399 months, of which 200 were colder than average.
The overall picture shows that negative anomalies are becoming more and more rare, though with notable exceptions being March 2013, December 2010 and January 2010.
The only month that has showed any sort of consistent general decrease in negative anomaly is November.
*For good snowfall at this station needs a negative anomaly of 2C during the months of November, December, January and February.
Since notably cold weather struck at the end of February I’ve lost count of the number of times I’ve heard this phrase uttered by the public and some sections of the press.
Top 20 cold anomalies
The ‘Beast from the East’ (versions 1.0 and 2.0) really captured the imagination in an age where everything has to have a label slapped on it; any message that these cold spells are ‘weather’ and not ‘climate’ seems to get lost.
Both spells, indeed the general pattern of our late winter weather, were driven by the stratospheric sudden warming event that lead to a split polar vortex in February – leading to a very cold end to the month and a mean temperature anomaly of -2.5C, the greatest monthly anomaly since March 2013.
To put it into perspective, however, it was nothing like some of the anomalies that occurred in the early 19th century: January 1814, for example, saw a monthly anomaly of -8.2C and coincided with the last occasion a frost fair was held on the Thames. Januaries back then were generally very cold, the 1801-1831 average monthly mean was -3C, that’s 8C colder than the most recent 1981-2010 average!
So climate now is much warmer but that is not to say that anomalously cold months can’t happen. February 1986 saw an anomaly of -5.6C, the 13th= greatest cold anomaly in my local dataset going back to 1797.
Top 20 warm anomalies
The cold December of 2010 recorded an anomaly of -4.2C, 76th= greatest cold anomaly, while anomalies of -4.1C recorded in January 1979 and March 2013 were 77th=.
With the warming climate it is no surprise that most warm months happened very recently. The balmy month of December 2015 saw a positive anomaly of 5.4C.
The ‘Beast from the East 2.0’ was caused by a narrow tongue of extremely cold air from Russia scoring a direct hit on the UK. The odds of this happening must have been low but it is an example of how, when the synoptics of the atmosphere line up perfectly, anything is possible.
And it is an example how even in a warming climate the UK can still be subject to anomalous cold and warmth at any time of the year.
As the author Mark Twain reportedly once said: “The climate is what you expect; the weather is what you get.”
The upper air anomaly of the ‘Beast from the East 2.0’.
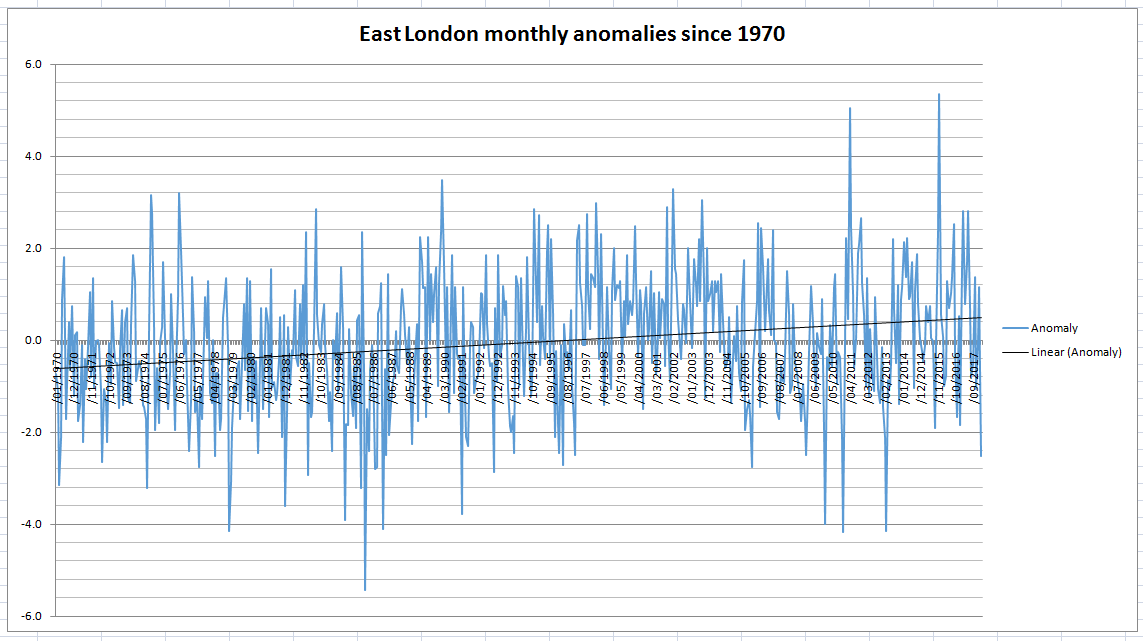
This graphic shows positive and negative monthly anomalies since 1797 against a generally warming climate
Because the above graphic is crowded I created one of anomalies since 1970. The upward trend is the same.
This month marks the 60th anniversary of the Clean Air Act, a piece of government legislation prompted in part by the Great Smog of December 1952 that caused between 4,000 and 12,000 premature deaths.
Air quality in the capital has vastly improved since those days of ‘pea souper’ fogs. A study of sunshine in Greenwich and other sites around east London reveals that winter months are, on average, around 18 per cent sunnier today than they were in the same period before the act was implemented in 1956. Though the cause of this is possibly partly because of a decline in winter anticyclones – weather systems that can give weeks of dull, murky conditions – further environmental legislation has helped.
Though the sky is clearer conditions at street level have grown steadily worse in recent years. During the first week of 2016 it was revealed that parts of the capital had already breached annual EU hourly limits for nitrogen dioxide – a pollutant that causes thousands of premature deaths through respiratory problems each year. A study last year showed that nearly 9,500 people die early each year in London because of long-term exposure to air pollution, more than twice as many as previously thought, according to the research.
Although action is being taken to reduce pollution from diesel buses, taxis and lorries the figures reveal that we are once again getting to the level of deaths caused by the Great Smog. The new mayor of London, Sadiq Khan, seems to be taking pollution a lot more seriously than his predecessor with a number of initiatives announced – making London compliant with EU legal limits well before the government’s target of 2025.
However, the mayor has also sent out conflicting messages by saying he backs the expansion of City Airport – you can’t have it both ways. And, if we do leave the EU, what will replace these EU legal limits?
With the current political situation lurching from one disaster to another I fear that the environment will get pushed well down the agenda. The current list of candidates vying to take over from David Cameron as prime minister include ‘dark horse’ Andrea Leadsom, the energy and climate change minister, who has been an ardent supporter of fracking. And on coal she recently sparked controversy in February where she assured the industry the pledged 2025 coal phase-out was just a consultation and encouraged it to suggest what ‘unabated coal’ means.
The many benefits of EU membership got lost in the debate over the last few weeks – improvement in the environment being one of them. It is why, without the beady eye of Brussels keeping watch over us, that we must ensure that the next government stick to their promise of continual improvement to the capital’s air quality.
Winter sunshine totals were falling before we joined the EU. Since 1973 a general upswing is observed. On average there is 18% more sunshine during winter months since we joined the EU compared with the same period before joining the Common Market
A new suburb the “size of Windsor” is being planned for Barking Riverside, the site of the old Barking Power station, according to a report in the Financial Times.
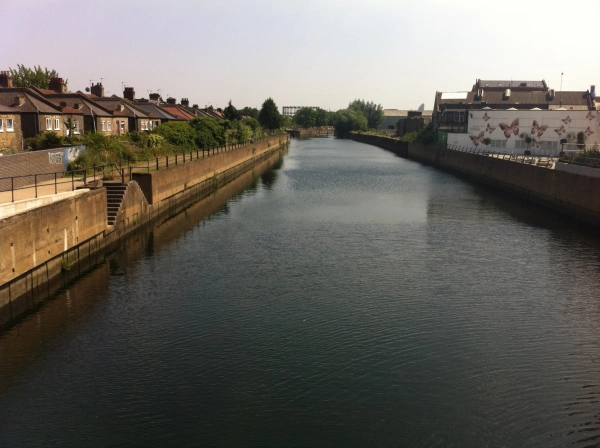
The Barking Riverside site is sandwiched between two sewage works and a power station
Some 10,800 homes are being planned for the 179-hectare site by the housing association London & Quadrant in association with the Greater London Authority. The report states that £70m will be invested in extending the London Overground rail line to the site. But no mention is made on how much will be invested in flood defences.
Nor does it say that the site is sandwiched between sewage works on either side of the river and a power station and the Ford Motor works to the east.
It is part of the Mayor of London’s ambition for a City in the East that also makes no mention of how much money will be invested in flood defences to make these new estates safe.
This 200,000 home masterplan for East London should be music to the ears of anyone struggling to find a place to live in our overcrowded capital.
But unless planners are willing to spend billions on new flood defences it is possible that these new homes will be particularly at risk of flooding should rainfall levels increase with climate change.
The Environment Agency’s Flood Plan map of the Thames illustrates Howard’s comment that “the Thames was so full during this time that no tide was perceptible”
Many of the developments mooted in London Mayor Boris Johnson’s plan for a City in the East are situated on flood plain, according to the Environment Agency.
On reading through the blueprint flood risk isn’t mentioned once.
A report in the Financial Times, citing the plan, says there is much more potential than previously thought to increase housebuilding in east London, the capital’s planning chief estimates. Sites earmarked include the Lea Valley and areas along the Thames beyond Canary Wharf.
‘Thames Riverside’, the term for an area along the north side of the Thames including Barking and Beckton, could host 27,000 homes, while areas on the opposite side of the river could hold 22,000, according to the report. There could be 52,000 more homes in Lea Valley, 30,000 on the Isle of Dogs and 15,000 in Woolwich.
Sir Edward Lister, deputy mayor for policy and planning, believes the capital’s authorities had learned from their experience with the Nine Elms regeneration area, where a statement of intent had galvanised developers.
“We just have to commit and then the developers can move in,” adding that there were “vast” amounts of underused post-industrial sites along the river in east London.
The housing plans also include commercial and industrial buildings, giving potential to create 280,000 jobs, as well as supporting infrastructure such as schools and hospitals. Transport improvements, such as Crossrail and a new London Overground line, would make the developments ‘desirable’. But costs would be dwarfed by any flood defence improvements.
Previously the Environment Agency has outlined a range of options for the future of the Thames Estuary flood defences. None are particularly cheap.
As a minimum, the EA estimates that the cost of maintaining the defences until 2035 will be around £1.5 billion, with an additional £1.8 billion needed to repair and upgrade the defences until 2050. Particular bits of marshland could also be set aside to store tide waters.
The River Lea close to where Luke Howard’s laboratory stood
More ambitiously, the government could fund a new barrier in either Tilbury in Essex or Long Reach in Kent. Such a barrier would be designed to resist the highest surge tides identified by the Met Office’s analysis of how conditions will change this century. The EA estimates a new barrier could cost as much as £7 billion, though that figure could go up if conditions change significantly as the climate changes.
The Agency also say the existing barrier could be converted to include locks, which could open and close more flexibly and extend the life of the defences. The EA report says a decision on a new barrier will have to be made by 2050.
It may turn out that there’s a more pressing reason to spend. The EA says 50 is the maximum number of times the barrier should close each year, and beyond that, the barrier could start to fail.
How high is the likelihood of flooding in this part of London? A look back through history shows the geography of the Lea Valley has made the area prone to inundations for hundreds of years.
The Environment Agency’s Flood Map for Planning shows the flood zone risk of the area. And endorses Howard’s account that the river Lea was ‘a mile wide’ at its peak
In January 1809 the lower River Lea burst its banks in several places following a deluge that dumped two inches of rain in the space of 24 hours. The rain abruptly ended a snowy cold spell that had begun over a month before in the middle of December. From Luke Howard’sreadings it is likely that up to half a metre of snow had fallen in the previous weeks in the upper parts of the surrounding countryside with only slight thawing. With the frozen ground unable to absorb any of the rapidly melting snow and rainfall the amount of water flowing downstream must have been immense. Howard takes up the story…
“The River Lea continued rising the whole of the 26th… The various channels by which it intersects this part of the country were united in one current above a mile in width which flowed with great impetuosity and did much damage.”
Howard, his chemical factory located on the banks of the river Lea close to what is now Bow flyover, wrote at length about the event, his account replacing the usual brief notes about daily weather in his book The Climate of London.
He talks of embanked pasture land being “filled to the depth of eight or nine feet” and people driven to their upper rooms relieved by boats plying under the windows.
“The Thames was so full during this time that no tide was perceptible.” It took until February 23rd for things to return to normal.
Miraculously no lives were lost in the flood and cattle “by great exertions” were saved by being kept in their stalls. Howard, saying that the flood could have been far worse, believed a neap tide, strong westerly winds urging water down the Thames and mild weather helped avert a tragedy.
Howard’s statistics of the previous months show that the second half of 1808 were wetter than average – though not especially so. And nothing like the rainfall this area recorded during the winter of 2013/14. From December 1st until February 8th 1809 Howard recorded 130mm of rain, which is about 100mm less than what was recorded during 2013/14.
This fact alone shows just how much the nature of the river has changed in the last 200-odd years thanks to spending on flood defences.
Work to improve the defences was prompted 67 years ago when similar catastrophic flooding came with the thaw that ended the severe winter of 1947, one of the coldest winters in history and an episode remarkably similar to what Howard recorded in 1809.
The Lea Valley, along with many parts of the country, saw some of its worst flooding in a generation. The river burst its banks at several points bringing misery to surrounding communities. Valleys turned into lakes in 40 counties and East Anglia’s fens were a sandbagged inland sea. More than 100,000 properties were damaged and, then as now, heroic battles were fought by the military to keep water-pumping plants and power stations dry.
A marker of that flood, together with a history of flood defences, can be found here. There is also British Pathe footage of another flood between 1910 and 1919 here .
Spillers Millennium Mill was repainted 25 years ago especially for the concert. It now provides the backdrop for the London Triathlon across from the ExCeL centre
The River Lea Flood Relief Channel, that flows between Ware, Herts, and Stratford, took almost three decades to complete. The channel incorporates existing watercourses, lakes and new channels. Since it was completed in 1976, there have been no major flood events in the Lea Valley, although there have been three occasions when the river system was full virtually to its capacity: in 1987, 1993 and 2000. Since its completion, the level of protection afforded by the structure has declined, so that in some areas it offers 2 per cent protection, and in some, only 5 per cent protection. The EA published a strategic environmental assessment in 2008, which looked at ways to maintain the flood defences in the Lea Valley.
In summing up its ambitions for a new development the Greater London Authority says it is trying to “overturn the historic perception of the east being seen as apart from London, rather than as a part of London”.
Jim Ward, a director of research at property consultancy Savills, said the challenge was “building something that makes people want to live and work there”, he said. “You need to build more than homes, you need to build a place.”
Boris’s record of late has not been good: an estuary airport to replace Heathrow has been dismissed as pie in the sky while his promise for a 24-hour Tube was made without first consulting unions that it was possible.
London’s safety from flooding is an altogether different proposition, both for old and new developments. Boris really needs to get London’s flood defences right before any brick is laid on these desperately-needed new developments.
The climate of London can vary greatly to figures revealed in the Central England Temperature series. Because this dataset covers an area of the UK enclosed by Lancashire, London and Bristol the resulting monthly mean temperature can often be quite a bit lower than what is experienced in the capital.
Though these anomalies are smoothed in the monthly series that stretches back to 1659 notable daily extremes that happen nationwide tend to get lost. One example was earlier this month when the UK’s November maximum temperature record was broken. Trawsgoed in Wales reached 22.4C on the afternoon of the 1st whereas a largely foggy east London recorded just 11.5C.
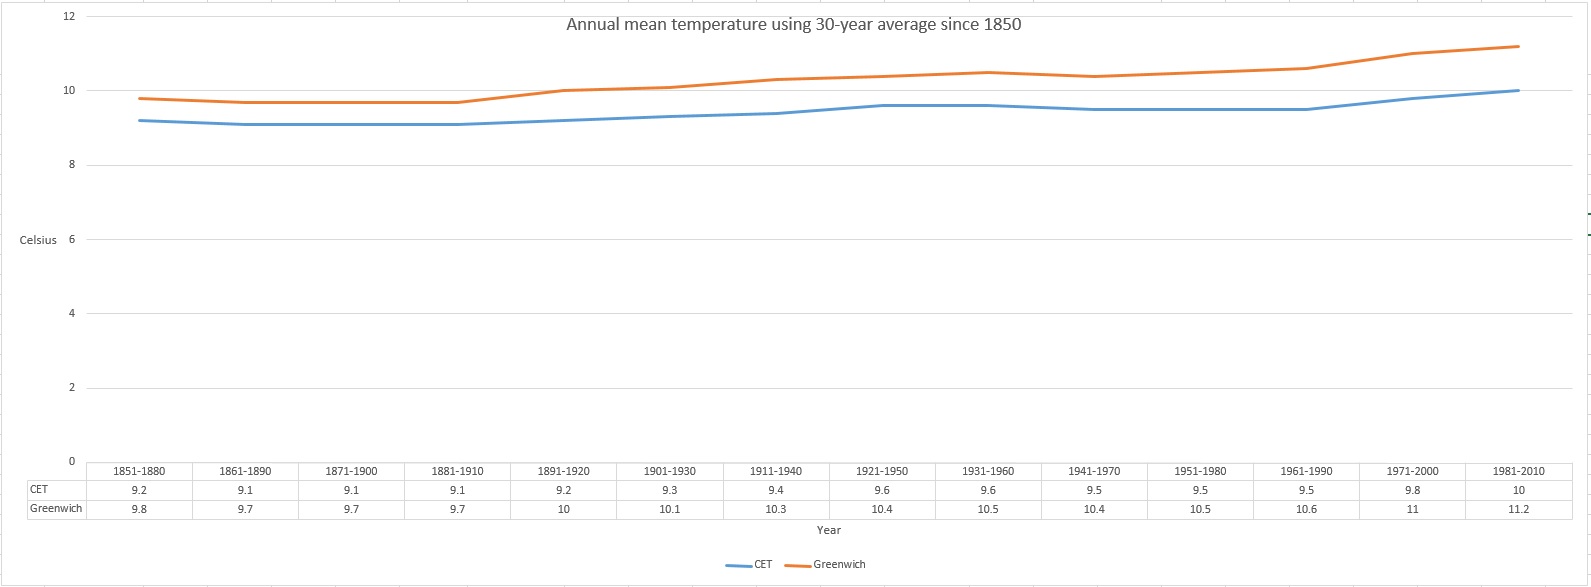
Comparing CET with data from Greenwich back to 1850 reveals a gradual decoupling between the two series, the warmth of London’s urban heat island effect an ever-growing influence.
The 1851-1880 30-year average means show that Greenwich was 0.6C warmer than the CET series. By 1981-2010 this gap had widened to 1.2C – indeed the London series is today 1.4C warmer than it was in 1851-80 whereas CET has warmed by only 0.6C.
Delving further into the data reveals an increase in the number of times that the 30-year average mean is being breached by at least 1.1C. The period 1961-90 was the warmest in both cases with the mean being breached by 1.1C or more on four occasions in the case of CET and five in London. It is interesting to note, however, that the largest anomaly in the CET series is 1.3C in 1921, greater, albeit by only 0.1C, than the warm years of 1990 and 1999.
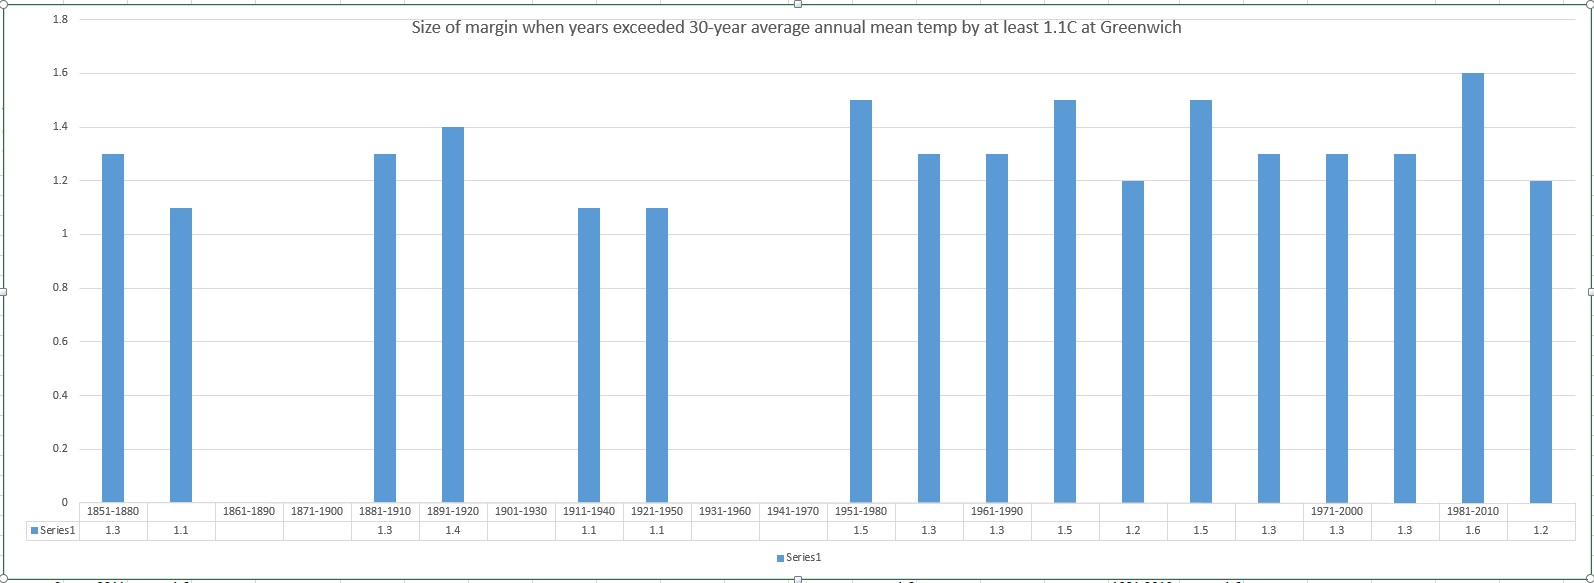
The largest anomaly in London, 1.6C, was set in 2011, 0.1C higher than 1999, 1997 and 1989.
The graph below shows the number of occasions that the 30-year average has been exceeded in each period by 1.1C or more. With 1961-90 being so warm it appears that CET warming has slowed though it should be borne in mind that we have another five years before the 1991-20 series can be released.
With reference to the London graph below showing the number of occasions that the 30-year average has been exceeded in each period by 1.1C or more merely confirms that the level of the anomalies have increased but, as already mentioned, there are probably far more outside influences affecting the outcome such as UHI, population growth, further industrialisation etc.
The accelerated warming is a worry in terms of how London would adapt should summer temperatures greatly increase, though, of course, it remains to be seen if the anomalies will advance even further from current levels.
Global temperatures are on the rise though our part of the globe may not be as adversely affected as elsewhere.* The CET dataset is the longest instrumental record of temperature in the world. The mean, minimum and maximum datasets are updated monthly, with data for a month usually available by the 3rd of the next month. A provisional CET value for the current month is calculated on a daily basis. The mean daily data series begins in 1772 and the mean monthly data in 1659. Mean maximum and minimum daily and monthly data are also available, beginning in 1878.


You must be logged in to post a comment.