Hot and bothered by London heat escalator

mean temp 23.5
Total days where the mean temp was 23.5C or higher

There are 2.5 times as many hot days during summer in London as there were 100 years ago – that’s the result I have found while looking at data for Greenwich going back to 1851.

Very hot conditions, where the mean daily temperature is 23.5°C or higher, as defined by the Met Office’s Heat-Health Watch System, have been achieved in this area on 199 days since 1852.

The Met Office, and other meteorological agencies, use 30-year averages to smooth any spikes of hot and cold years – so the result, in my view, is quite remarkable – even though it is just one dataset.

Looking at the data overall it can be seen that while average maxima has decreased by 1.6°C since 1881-1910, minima has increased by 2.1°C.

new max min 30 yr
30-year hot day max / min average since 1881

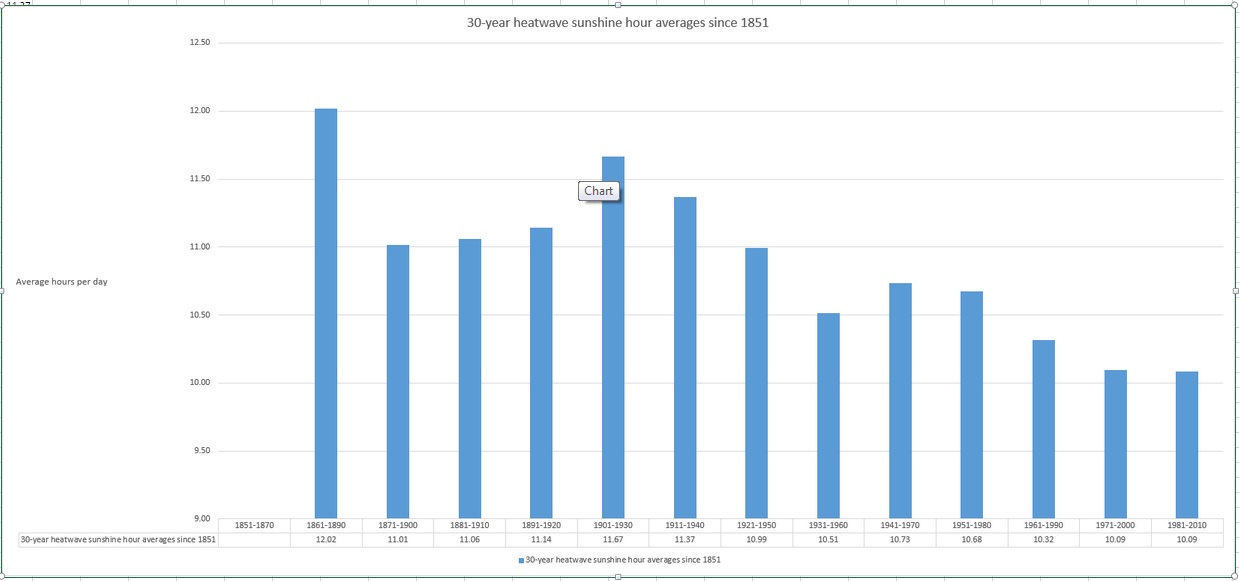
The decreased maxima is possibly explained by the fact that the sun shines, on average, just over an hour less than it did a century ago. The reason for this could be because of increased air pollution and aircraft contrails?

The increased minima, on the other hand, could be being caused by the fact that vast tracts of suburban front and back gardens are now paved over – along with the loss of the shade of many trees. This, and increased road and house building, acts as a huge radiator, keeping nights warmer than they would have been a century ago.

Experts would question the hybrid nature of my dataset, even though my observing sites are very close to those of Greenwich. It is a shame that many of the first climatological stations, such as Camden Square set up in the early 19th century by George Symons, are not still around as they would now offer an unquestionable insight into just how much London’s climate has warmed.

Sunshine hours have decreased since the 19th century

You could argue that there is no doubt that the warming in these data is man made though, perhaps, paved gardens keeping summer nights warmer would be a lot easier and cheaper to solve than fulfilling the carbon capture policies of many of the world’s governments. But that is an argument for another post.

For now, as the capital’s population continues to increase, it is vitally important that planners get the next generation of property developments right to keep the population cool when a heatwave strikes. Extreme heat severely affects public health, not least the suicide rate – a study has shown that above 18°C, each 1°C increase in mean temperature has associated with a 3.8 and 5.0% rise in suicide and violent suicide respectively. Planners cannot just leave it to energy-hungry air conditioning to bring relief – developments should incorporate plenty of shade and natural cooling in their designs to help counteract the health impacts of future heatwaves.

* There were hot spells before the period in this post but I have excluded these: Luke Howard’s maxima observations from Plaistow, Stratford and Tottenham were taken under non-standard conditions and may be on the high side.

** I have focused my investigation on data recorded at the Royal Observatory, Greenwich. For some reason the data during a couple of years in the 1950s was incomplete – to fill in these gaps I used official data gathered at Kew. The data is completed up to the present day using my own observations taken since 1988.

Summer forecast 2015: average

This summer is looking an average one. Before you write it off, however, average summers do come with decent spells of warmth and sunshine. But I think the old saying that an English summer consists of three fine days and a thunderstorm will be used more than once this year…impending

To reach my conclusion on this summer I have used pattern matching of meteorological data from this area for March, April and May stretching back to 1799.

The dry and sunny weather of March and April was tempered by a very average May. The mean for the spring season was 10.5C with 75.8mm of rain and 511 hours of sunshine.

If you take into account all years that were within +/- 10 per cent of these figures, for rainfall and then mean temperature, you get the following table.

The ‘best fit’ years were revealed as 1844, 1870, 1880, 1943, 1995, and 2009. As an average this summer could be expressed as: Mean: 17.4C (about average) Rainfall: 127.3mm (below average) Sunshine: 567hrs (about average)

spurOr, expressed in probabilities, I concluded the following:

Very Warm ( above 20.4) 0%

Warm (19.4 – 20.3) 0%

Rather warm (18.4-19.3) 17%

Average (16.9C – 18.3C) 50%

Rather Cool (15.9 – 16.8) 33%

Cool (14.9 – 15.8) 0%

Very cool (below 14.8C) 0%

Very Wet ( 3.8 x average) 0%

Wet (2.9  x average) 0%

Rather wet (1.9 x average) 0%

Average 50%

Rather dry (0.7 x average) 33%

Dry (0.5x average) 17%

Very dry (0.25 x average) 0%

So from the above you could deduce that the next three months will be average to rather cool, with average to slightly below average rainfall. Sunshine average.

Trying to predict daily detail over the next 3 months is impossible, but looking at the ‘best fit’ years mentioned above it is probable that the opening 10 days of June will be among the coolest of the summer. Screen Shot 2015-06-03 at 03.15.12

Of interest to most will be when are the hot spells most likely to happen. Considering the median of all rain days a dry spell happened without fail between the dates of June 28th – June 30th and August 15th – August 19th; both these spells likely ending with thundery breakdowns. Another date to bear in mind for a possible two-day fine spell is July 24th-25th.

So, all-in-all, a mixed bag. Looking at the ‘best-fit’ years, however, it is worthwhile noting that although the overall picture looks average there exists the record-breaking dry August of 1995 and the notably wet and thundery July of 1880.

My summer forecast last year was broadly correct. How this one will fair obviously only time will tell. One could argue that what I’m forecasting is just climatology which has a good chance of being correct should no external influences, such as a huge eruption on Mount Etna, have a bearing on the end result.

* Taking into account the fact that temperatures in London are up to 0.66C warmer than they were 100 years ago I have added 0.66C to mean temperatures before 1915.

** Obviously, in the event of a series of direct hits from thunderstorms, my rainfall estimate could be hopelessly short – a symptom of abundant solar energy at this time of year which creates a ‘noisy’ atmosphere compared with winter.

*** The 1981-2010 average mean for summer in this region is 17.6C, with 144.9mm of rain and 564 hours of sunshine

May 2015: average temps and dry

After a sunny and dry April last month was disappointing for anyone looking for prolonged heat and sunshine. Indeed the month saw nearly two dozen less hours of sunshine than April.

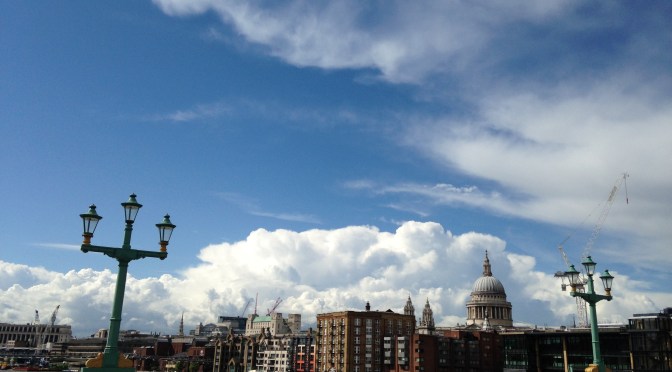
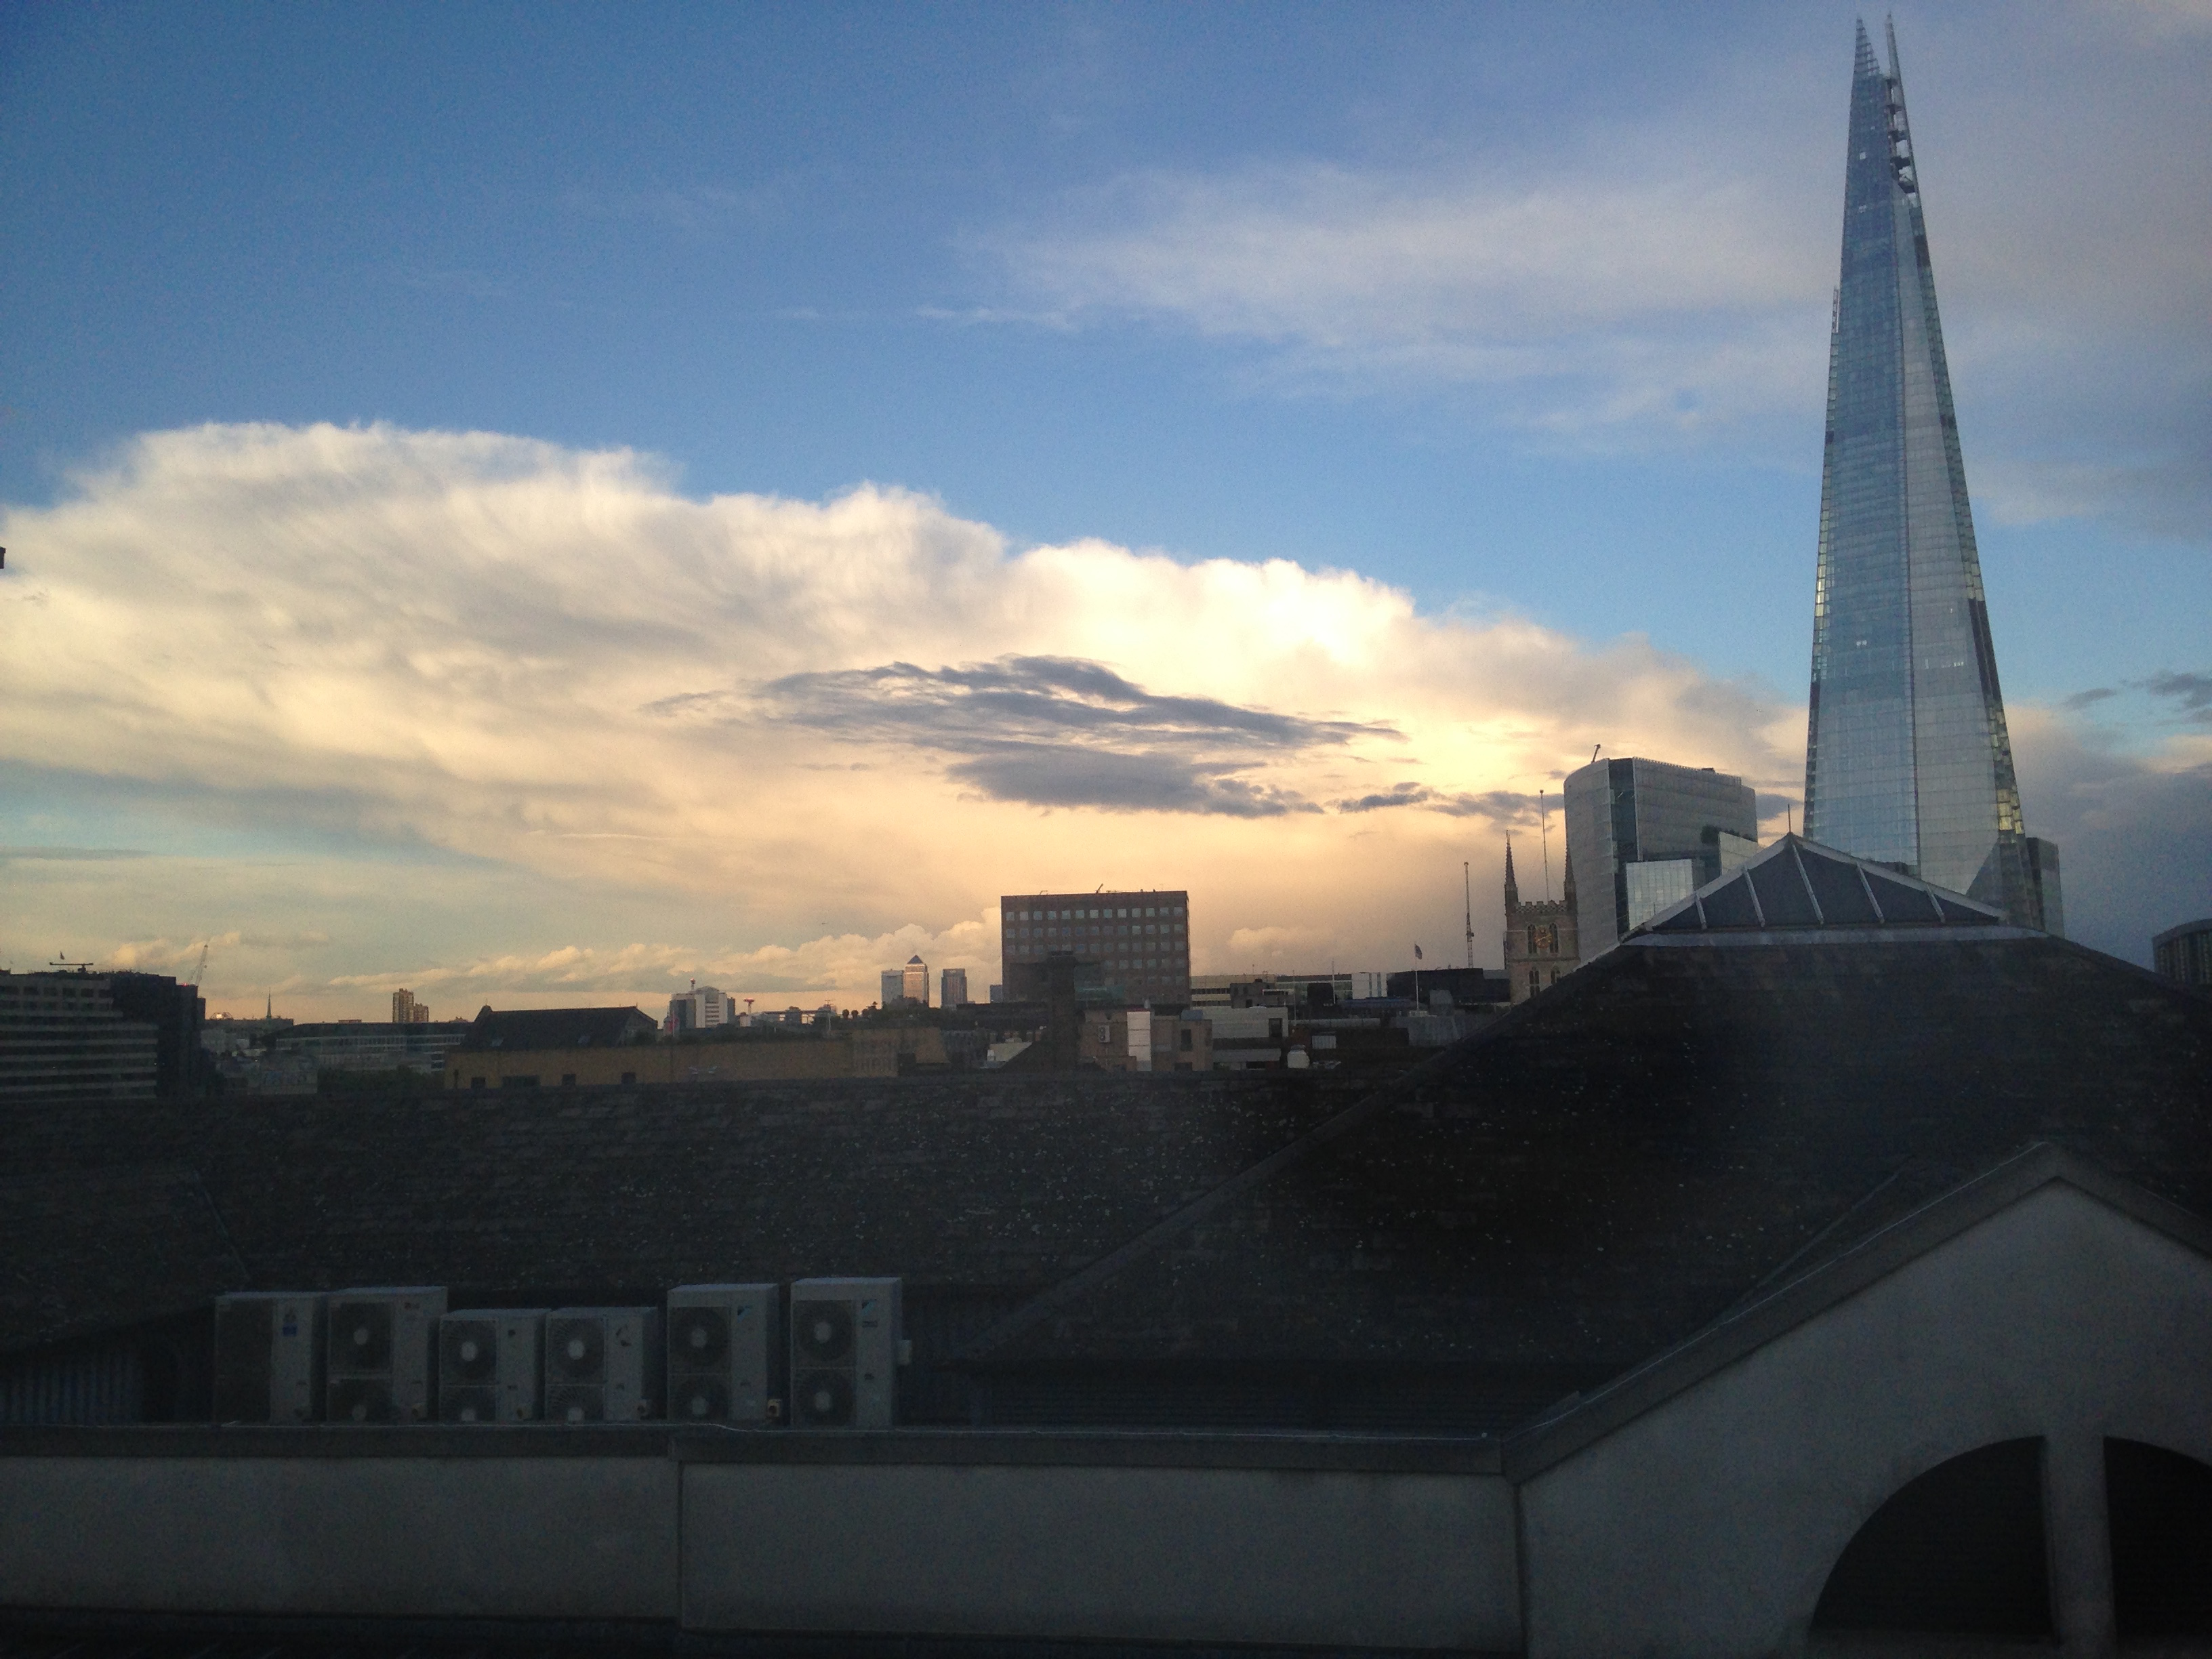
During a very thundery day nationwide on 19th it was bright and sunny looking west on Southwark Bridge at 3.40pm...
During a very thundery day nationwide on 19th it was bright and sunny looking west on Southwark Bridge at 3.40pm…

Maximum temperatures were low for May – the highest being just 23.3C on 11th, 2C colder than the highest temperature in April.

Mean temperature for the month was 13.4C, 0.3C above the 1981-2010 mean. Rainfall of 38.9mm was 76% of average – six of the last seven Mays have been notably dry.

There were 178.5 hours of sunshine recorded in this area which is 98% of what we can expect to see during an average May. The wettest day occurred on the 4th with 8.2mm.

So what has June got in store weatherwise? The models this morning (June 1st) suggest a very unsettled start to the month before the Azores high builds a ridge to quieten things down for a couple of days. Beyond that is uncertain – the ensembles point to a very mixed picture with no clear trend shown to where we might be in a fortnight’s time.

Looking east was a different story which revealed a distant thunderstorm

Looking at the month as a whole my long range method suggests June will be average in terms of temperature: 54% probability. The next highest chance is for rather cool at 15% probability. If you add the probabilities together the chance of average to below average temperature is 85% – which would seem to rule out a ‘very warm’ month…

Rainfall is looking average to slightly above average, though at only 62% probability. It looks like another broadly average month in terms of sunshine.

So with a slightly changeable start to the month we can look forward to another average month without prolonged heatwaves?

My May outlook was good in that it saw the high chance (80%) of average temperatures. I was, however, out with the low rainfall – the signal was for something greater than average. Sunshine, as already mentioned, was also out – my forecast was for something 1.2 above average.

May 19th was a very thundery day across eastern England. This picture was taken looking east from Southwark

Full stats for the month here: http://1drv.ms/1rSfT7Y

Here follows the full weather diary for May…

1st: Sunny start but cloud quickly filled in. Though cloudy it remained bright. Cold wind.
2nd: Cloudy start but becoming brighter. Turned to hazy sun at 3.30pm but then turned cloudier. Rain by early hours, 5am and then again at 8.30am.
3rd: Cloudy after early rain then growing warm and muggy with sunshine at 2pm. It stayed bright and muggy into the evening.
4th: Sunny start then haze and cumulus soon thickened before clearing to sunny spells early lunchtime. Cloud built up again at 2pm. Rain spread in early evening with heavy bursts from 11pm to 1.30am – heaviest at midnight.
5th Cloudy start but becoming brighter albeit very windy through the morning and past lunchtime. Occasional showers with very heavy shower at 6am.
6th: Cloudy start with brighter interludes but turning very blustery with occasional light showers. These turned heavier through the day with a notable one at 2pm. Thunder heard at 5pm with more showers.
7th: Sunny start but with lots of cloud bubbling up

Wanstead was hit head-on by a thunderstorm at 2pm on 19th, clearly shown on this radar picture. Because the storms were fast moving rainfall accumulation was not remarkable

8th: Bright start after early light shower. Spots of rain during bright afternoon – these turned heavier at 3.30pm. Cloudy and mild overnight.
9th: Bright, slightly breezy start. Spells of very warm sunshine though also odd spots of rain during showers.
10th: Bright start with sunny spells through the day
11th: Bright start with altocumulus. Cloud broke to sunny spells though sky was very hazy at times. Feeling humid. Warm overnight but short, sharp shower moved in 10 minutes before obs time.
12th: Light rain to start from a frontal feature. This clearing to sunny spells and pleasant afternoon
13th: Sunny with few cirrus to start. More cloud bubbling up later. Clear at first overnight before cloud and light rain moved in before 9am.
14th: Cloudy but spits and spots of rain spread in, before more steady light rain at 10.30. This eased at noon before becoming heavier again at 3.30pm and rained into evening, easing up at midnight.
15th: Sunny start though cloud tended to fill in. Some rain around midnight
16th: Cloudy start though got progressively sunnier as cold front cleared, humidity fell and cloud melted away. Very pleasant. Cool overnight.
17th: Sunny, clear start with a few cirrus. Cloudier at times but still sunny spells. VERY breezy with f4/5 headwinds on ride to station. Rapidly changing skies with wind shear.
18th: Some light rain to start, this intermittent through the morning.
19th: Bright and breezy start. T-storm developed at 2.30pm but moved through quickly. Was two more, at 5pm and 7pm – notable rises in pressure as troughs moved through.
20th: Bright start. Light shower bubbled up late afternoon.
21st: Sunny start, cloud gradually filled in though.
22nd: Bright start with sunny spells. Warm.
23rd: Cloudy with a very thick layer of strato-cumulus making it dull. Two hours of light rain and drizzle followed but cleared to leave it bright with a couple of sunny intervals in the evening. It felt humid at first but turned much fresher once the drizzle cleared.
24th: Sunny start though cloud filling in to make it bright. Frontal light rain between 3 and 5pm.
25th: Cloudy most of the day, a few bright intervals though spits and spots of drizzle early evening.
26th: Sunny start with fluffy cumulus. Pleasant.
27th: Dry, warm and sunny all day. Heavy rain in York from 3pm to 8pm. Felt chilly in the wind.
28th: Dry, lots of cloud around
29th: Dry start though rain moved in between 11am and 1pm. Then sunny spells and breezy.
30th: Sunny though soon clouded over before clearing again to sunny spells. Mackerel sky observed at 8.30pm. Rain between 2.15am and 6.30am.
31st: Light rain to start with outbreaks throughout the morning. Some brightness mid to late afternoon.

UK media in a fog over El Niño predictions

When it comes to explaining weather phenomena the British media has often been found wanting over recent years. But when the Australian Bureau of Meteorology yesterday confirmed the emergence of a fresh El Niño newspapers and TV stations inevitably reached the conclusion that the phenomena will trigger a severe winter in the UK.

Sky News told us that it “could also result in a harsh winter for the UK; during the last El Nino in 2009/10, Britain suffered heavy snowfall”, before showing us newsreels of what looked like conditions in December 2010 – the winter after.

Not to be outdone the Daily Telegraph moved the effects forward to this summer, telling us the effect *could* herald a “damp summer with temperatures well below average”.

I decided to have a look at the facts to see what the effect of an El Nino episode was by comparing the US weather agency NOAA’s data on ENSO episodes going back to 1950 with my own data. For speed I used my top ten snowy winters and compared against the NOAA data.  The results showed that eight cold winters followed an ENSO pattern that was negative. The winter of 2009-10 seems to be the exception to the rule. Indeed, a significant El Niño episode in 1997/98, preceded the third warmest winter in my series going back to 1797!

el nino

El Niño / ENSO is just one variable when it comes to forecasting a season ahead. Other variables to consider are AO, QBO, MJO and this is before SSWs, sudden volcanic eruptions and sunspot activity throw spanners in the works.

It is exasperating that both the Sky and Telegraph stories were copiously shared on social media – prompting the inevitable comments along the lines of: “They’re talking rubbish, they can’t forecast what that weather will be tomorrow!”

But rather than badly informed journalists it is the Met Office and other noble agencies who will share the blame if the story is incorrect.

There is no doubt that El Niño will disrupt the weather around the Pacific rim but, considering the data we have available, I don’t think it, alone, will be the reason Britain may experience a severe winter this year.

* XMetman has had a long look at the data and couldn’t find a link either

** NOAA’s monthly diagnostic discussion just released (14/5) says:

There is an approximately 90% chance that El Niño will continue through Northern Hemisphere summer 2015, and a greater than 80% chance it will last through 2015.”

Read full advisory here


April 2015: very dry and sunny

April showers bring spring flowers – or so the saying goes. The month was actually sunny and very dry with less than 50% of what falls in a normal month.

The cold nights and often chilly days helped to preserve spring blossom, with some stunning displays on streets around the borough.

Indeed just one day, the 30th, was what you could say was a classic April day – a sunny, clear morning saw convection build towering cumulus clouds with a light shower around lunchtime.

Mean temperature for the month was 10.6C, 0.8C above the 1981-2010 mean, over 1C cooler than April last year. Rainfall of 18.9mm was 45% of average – six of the last seven Aprils have been notably dry.

There were 201 hours of sunshine recorded in this area which is 126% of what we can expect to see during an average April. The wettest day occurred on the 25th with 4.7mm. Air frosts: 5 Ground frosts: 13

So what has May got in store weatherwise? The models this morning (May 1st) suggest next days remain unchanged with troughs moving NE across the UK over the weekend introducing warmer air with a mix of sunshine and showers following. A new LP looks like developing over western France on Monday becoming absorbed in the main low to the west of the UK bringing a more sustained westerly feed ahead of rising pressure from the south later toward the weekend, bringing fine and summery conditions. The risk of rain should decrease as the week goes on.

Beyond that the outlook, as ever, is uncertain.

My long range method suggests the month will be average in terms of temperature: 80% probability. The next highest chance is for rather mild at 20% probability. Rainfall is looking average to slightly below average, though at only 60% probability. It looks like another sunny month is in prospect – 80% probability of sunshine at 1.2 times the mean.

So with a slightly changable start to the month we can look forward to another sunny, pleasant spring month without heatwaves?

Long spells of cirrus gave a solar halo on the 17th.

My April outlook was good in that it ruled out any chance of a very mild or very cold month. The combined probability of 72% for an average to rather mild month was correct. I was, however, completely off with the rainfall, the signal for which was greater than average

Full stats for the month here: http://1drv.ms/1rSfT7Y

Here follows the full weather diary for April…

1st: Bright start but very breezy through the morning and afternoon. Rain after 11pm and again at 3.30am.
2nd: Bright start though sunny spells increased through the day. Felt really pleasant out by noon. Some rain in the early hours before obs time.
3rd: Cloudy through the day with some rain late afternoon.
4th: Cloudy all day though with some drizzly rain. Some brightness was seen on way in to South Kensington in the Whitechapel area.
5th: Cloudy, cold start but with sunny spells developing through the day. Pleasant in the sun.
6th: Sunny start with cloud building from time to time. Cloud cleared overnight to give a ground frost.
7th: Sunny start with long clear periods through the day.
8th: Cloudy start gradually cleared to hazy sunshine. Cloudier again in afternoon.
9th: Cloudy start though soon brightening up for a sunny day in town.

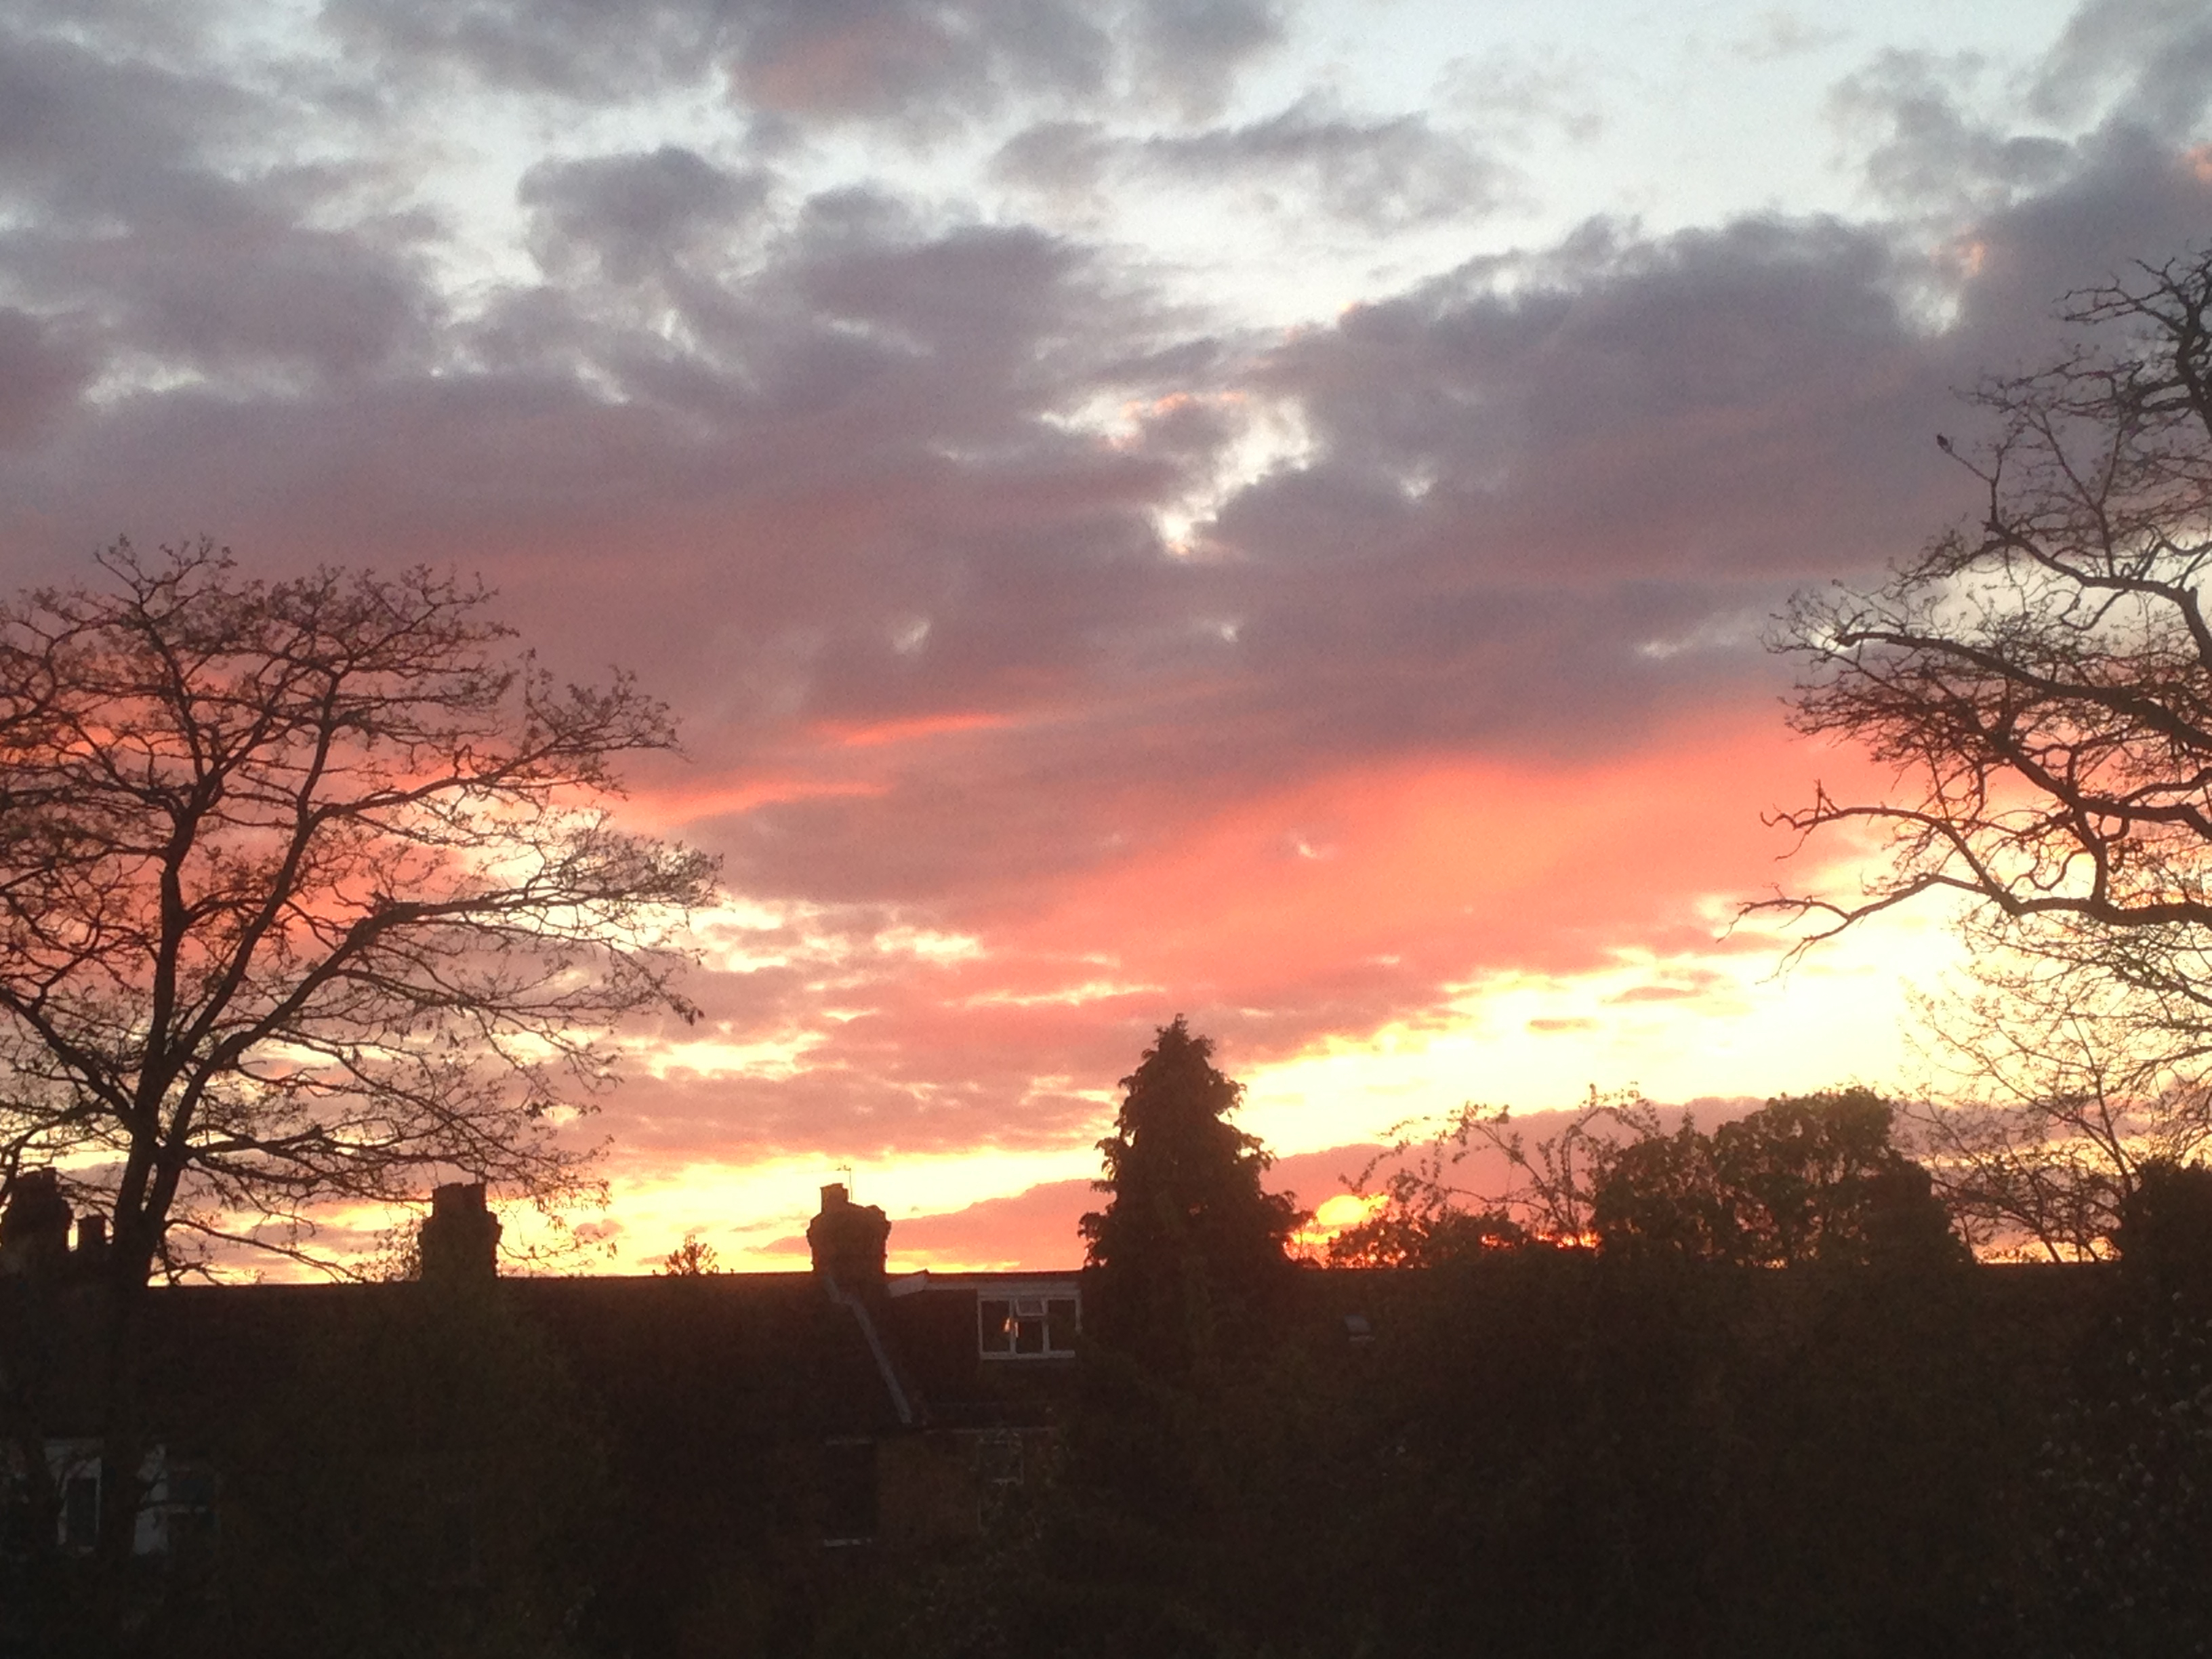
Typical April days of sunshine and showers were in short supply. There were some stunning sunsets, including this one on the 30th

10th: Cloudy start though cloud quickly thinned to leave sunny day. However, cloud was hazy at times with bad pollution seen over London. Also a few drops of rain were observed rain around edge of Ornamental Waters. Humid.
11th: Drizzle turned to moderate rain that was over in 45 minutes and cleared to sunny intervals, then longer sunny periods through the day. Much cooler than yesterday.
12th: Sunny start led to a day of long sunny spells. Sky was initially a deep blue but hazy cumulus built up after 4pm.
13th: Cloudy start, some brightness in the afternoon.
14th: Sunny, gin clear start. Sunny all day with light breeze taking edge off temp.
15th: Sunny, clear start for RMetS meeting. Slight breeze kept edge off temp. Some light clouds late afternoon. Cooling off quickly in early hours.
16th: Sunny spells in the morning.
17th: Sunny though long spells of cirrus gave a solar halo. Chilly in the wind.
18th: Sunny spells to start though cloud decreased to leave gin clear afternoon. Dew point dropped to 1.5C making it feel very chilly.
19th: Bright start but cloud quickly filled in leaving it feeling cold in the wind. Some sunshine after 5pm making it a pleasant if a bit cold in the wind evening.
20th: Sunny and mostly clear all day. Much warmer.
21st: Sunny and mostly clear all day. More contrails though. Chilly overnight again.
22nd: Sunny start though cloud filled in earlier than yesterday. Nowhere near as warm.
23rd: Cloudy start though the cloud decreased and was gin clear by 12.15pm.
24th: Sunny start although hazy at times. Cloud gradually increased late afternoon and light rain arrived 1am.
25th: Cloudy start though plenty of breaks in the cloud developed allowing for a pleasant afternoon.
26th: Slight drizzle to start then cloudy and cold all day. Cold overnight in clearer spells.
27th: Sunny start. Clouds bubbled up though the day with showers reported elsewhere. It threatened rain in Wanstead but stayed dry.
28th: Sunny start with just a few clouds through the day. Feeling cold though.
29th: Light rain to start though this suddenly cleared at 10.15am before clouding over again.
30th: Sunny start with clouds bubbling up. A light shower in Snaresbrook.

Veteran trees that make Wanstead Park

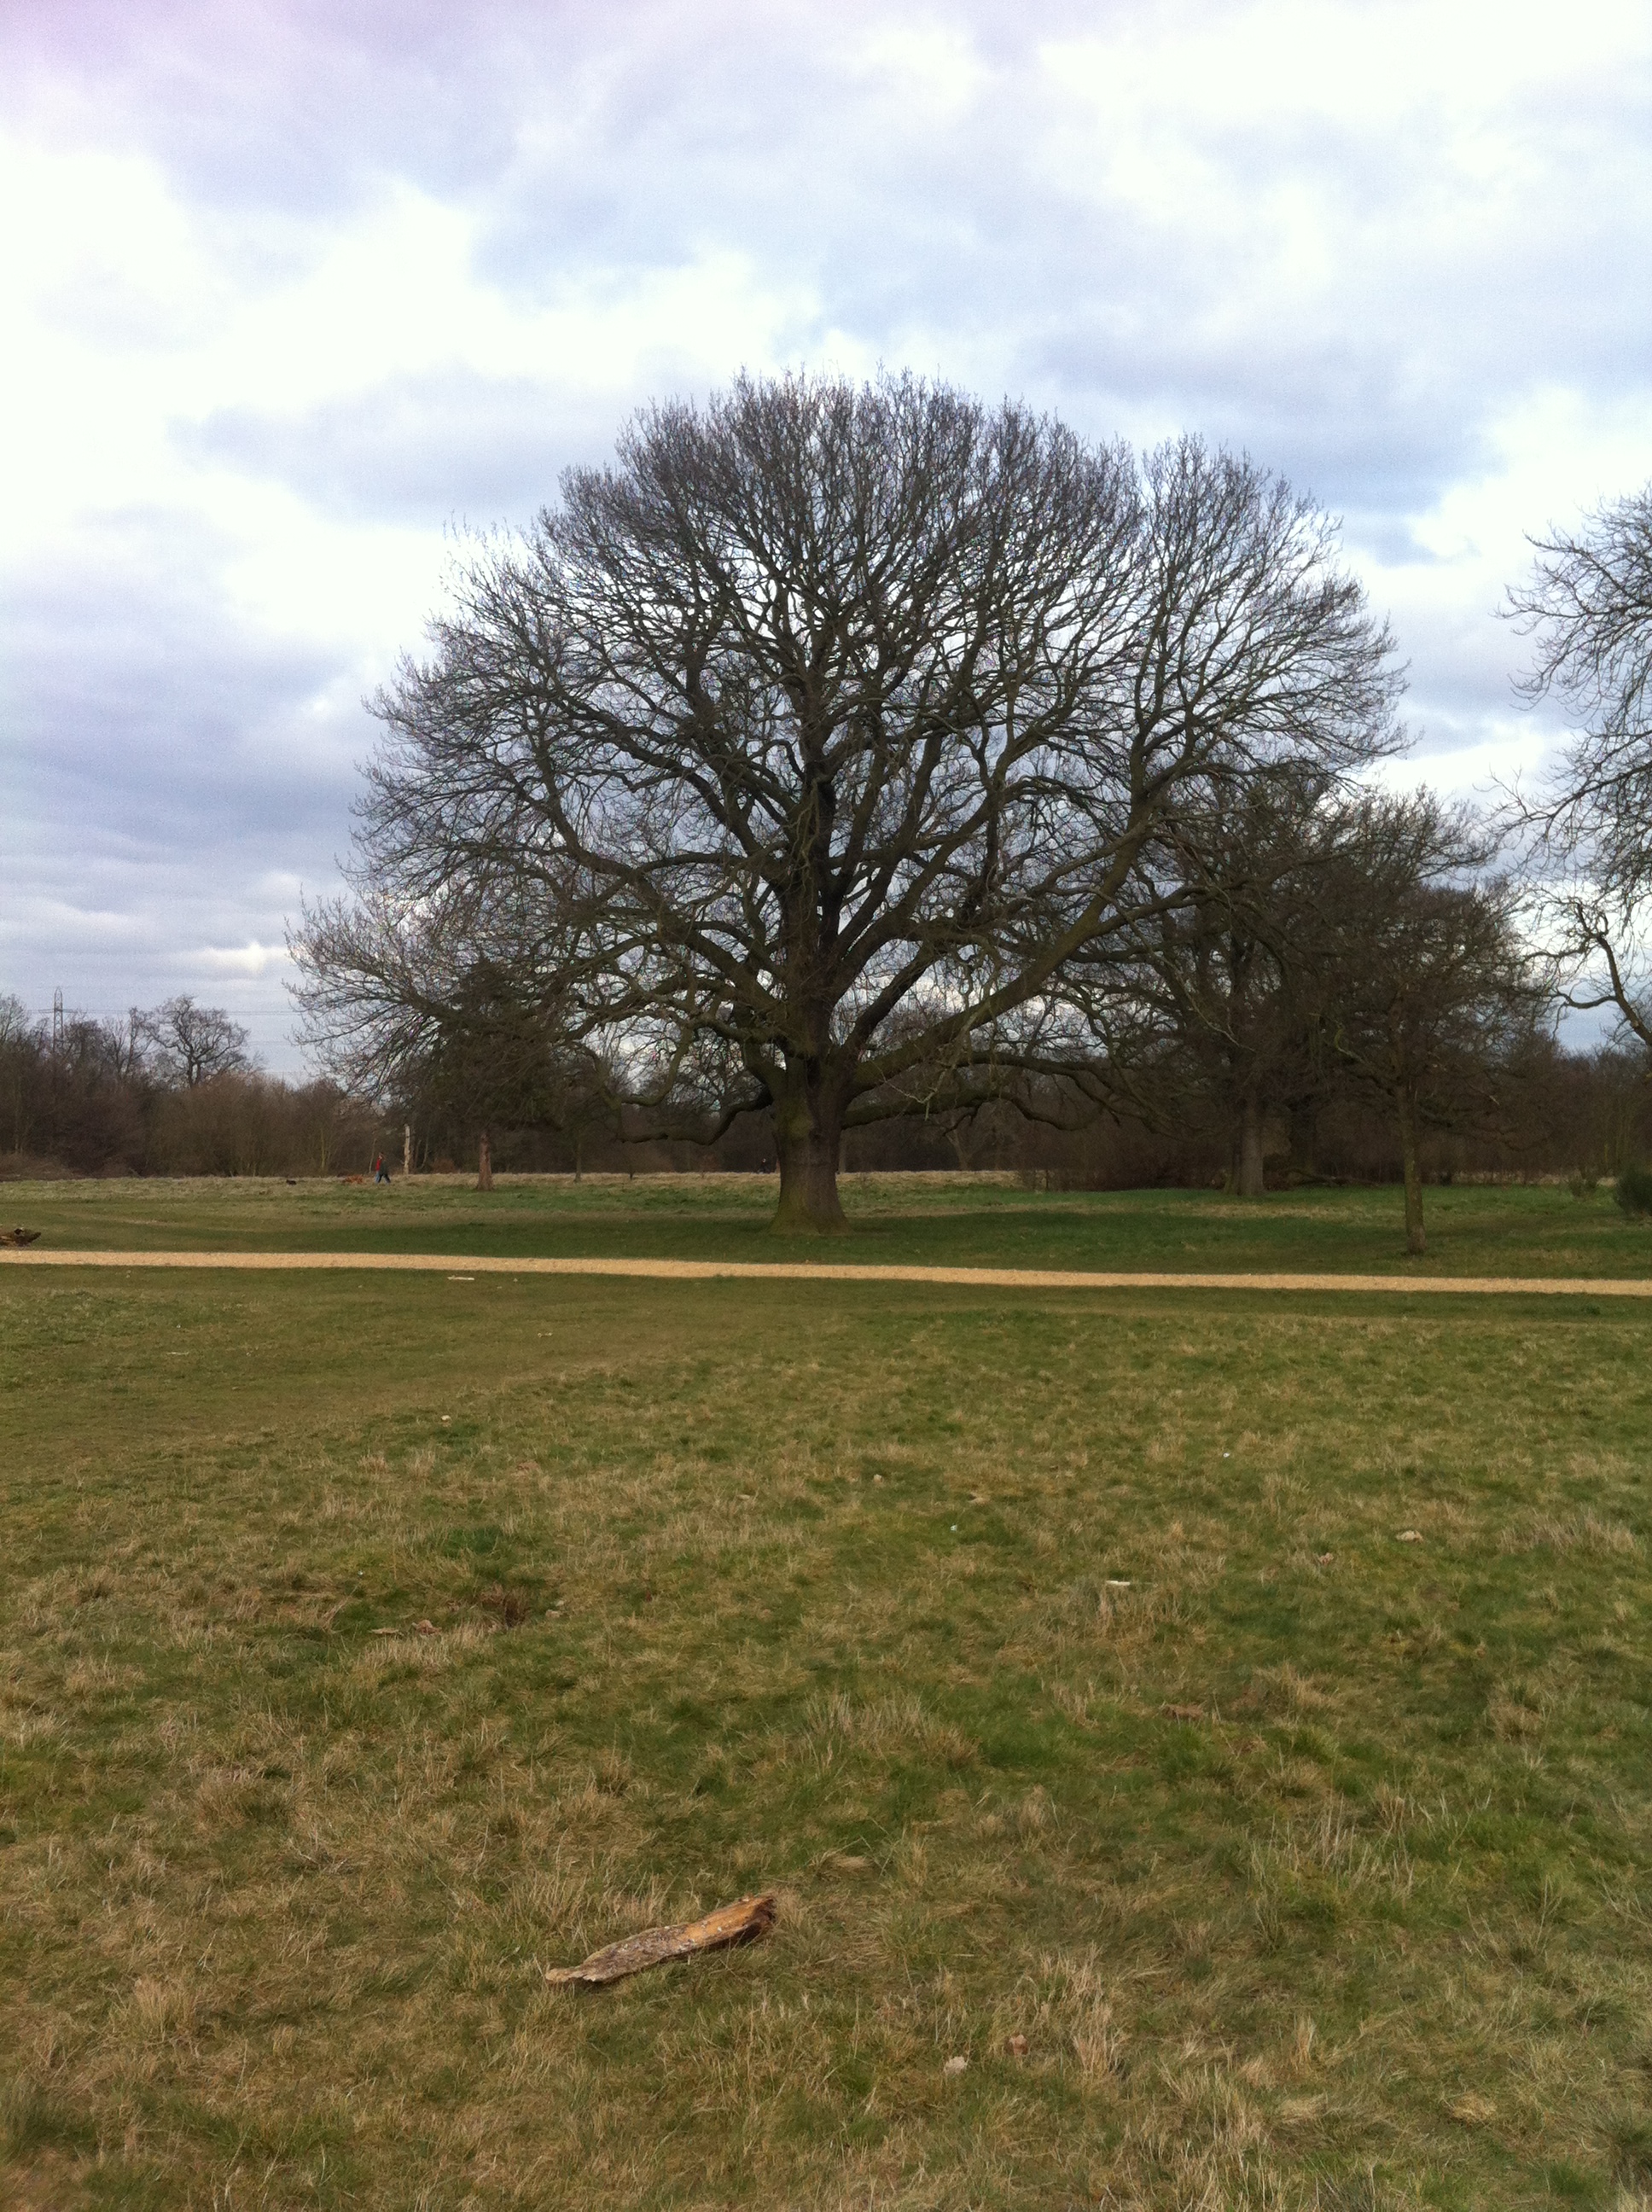
As the trees in Wanstead Park start bursting into life it is interesting to note that the oaks seem to be beating the ash trees into leaf.

One of the magnificent oaks that provide the backdrop to Music in WansteadPark was in leaf on Friday, April 11th.

After the dry vernal equinox period this could be another sign of a dry summer to come as the saying goes…

If the oak before the ash then we’ll only see a splash.

If the ash before the oak then we’re sure to get a soak.

The story behind the mature trees in Wanstead Park – several of which will turn 200 this year – is a fascinating one.

The park is virtually on my doorstep and it’s like watching a living painting as the trees change from season to season. Spring is my favourite time of year, as the character of the park transforms so quickly. Chalet Wood bursts into colour with a carpet of bluebells, and leaves once again clothe the trees.

Magnificent specimens of oak, horse chestnut, sycamore and holly stand alongside half-rotten victims of gales over the last 200-odd years. But despite storms and floods, the biggest nemesis to these trees was the former owner of the park, William Long-Wellesley. As well as demolishing Wanstead House in 1823 to help clear his debts, Long-Wellesley also sold thousands of mature trees, despite local opposition and a court injunction brought by Sir Edward Sugden, who was seeking to restrain Long-Wellesley’s depredations on his children’s inheritance.

A court report from the time states that Long-Wellesley had marked 2,000 trees for sale, which would have included hardwoods, such as oak, chestnut and elm and perhaps walnut and lime. To quantify that figure, it should be noted that the last full tree survey of the park, not including Bush Wood, in April 1990, listed just over 800 trees.

Richard Arnopp, committee member of the Friends of Wanstead Parklands, said: “There is general agreement that Long-Wellesley left the park more or less devastated, but the wooded areas subsequently regenerated within their former footprints, helped by later planting and management by the Corporation of London.”

It is not clear who bought the trees, though oak was especially valuable at the time for shipbuilding, which was still some decades away from the shift from timber to iron. Britain was at the end of the first Industrial Revolution and timber suitable for making masts, a crucial requirement for any sailing ship, and one that often had to be replaced after storms or wear, was difficult to find.

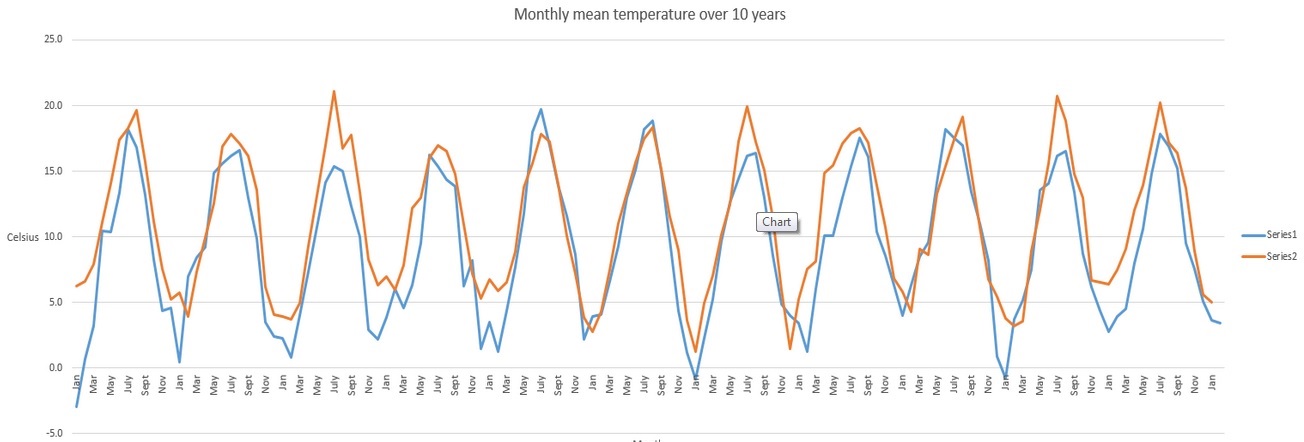
This graph shows the monthly mean temperature for the periods 1814-1825 (series  1, blue line) and 2004-2015 (series 2, orange line). Notice how much colder most winters were 1814-1825
This graph shows the monthly mean temperature for the periods 1814-1825 (series 1, blue line) and 2004-2015 (series 2, orange line). Notice how much colder most winters were 1814-1825

It was also a cold period. Just over 10 years previous the Thames froze over for the last time and winters were frequently very cold and snowy. Wood was one of the principal methods of keeping warm – house fires would have been burning through the winter – anyone with a wood stove would know just how much wood you can get through, even in an average winter.

As well as selling timber, Long-Wellesley reportedly sold the topsoil of Wanstead Flats to nurseries as potting compost. Most of the mature trees in the park today would have been saplings in the 1820s, thus escaping the attention of Long-Wellesley. According to the Debois survey from 1990, the cedar tree near the Ornamental Water has this year reached its 200th birthday. Also 200 years old this year are the three magnificent oaks next to the Temple, one of which has increased in girth from 319cm to 372cm since 1990.

The trees were protected for future generations when the Epping Forest Act was passed in 1878. Since that time, the Corporation of London has managed their welfare and a new initiative will soon step up this care and reinstate even more of what was lost during Long-Wellesley’s tenure.

* There is much more detail at the site http://www.wansteadpark.org.uk/

** The author has studied forestry and arboriculture at Capel Manor College in Enfield

Spring signs for a dry summer?

What kind of summer is in store this year? According to Richard Kirwan’s weatherlore we’re odds on for a dryer than average season.

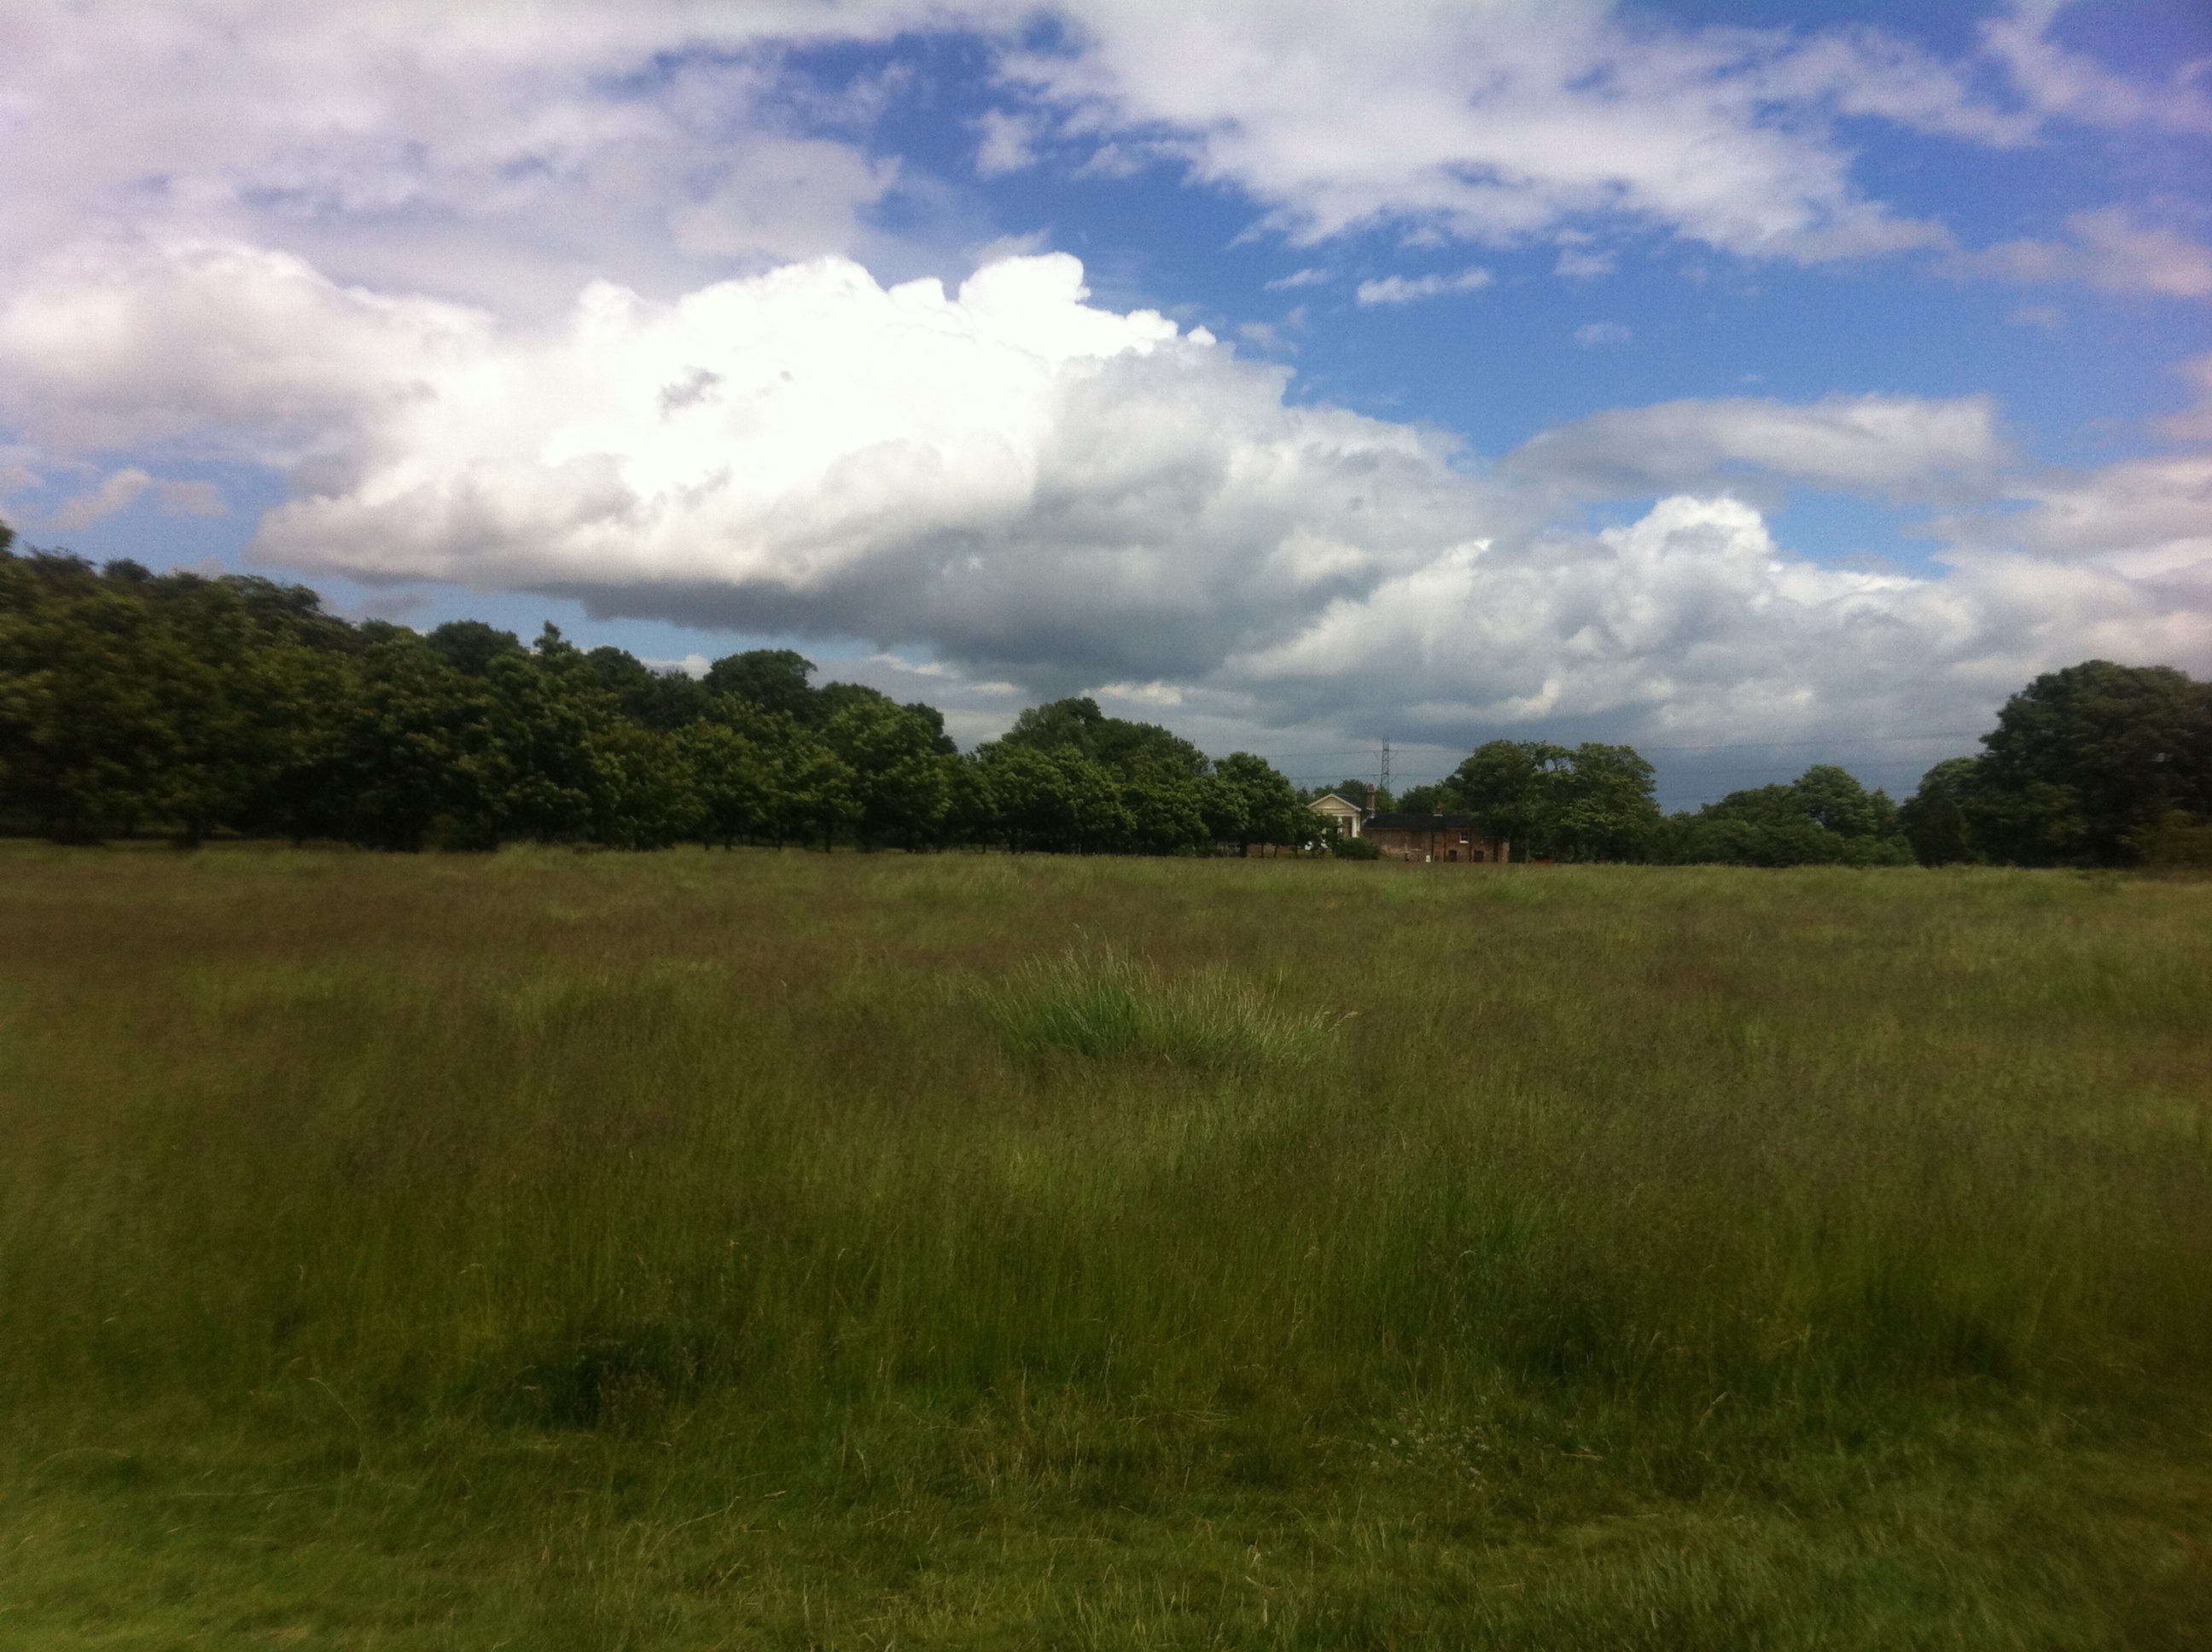
Summer overlooking The Temple in Wanstead Park by Wanstead Meteo
Summer overlooking The Temple in Wanstead Park

Kirwan, a Dublin-based chemist with a keen interest in the weather, deduced from observations made from 1677 to 1789 that the weather around the spring equinox provided a very good pointer to what was in store in the months ahead.

The lore, noted in Luke Howard‘s Climate of London, suggests that the probability is five to one in favour of a dry summer.

The detail, however, hinges around key dates.

1/ When there has been no storm before or after the vernal equinox the ensuing summer is generally dry, at least five times in six.

2/ When a storm happens from an easterly point on the 19th, 20th, or 21st of March the succeeding summer is dry, four times in five.

3/ When a storm arises on the 25th, 26th, or 27th of March, and not before, in any point, the succeeding summer is generally dry, four times in five.

4/ If there should be a storm at SW, or WSW, on the 19th, 20th, or 22nd of March, the succeeding summer is generally wet, five times in six.

Howard goes on to say: “Dry summers (this philosopher states) are the consequence of uniform winds, from whatever quarter they may blow; as wet summers are of their variation, particular if in opposite directions.”

Again, “Southerly winds are most frequently accompanied with rain in most parts of Europe at least, and probably in most parts of our hemisphere; but northerly and easterly, with clear dry and serene weather.”

And it seems reasonable to suppose that the wind which is to prevail during the summer, may most frequently set in with the vernal equinox.”

I’ve had a look back through my own records and this theory falls down, when you consider the absolute detail, on notable summers including 1995. But then, just like weather forecasting at short range, it is all about ‘chance’ – five times in six is still only an 83 per cent certainty.

There is also the matter of how Kirwan and Howard defined a “storm”. What we would call a storm now would be very rare in the second half of March anywhere around London, possibly less rare in the Dublin area. I am also assuming that Kirwan remembered to take into account the switch from the Julian to the Gregorian calendar in 1752.

What is notable, however, is how far ahead of their time Kirwan, Howard and other scientists were in having the thought to notice these patterns – something that continues to fascinate amateur and professional meteorologists alike today.

March 2015: dry and sunny with av temps

The saying March: in like a lion, out like a lamb and vice versa is frequently wrong. This March saw it windy at the beginning, end and middle of the month.

This graph shows the 'wind run' of every day in March. Notice how the peaks are at the beginning, middle and end of the month
This graph shows the ‘wind run’ of every day in March. Notice how the peaks are at the beginning, middle and end of the month

Mean temperature for the month was 7.6C, 0.1C below the 1981-2010 mean, over 1C cooler than March last year. Rainfall of 17.9mm was 44% of average – four of the last five Marches have been notably dry.

There were 131.5 hours of sunshine recorded in this area which is precisely 121% of what we can expect to see during an average March. The wettest day occurred on the 29th with 4.2mm. Hail fell on 1 day. Air frosts: 5 Ground frosts: 13

So what has april got in store weatherwise? The models this morning (April 1st) suggest a dominance of high pressure though there’s lots of uncertainty as to where this will drift once it has formed over the Easter weekend. If it moves north there is a risk of chilly easterly winds at times that will take the edge off temperatures.

Rainfall amounts will be small after the next couple of days though sunshine amounts will be reduced if we get the cold easterly feed off the continent. Beyond that the outlook, as ever, is uncertain.

My long range method suggests the month will be average in terms of temperature: 43% probability. The next highest chance is for rather mild at 29% probability. Rainfall is looking greater than average, though at 57% probability.

My March outlook was good in that it ruled out any chance of a very mild month. Though the signal was for a cold month overall I think the fact that Scandinavia and Russia had a relatively mild winter meant that the resulting overall temperature was far milder than it normally would have been, given the air flow.

treewpFull stats for the month here: http://1drv.ms/1rSfT7Y

Here follows the full weather diary for March…

1st: Sunny start with more cloud afternoon and a rain squall sweeping through at 5.30pm. Cold wind.
2nd: Sunny start though cold wind. Odd shower.
3rd: Sunny start but with cloudier periods and odd spot of rain up to 2pm. Skies turned really dark to the north but no reports of heavy rain. Cold overnight but no air frost due to the wind.
4th: Sunny spells with cloudier intervals.
5th: Sunny, frosty start. Cloud bubbling up with sun becoming scarcer.
6th: Sunny and clear with just a few cirrus.
7th: Sunny start, just a few cirrus though more breeze
8th: Sunny start though more clouds bubbling up than yesterday.
9th: Sunny start was quickly replaced by overcast conditions. Spots of rain on way into work – signs of something heavier when left work at midnight. Clear again by morning.
10th Sunny start with some cirrus type haze. Cloud bubbled up but sunnier than yesterday.
11th: Sunny start, cloud growing thicker through the day before a pink sunset. Some light rain before a clear night.
12th Sunny start and just a few clouds around. Cloud thicker in afternoon.
13th Hazy bright start though cloud thickened.
14th: Sunny start quickly turned cloudy and dull. More brightness in afternoon though cold wind. Early shower at 6.30am.
15th: Dull start into the morning. Some light rain late morning and during the afternoon. More rain after midnight and just beofre dawn.
16th: Cloudy start though with bright intervals in the afternoon. Area of light rain around 4am.
17th: Cloudy start with light rain spreading in. Brighter by 1pm though very misty on ride in to work. Misty again overnight.
18th: Cloudy, misty start though much more sunshine than yesterday on ride to Lea Valley. Cloudier overnight.
19th: Cloudy and dull all day, feeling cold – the cloud persisting into the evening.
20th; Cloudy start for the eclipse. The sky cleared about 12.30pm to leave bright sunshine and a pleasant, springlike afternoon. Early ground frost before sky clouded over.
21st: Cloudy but some spots of drizzle mid-morning. Dry and cloudy afternoon.
22nd: Sunny start though cloud increased through the day. Felt cold in the wind.
23rd: Bright start with lots of sunshine through the morning. Gradually filling in though feeling much milder than of late. Some light rain in the evening, heaviest between 3.30am and 5am.
24th: Cloudy start though with some bright spells. A short shower at 3ish.
25th: Sunny, cloudy start though with lots of high cloud filling in. Brief ground frost moved in just before midnight before rain moved in just before 4.30am.
26th: Drizzly light rain to start – felt cold. Not a nice day.
27th: Bright start with lots of watery sunshine through the day. Spits and spots of rain later as walked home from Wanstead.
28th: Cloudy start and mild with some brightness. Feeling mild. Some rain overnnight.
29th: Drizzly start with heavier bursts of rain, these fell through the day, drying up in the evening.
30th: Bright start with some sunny spells. Wind increased in strength through the day and was very strong overnight.
31st: Bright start after a stormy overnight that prompted a tug rescue that overturned in the Solent. Dartford Bridge was also closed. Showers surrounding Wanstead but only trace here – hail seen in City. Cold and windy overnight.

Eclipse 2015 in Wanstead

While heavy low cloud obscured the partial eclipse in this area there were a couple of interesting factors that I observed.

At 9.45am, shortly after the maximum obscuration of the solar disc the air pressure suddenly dropped. This coincided with sudden relief to my blocked nasal passages, symptoms of which appeared last night. Eighteen minutes later the fall in air pressure became less steep and the nasal symptoms returned.

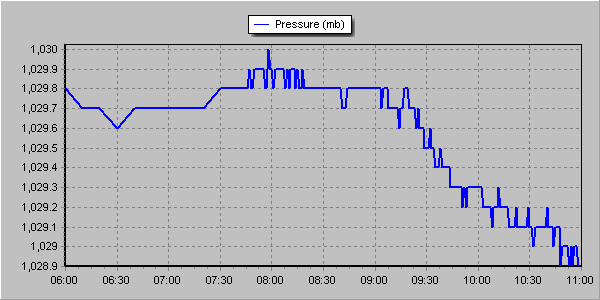
The pressure dropped from 1029.8mb at 9.15am to 1029mb at 10.15am. I'm not sure if it was an effect of the eclipse or just a change in the synoptic situation that would have happened anyway
The pressure dropped from 1029.8mb at 9.15am to 1029mb at 10.15am. I’m not sure if it was an effect of the eclipse or just a change in the synoptic situation that would have happened anyway

As the light began to fade it seemed to turn colder though, on looking at the actual figures, the effect of the partial eclipse through heavy cloud was a depression in temperature of 0.3C. I worked this out by comparing today with yesterday which had almost identical weather conditions. People remarked that it turned noticeably colder though perhaps this was more caused by standing out in temperatures of 4.9C for a long period.

Like the eclipse in 1999 I noticed that the birdsong quietened somewhat though there was not the same crescendo of noise that you normally get at dusk when birds roost.

Here is the temperature trace from the 19th. Even with the heavy cloud yesterday there was more warming from the sun, albeit by a very small 0.3C
This graph shows the temperature from 6am until 11am. Though the depression during the eclipse was just 0.1C comparison with the previous day, which saw near identical weather conditions, shows just how much solar heating was depressed

Winter 2014/15 – second sunniest on record

This winter was the second sunniest on record in this region. Sunshine hours totalled 238 hours during December, January and February – that’s 142% of average and second only to 2007/08.

It was the sunniest December on record in the series going back to 1979. Some 11 mornings were completely clear at the 9am observation time
Winter 2014/15 was the second sunniest on record with 238 hours of sunshine

The first lying snow for two years is also a notable observation of winter 2014/15. That it lasted just a few hours emphasises how little snow there was at sea-level for the second winter in succession.

The mean temperature of 5.2C was just 0.3C below the 1981-2010 average. Some 152mm of rain fell – that’s just 7mm over the winter average.

Winter began with the sunniest December on record in my series going back to 1877. Over 90 hours of sunshine was recorded in this area which is 224% of what we can expect to see during an average December.

January saw the first falling snow in nearly two years with the last three days of the month seeing the first flakes of winter – nothing much to write home about by average winter standards.

February produced the first lying snow in nearly two years. The 1cm depth at 9am on 3rd, however, is nothing much to write home about by average winter standards.

The wettest day during the three months was January 12th when 13.1mm fell.

Snow fell on 6 days. Air frosts: 27 Ground frosts: 48

Full stats for winter can be found here: http://1drv.ms/1rSfT7Y

At the end of November I published my annual winter forecast. I said the season would *probably* be colder with a better chance of snow than last winter. If I’m honest I thought we’d see more incidents of snowfall though, with my predicted mean temperature of 4.2C being exceeded by 1C, the air around the UK just wasn’t cold enough for snow at sea level. My predicted rainfall was more impressive – I forecast 156mm and was out by just 4mm!

Obviously when the season is average long-range forecasts like this have a much higher chance of being correct. One could argue that basic climatology has made my forecast look a reasonable one. But I stick to what the stats suggest and try to steer clear of the endless hyperbole published almost daily by certain tabloids.

Meteorology-based musings about east London and beyond