
It’s been an unusual autumn so far. A very notable lack of sun from the end of October into November was followed by an early cold snap before Storm Bert brought flooding chaos to parts of south Wales, the West Country and elsewhere.
Just before the beginning of every winter I have a crack at predicting what winter will be like; the results often being very mixed.
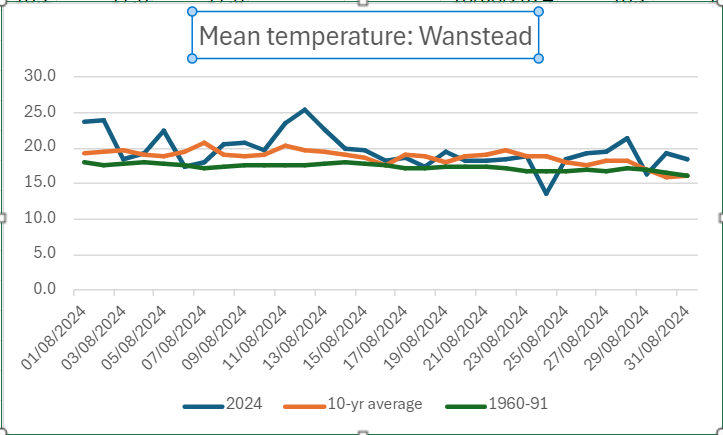
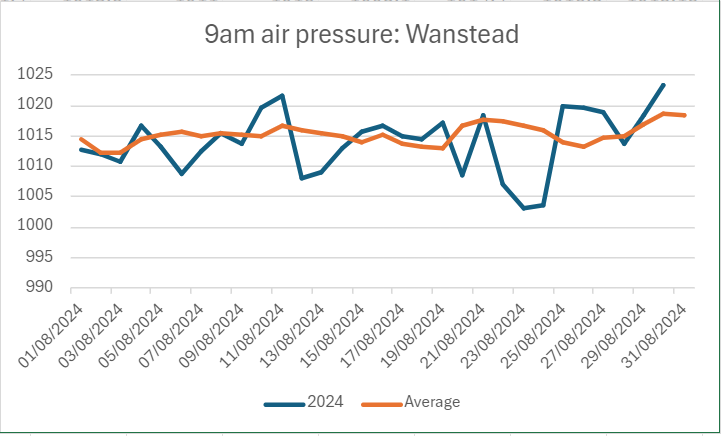
However, on looking at the stats so far there’s virtually no years that have been similar to this autumn; the one year being 1968.
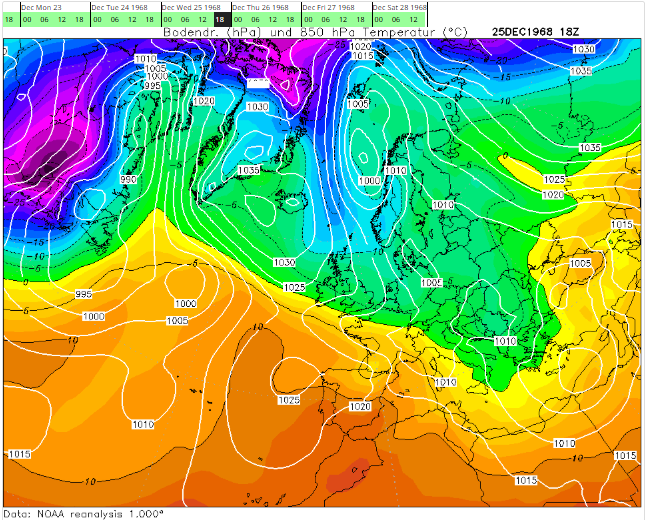
1968, looking back at reanalyis charts, swung from mild to cold with snow on Christmas Day. The Weather Outlook mentions the conditions on the 25th.
Though the odds are very long at this stage the 850mb chart for 1968 is not beyond the realms of possibilities given the recent synoptic patterns. And if not the 25th I would suggest that a cold snap between Christmas and New Year is a better chance than evens this year.
1968 was the year Bing Crosby sung an alternative intro to White Christmas while marooned in a sunny California.
The sun is shining, the grass is green;
the orange and palm trees sway.
There’s never been such a day
in Beverly Hills, LA.
But it’s December 24th ,
and I long to be up north!
Though we think of snow at Christmas in London it is very rare. And has often been rare been since Victorian times.


You must be logged in to post a comment.