All posts by wansteadmeteo

A blog that tries to make sense of how the UK's national climate translates into local weather for Wanstead and the surrounding regions of east London and west Essex. Check out my twitter feed @wanstead_meteo for local weather forecasts, stats, records and phenomena for the east London areas of Wanstead, Aldersbrook, Leytonstone and Stratford. And anything else weather

August 2024 in Wanstead

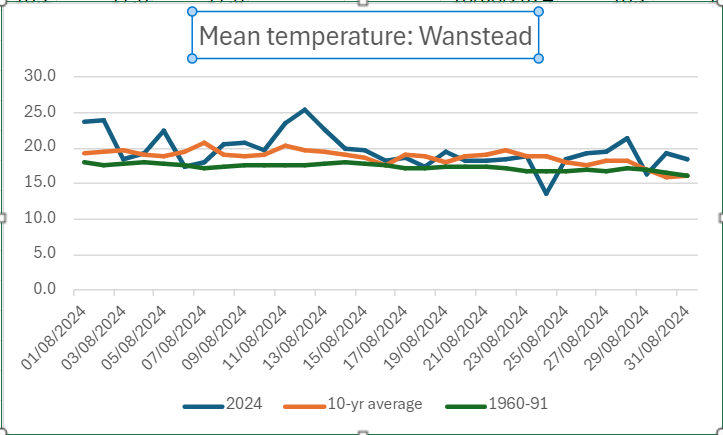
The mean for August in east London was 19.7C, 1.5C above the 1981-2010 average. It was the 11th warmest back to 1797.

Rainfall of 17.8mm was 35 per cent of average, the driest August for 8 years. It was the 22nd driest back to 1797.

Sunshine at 177 hours was 91 per cent of average. It was the 68th dullest back to 1881.

Thunder was heard once on the evening of the 1st but the core of the storm was south of the Thames with over 50mm at Godstone and New Addington.

A look at the mean temperature shows how much the climate has warmed since the period 1961-90. Though the mean last month was only 0.9C up on the previous 10 years it was actually 2.3C warmer than 1961-90.

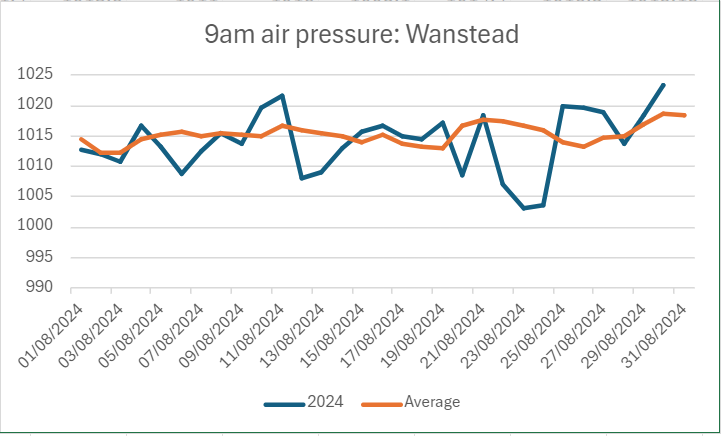
9am air pressure was largely below average with a pronounced dip on 24th bringing notably inclement weather for the time of year.

Here’s a few extremes for the month of September across the capital.

July 2024 in Wanstead

The mean for July in east London was 18.4C, 0.1C below the 1981-2010 average and the coolest for 12 years.

Rainfall of 67.1mm was 154% of average, 3mm less than last July. Sunshine at 177.3 hours was 92% of average. Duller than average but not as dull as last July.

A largely uneventful month with an absence of thunder and lightning.

As thought months ago with ENSO moving toward neutral August should be the month with the best chance of any heat records being broken.

A look at the mean temperature shows how much the climate has warmed since the period 1961-90. Though the mean last month was 1.3C down on the previous 10 years it was actually 0.7C warmer than 1961-90.

9am air pressure was largely below average until the final third of the month, coinciding with the arrival of more summer-like weather.

Here’s a few extremes for the month of August across the capital.

London’s hottest heatwaves under the microscope

It is no surprise that London’s heatwaves are getting hotter but by what rate are they increasing?

Using a list of hot spells made nine years ago I set out to find how the 30-year trends have moved through the decades since 1852.

The mean of these hot spells has increased from 24.2C in 1851-1880 to 24.9 in 1991-2020, an increase of 0.7C.

Maxima during these spells, on the other hand, has decreased from 32.6C to 31.8C. It should be noted that the spell that produced this area’s hottest ever daily maximum, 40.1C on July 19th 2022, was a 2-day affair that didn’t qualify for the list.

It is the minima that produces the most notable results with average low temperatures increasing over 2C from 15.9C to 18C! The urban heat island in full effect although the estate where a large proportion of these stats are gathered has changed little since it was built in the early 1900s.

Rainfall during these hottest heatwaves is cyclical, in keeping with daily rainfall patterns observed over the same period.

Average sunshine in these heatwaves has shown a slight decline. It is no coincidence that maxima was at its highest during 1911-1950 when there was most sun. Increased cloud cover overall would take the edge off maxima while making the nights warmer.

Wanstead maxima: 1990 v 2024

The average maxima in Wanstead so far this summer is 22C, some 0.8C higher than in 1990 – the year an August heatwave saw the UK’s max record broken with 37C in Cheltenham. Media at the time said: “I wonder if the UK will ever see 100F?

The temperature in Wanstead on August 3rd reached 35.8C, my station notes for the day say: ‘dry, sunny and very, very hot’.

Will we see a similar heatwave next month? The weather models tonight suggest not, a flat westerly flow keeping any extreme heat in Iberia.

However, in keeping with summers that occur after an El Nino event, the core of any heat usually happens in late summer – August into September.

El Niño’s effect on local climate

With the El Niño–Southern Oscillation (ENSO) trending toward neutral I thought it would be interesting to see how east London’s climate has been affected over the past year.

Using the 12-month rolling mean for this station the difference is an increase of 0.24C. The increase in rainfall, using the 12-month rolling average, is more stark with an increase of 100.9mm.

I had a look at all other El Nino events back to the early 1960s. Some 5 of 7 events saw an increase in the rolling average mean.

The 12-month rolling average rainfall similarly saw an increase in 5 of the 7 events.

The most notable event was May 1997 to May 1998 which saw the temperature increase by 1.67C and a massive increase in rainfall of nearly 300mm.

June 2024 in Wanstead

The mean for June in east London was 16.2C, 0.2C warmer than average though the coolest 6th month for 11 years. So yet another warm month – it is now 18 months since we saw a below average one.

Rainfall was on the low side, just 15mm was 29% of average, the driest June for 6 years and 20th driest locally since 1797. Today also moves us into meteorological drought territory – 15 days since there was last measurable rain (>0.2mm)

Sunshine at 204.6hrs was 115% of average, the dullest for 3 years.

The most notable day was probably the 15th with thunder and lightning and a heavy shower at 1230-1300. Further moderate showers in the afternoon.

So, far from being the ‘crap summer’ some are portraying it summer 2024 so far is pretty average here.

More of the same for July. Perhaps a couple of hot days but any prolonged heat staying to our south?

As thought months ago with ENSO moving toward neutral August should be the month with the best chance of any heat records being broken?

Here’s a few extremes for the month of July across the capital.

Ode to the Derry

Pinewoods thin and it’s curtain up
On the stage of the Glen Derry. 
I stop and stare and raise the cup. 
Of tea mixed with some blackberry. 
The grand old Lodge sits to the left. 
And over there; Luibeg bereft. 

Of human settlers, long since passed. 
These actors of spirit and endeavour. 
Bob Scott and co, a solid cast.
Lost in time and gone forever. 
Sublime silence there is no lack. 
But in’t background the Lui soundtrack. 

Exit stage right there is a bridge. 
That leads through trees and up the glen. 
An escape from the summer midge. 
A path to the Macdui Ben. 
But it is here that one must stay.  
And watch this scene unfold today. 

A ray of sun spotlights Luibeg.
Prompting the ghosts o’ the Derry. 
A perfect script with nothing said. 
No need for lines, no words nary. 
Exit stage left, encore begins.  
It’s back to the Linn of Dee. Fins  

Looking across to Luibeg
Bob Scott o’the Derry. This photo hangs in the Bob Scott’s Bothy

Turfed out

Grass roots left for councils to grab,
into darkness is nature plunged.
By acres of green plastic drab, 
of reason, we are now expunged.
But this is what the people want, 
of climate we are nonchalant.

Warnings are for other people,
yet last year floods claimed your garage.
Memories lost, in discharge faecal,
not long before the next barrage.
Clues are in that relentless march 
of CET upwards, landscapes parch.

On we go, no time for nature,
let us now pave over that drive.
Flat Earthers all, blind to danger 
of the abyss, we’re doomed to dive.
Fear not we’ll scrub the atmosphere.
Of carbon dioxide from air near.

Fly away we must on breaks grand,
Worry about climate later.
Holiday firms need that demand, 
from the poles to the equator.
But it’s home, our backyards we need
to restore nature, not concede.

UK rainfall: Seathwaite / Honister v London

It’s been a wet winter so far. Some 177mm has fallen in Wanstead – already 122 per cent more what falls in an average winter.

But the amount pales into comparison with the Lake District. Since December 1st 1360mm has fallen at Honister, a station close to Seathwaite which proudly proclaims itself as ‘England’s wettest place’.

Over a calendar year the area usually sees 5.6 times the amount of rainfall of London. However, this winter the total of 1360mm makes it 7.7 times wetter! A testament to just how persistent the SW’ly airstreams have been this season. And a reminder that the Lake District is the called the Lake District for a reason.

Data from the excellent Starlings Roost Weather.

Wanstead weather in December

Continuing on from last month this blog focuses on the weather recorded at this station over the last 11 years.

A look at the twelfth month shows some interesting trends…

The 9am air pressure readings were not included in previous climate summaries owing to analogue barometers only giving approximate air pressure readings. The advent of AWS has changed that, particularly for independent amateur observers.

A look at the below graphic shows pressure falling through the first half of the month. A sharp rise is then seen before falling again – there’s often storms around the 23rd until the 27th.

Average daily windrun is how much wind there’s been during a 24 hour period. The 23rd comes out as windiest.

Average rainfall shows precipitation building through the month, to peak on the 23rd before a sharp drop off after the 27th.

Average daily maximum temperatures during December show a stuttering first 10 days before a steady rise through the next fortnight before a steady fall off from the 23rd .

Average daily minima is up and down in the first 10 days before a steady rise from the 11th. Again there’s that falling off a cliff on the 23rd.
This pivotal date, being so close to Christmas Day, is one of the reasons why ‘will it, won’t it be a white Christmas’ is a perennial fascination among the nation.

Advertisements