A blog that tries to make sense of how the UK's national climate translates into local weather for Wanstead and the surrounding regions of east London and west Essex.
Check out my twitter feed @wanstead_meteo for local weather forecasts, stats, records and phenomena for the east London areas of Wanstead, Aldersbrook, Leytonstone and Stratford. And anything else weather
There’s been some very interesting output on the weather models these past couple of days – not least the GFS’s dew points from Christmas Day into Boxing Day.
Very cold air from the east can be seen moving toward the SE of the UK to just across the North Sea – one run has the dew point down to -20C!
The outcome will be different but it’s been a fair while since I’ve seen this sort of solution in what is a relatively short timeframe.
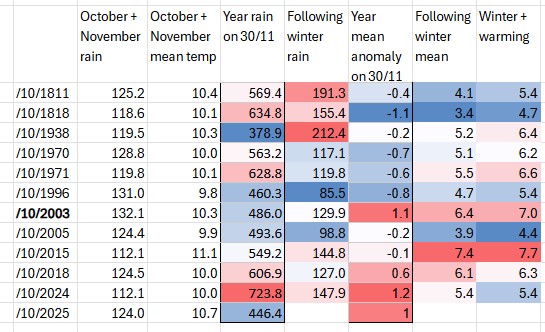
This winter is looking mild or very mild overall with slightly above average rainfall.
This year I’ve added to my previous method of forecasting by also considering the 12-month rolling rainfall statistics on November 30th together with the January-November mean anomalies.
This gave the following list.
Thus, in terms of chances:
Above average
>6.2
46%
Average mean (C)
5.2-6.2
36%
Below average
<5.2
18%
And for rainfall:
>125%
195
18%
Average (mm)
156.1
64%
<75%
117
18%
The ‘line of best fit’ appears to be the winter of 2003/04 which, after a cold snap in late December that delivered a maximum snow depth of 7cm on December 29th, it turned out to be yet another mild winter.
Back in the days of proper winters folk had it hard, especially those living in the Cairngorms. And probably none more so than Bob Scott who experienced more than his fair share of severe weather.
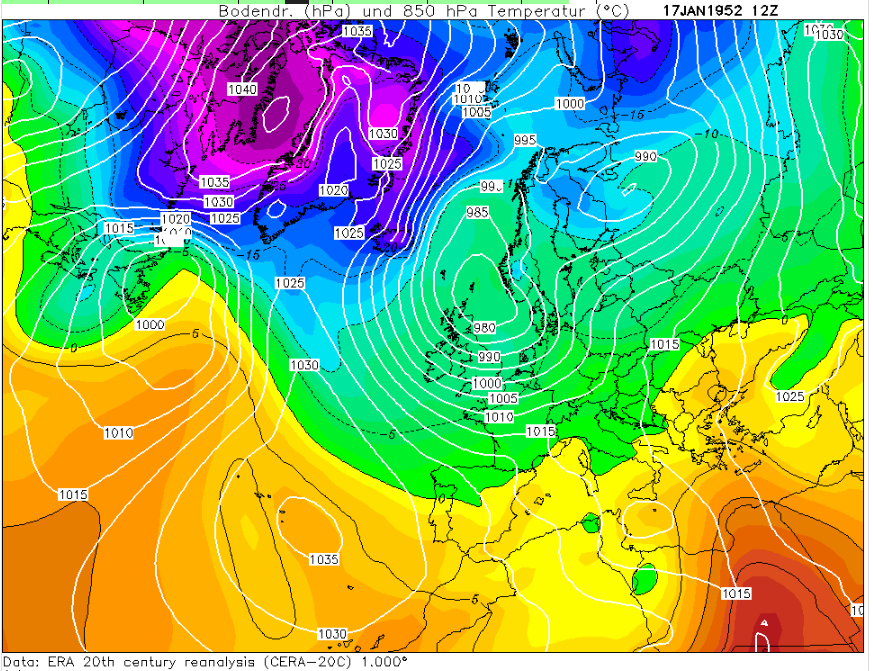
Reading Adam Watson’s fascinating memoir of his time with the legendary Bob Scott o’ the Derry I picked up this fascinating account of the time he had to hand over navigation to his horse, Punchie, to guide them home through a blizzard in January 1952.
Watson writes on his conversation with Scott: “…it was the worst storm I’ve ivver been oot in, on my wey hame fae the Linn in the aifterneen. The drift came on sae thick I couldna see the horse’s heid as I sat on the sledge. I couldna have got hame if it hadna been the horse”.
A gale battered his face with suffocating drift. He judged that he must be near the Derry wood, but the storm now became violent. He had to turn his head away and let Punchie take over. Suddenly the gale dropped and the drifting stopped as a dark wall loomed yards away, the lodge wood! Snow still fell thickly, but he had shelter and knew where he was. Punchie had come right to the narrow gap where the road entered the wood.
Watson’s book It’s a Fine Day For The Hill is a beautiful memoir packed with anecdotes of his life in and around the Highlands.
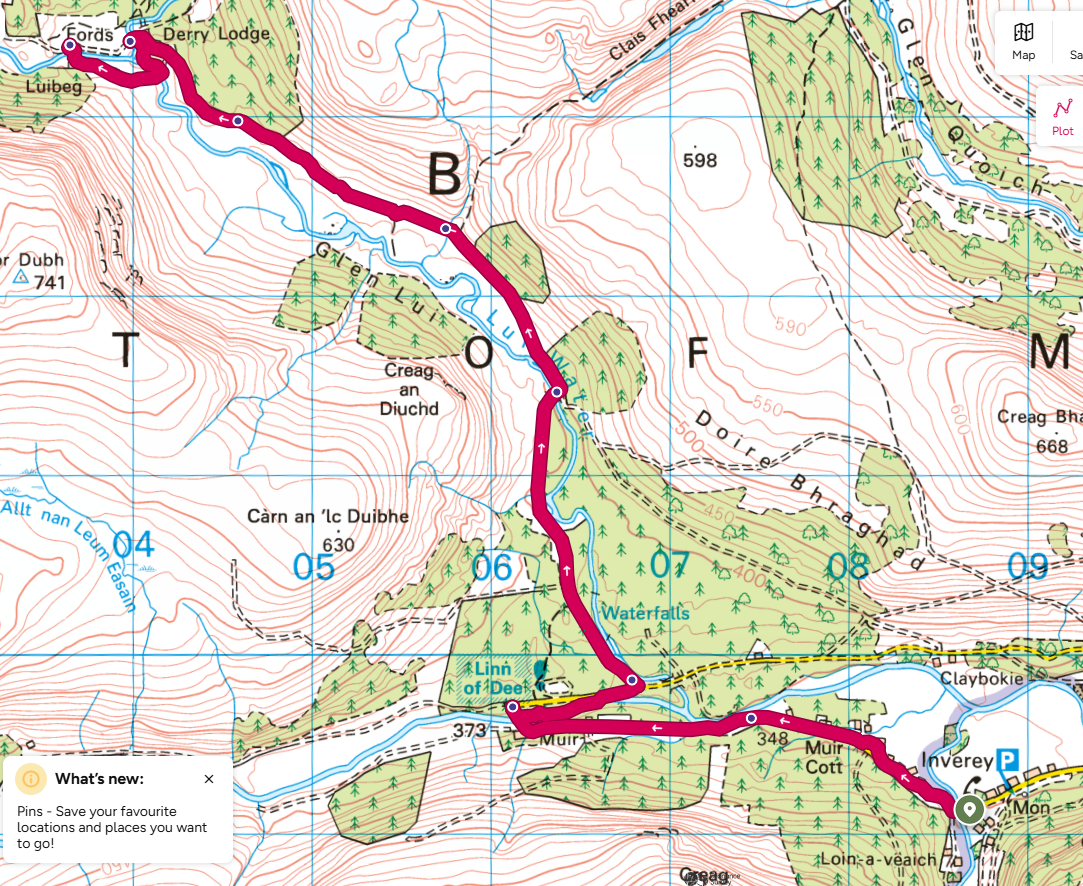
The route from Inverey to Luibeg, the ‘most beautiful part of the Cairngorms’
Gliding along on billiard table-smooth paths in the dunes of the Hollandse Duinen National Park: there can’t be many better cycling experiences in the world.
Hours earlier we’d disembarked the Stena Britannica at Hoek van Holland with only a vague timetable of getting to Amsterdam and back in time for our return ferry four days later.
We decided to head for a town called Monster that was far enough to get our cycling legs going but also close enough for that all-important first caffeine shot of the day. Rolling into the town I was struck by the number of old people on two wheels, something you don’t see that much of aound east London.
A day after cycling the potholed roads from Dedham Vale to Harwich the Dutch paths were a revelation. After mile upon mile of stunning beaches we soon arrived in The Hague bathed in warm October sunshine – the old town the perfect place to stop for lunch.
Conscious of time and that my daughter had never cycled further than three miles I figured we ought to get some accomodation booked for that evening; Stayokay Noordwijck was a good 30km further north.
The dunes of the Hollandse Duinen National Park with the contrails of Schiphol
We pedalled on, taking in the International Criminal Court, before the paths of the Dutch capital slowly emerged into the dunes of the Hollandse Duinen National Park. It was probably the nicest afternoon’s cycling I’ve ever had the joy of experiencing.
Following days provided further interest with stops in Zandvoort, Haarlem, Amsterdam and Gouda before returning through Rotterdam on our way to Hoek for the return overnight ferry.
Since my return I’ve wondered why Dutch cycling infrastructure is so much better than the UK. I thought it was bound to be paid by higher taxes in the Netherlands but, using a median income of £100k, the overall income tax rate set by The Hague would be 32% compared with Westminster’s 30%.
Yet, according to findings on the web, the amount spent on cycling infrastructure in England is just 56% what the Dutch spend, despite the area of England being three times bigger than the Netherlands.
The per capita spending on cycling, therefore, is £28.77 in the Nethlands compared with £5.10 in England. The Dutch argue that such high spending on cycling has societal benefits, including factors like public health, travel time, and reduced pollution.
I realise the above is a back of the envelope take on the economic situation of both countries but there is a good study on this published here.
Background
Every four years or so I look to do something on two wheels as a bit of challenge. The idea was first sparked in 2012 on my first work sabbatical – I’d listened with envy to a colleague’s account of cycling the C2C, a coast to coast route across England from Whitehaven to Sunderland.
The seed was sown and that autumn I completed my own C2C, raising nearly £4k for Sarcoma UK in honour of my late sister, Jane.
Four years later I completed the Dunwich Dynamo, a 120 mile ride from London Fields to the Suffolk coast.
And in 2021, just as the pandemic lockdown loosened I undertook my own version of the Scottish coast-to-coast, cycling from Aberdeen to Mallaig.
Hoek van Holland – Monster – Den Haag – Noordwijck – Haarlem – Amsterdam – Gouda – Rotterdam – Hoek
The weather was glorious all week until the last day as Storm Amy bore down
The mean for summer 2025 in Wanstead finished 19.8C, 1.8C above the 1991-2020 average and the second warmest summer in a local record going back to 1797. The figure was just 0.2C short of the warmest summer in 2022.
It was a dry season; just 84.5mm of rain was recorded, the driest for three years and 21st driest to 1797.
Taking a broader view of Greater London, using Met Office statistics for St James’s Park and Heathrow, reveals that summer, as an average of the three, finished second warmest, just 0.174 behind 2022.
In terms of rainfall it finishest 22nd driest with an average of 92.2mm.
Some 590.5 hours of sunshine were measured at Heathrow, 105% of average and the sunniest for 3 years.
The very dry spring had already taken its toll on the Ornamental Waters, Wanstead Park
Sunshine of late seems to have been endless with the past 10 days being virtually cloudless from dawn to dusk.
After a very sunny March which saw over 170% of average sunshine recorded at Heathrow April has already seen over 56% of average sun hours in the first eight days.
In terms of the total percentage possible of sun hours the past 11 days are second only to a period in 1990 that stretched from April 27th until May 7th.
The pattern has seen an anticyclone near stationary to our north, generating a dry NE’ly feed. Some 12.2 hours of sunshine were recorded at Heathrow on the 6th.
In March I attended an avalanche course to try to better understand the dynamics of what causes masses of snow to suddenly roll down a mountain.
The Swiss Mountain Training level 2 syllabus didn’t disappoint and over the course of three days I was soon digging snow pits to study the layers and what causes them to occasionally release.
Shovels in hand I, along with my fellow students, was soon digging down to a depth of over 150cm. Probes revealed a huge temperature difference; from -11C at the surface to just above freezing at the base.
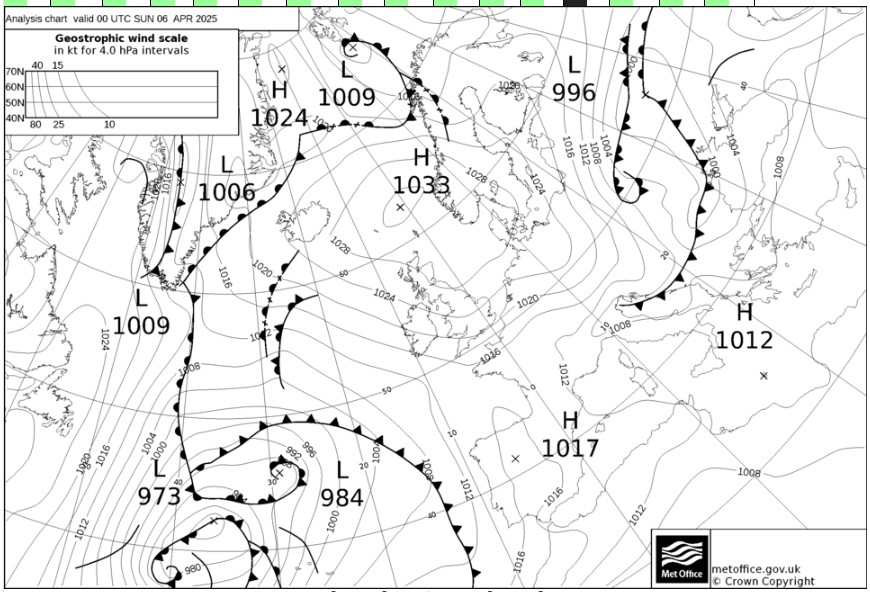
There’s been quite a few superlatives thrown at this early January cold spell, not least the recording of the coldest January night at Altnaharra in 15 years.
Snowfalls across the Highlands, Lake District and northern England have been notable in their longevity relative to recent years.
But the absence of any lying snow at 9am in this locality and fairly standard minima for January left me looking elsewhere for something notable.
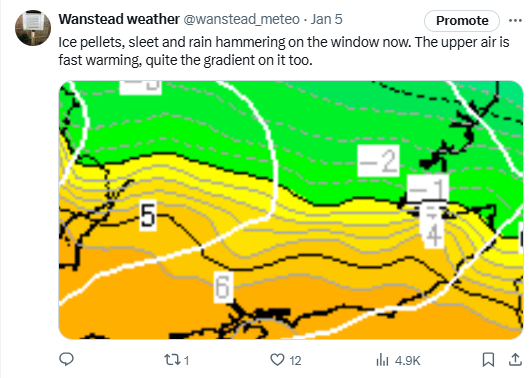
Airmass battlegrounds are a regular feature of UK winters though I can’t remember a time when this region has been right on the boundary.
The temperature on the 5th climbed from 3.2C at 0810 to 11.3C at 1050. Here it hovered until 0710 on the 6th before plunging to 3.2C again by 0910 – a period of just 2 hours.
There was some transient snowfall on the evening of the 4th but it lasted a matter of hours with the incoming warm air after midnight..


You must be logged in to post a comment.