Dreaming of a white Christmas?

I’m not. And it is not because a glimpse at the latest GFS operational run at T+324z (on the 12th) reveals that many could be sitting down to their festive lunch in mild Atlantic air, with possible frontal rain bringing a miserable afternoon with heavy rain in the evening.

Cold spells in early to mid December often end around the 20th, a momentary change to a more mobile regime. Even the cold winter of 1962/63 saw this mid-December warm up with the snow not arriving until Boxing Day.

I will be keeping a daily eye on the GFS and adding to this blog to watch the daily twists and turns, adding to this blog from here.

Just over 24hrs away now on Sunday 24th and the weather tomorrow is again looking mild,in London, about 11C and breezy at lunchtime with rain spreading in very late evening. Best chance of any flakes over the high ground of Scotland.

Screen Shot 2017-12-24 at 08.00.37

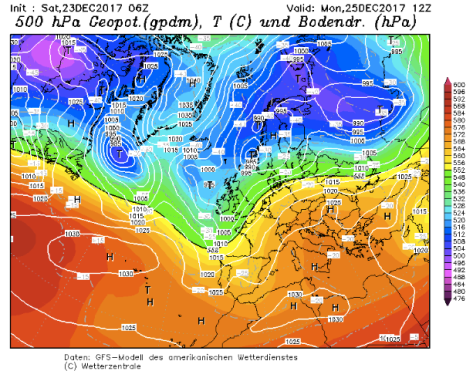
On Saturday 23rd, just 54hrs away now, and the GFS op run is again showing the same change to cooler air albeit slightly delayed to previous runs. Temps in London about 10C / 11C, breezy – any rain not arriving to well into the evening. Best chance of any UK snow is Glasgow, into the evening as the cold front clears – and obviously flakes on high ground in the north.

Screen Shot 2017-12-23 at 09.53.24

On Friday 22nd, less than 90hrs away, the GFS is again showing the UK on the cusp of a change. Conditions in London look very mild 11C – 13C before dropping back to 5C after a spell of rain in the evening. Best chance of any snow over the highest points of Scotland.

Screen Shot 2017-12-22 at 08.42.07

Down to 108hrs to lunchtime on the 25th and the situation still shows the weather regime on the cusp of change with the anticyclone over France pulling away south. High temps in London about 9C or 10C with rain late in the evening. Snow risk across the Highlands as colder air digs in. Screen Shot 2017-12-21 at 08.35.34

On Wedesday 20th, the synoptic situation on 25th looks on the cusp of a big change to something more unsettled as the high pulls well south of its current position. A heavy band of rain is approaching from the west though it would be well into the evening before it affects London. Best chance of any snowfall if you fancy a flutter is Glasgow.

Screen Shot 2017-12-20 at 09.23.28

On Tuesday 19th, Christmas lunchtime appears to be the transition day from the present high pressure dominated weather to something cyclonic. In London a dry, cool and cloudy start will be quickly replaced by a spell of rain that clears eastwards. Max 11C, min 3C as the front clears. Best chance of snow looks west coast of Scotland and Pennines.Screen Shot 2017-12-19 at 08.28.58

A week from today and Christmas day will have already dawned. The GFS 00z op presents an unsettled outlook with a transition from mild to cold; London looks warmest at 9am before a cold front sweeps SE’wards. Best chance of anything wintry falling: west coast of Scotlands and Pennines. Over the last couple of years the pattern has already been locked in to mild but this year’s constant ups and downs suggests the weather type  it is all still to play for. Screen Shot 2017-12-18 at 08.13.28

On Sunday 17th, the weather is looking less settled than yesterday with a weak high pressure much further south over the Pyrenees. A cool NW’ly regime with upper air around -5C, allowing any precipitation to be wintry. A chance of snow west coast of Scotland, Pennines and north-west Wales.

Screen Shot 2017-12-17 at 12.17.56

On Saturday 16th, weather on the 25th is under the influence of high pressure centred over Brittany. Quiet weather with a high of 6C or 7C after an overnight frost. There appears little chance of anything wintry falling as the source of the upper air is all the way from the Azores.

Screen Shot 2017-12-16 at 09.46.47

On Friday 15th, Christmas day lunchtime again looks like a day in between a relatively settled mild pattern and a cold, unsettled regime with potential for slider lows after Boxing Day. The 25th itself again looks chilly and nondescript. A high of 6C or 7C, light winds and potential for some rain later. Things are in a state of flux so I’d expect detail to change again tomorrow.

Screen Shot 2017-12-15 at 10.33.12

On Thursday 14th, midday on 25th is looking fairly non-descript. High pressure sits over the near continent with a declining ridge up to Scotland; the UK sits in a battleground with cold air over the near continent and mild air trying to push in from the Atlantic – most of the UK is just on the chilly side. The best chance of any snow is the east coast of Scotland. Still all to play for but it was this date over the past couple of years that the models started to get a good handle on Christmas day proceedings.Screen Shot 2017-12-14 at 14.35.19

Screen Shot 2017-12-13 at 09.52.12On Wednesday 13th I notice that the Daily Star reckon we are ‘odds on’ for a white Christmas, yet I can’t find a bookie anywhere to ‘lay’ these odds; at 12 days out there’s no way any model could be ‘odds on’.

This morning’s (12th) 00Z operational run of the GFS has London at 10C with a chance of rain. Best chance of any white stuff probably Aberdeen.

Screen Shot 2017-12-13 at 09.57.05

Screen Shot 2017-12-12 at 08.28.01

December 10th 2017: rain turned to snow

Today’s snow came thanks to an area of low pressure that tracked further south than forecast.

Screen Shot 2017-12-10 at 17.38.33
Wanstead Park

‘Xanthos’ brought several hours of precipitation, 21.3mm in all to 3pm. Associated precipitation started as rain in Wanstead at 4am, turning to snow at 8am and quickly settling on all surfaces. By the observation time at 9am about 1cm had accumulated as the snow turned heavier.

Snow continued to fall through the day though, because soil temperatures are still relatively warm, the snow thawed from below and accumulations locally were restricted to around 5cms.

There is still a full, slushy cover on lawns at nightfall.

met office fax 06z10122017

low xanthos

pressure 10122017
Pressure fell to its lowest point 970.3mb at 1159z
ground temps
Had 0-10cm ground temps not been so warm today’s snow would have been a lot less slushy here

A repeat of December 1990 this weekend?

The outlook for possible snow over the weekend reminds me of a similar synoptic set-up in December 1990 that left large parts of the Midlands northwards covered in deep snow, but that delivered only cold rain to the London area.

The situation in 1990 is explained on the excellent Booty Weather site.

“A low formed dramatically over central England on the 7th, large quantities of rain, turning in many places to snow, fell on its western and northern flanks. On the 7th and 8th very heavy snow fell over northern England, Wales, the Midlands and south west England, with heavy drifting in gale force winds, causing considerable disruption to traffic and cutting power lines.

coventry
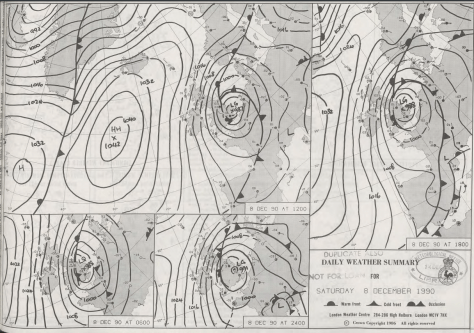
“The snow did not freeze, however, but melted very rapidly during the next few days, as the temperature rose a little. By late on the 8th, many parts of the Midlands had 20cm or more of lying snow. Acocks Green, Birmingham, reported 42.5cm on the 8th. The Peak District had 38cm at Middleton and 25cm at Winksworth. Newcastle under Lyme reported 28cm, and many other places had more than 20cm. Drifts up to 60cm on motorways in the Derby area, and at Carlton in Coverdale, near Leyburn, a report of 240cm. Snowfall on the 9th in the Dorchester area in 1990 was the heaviest pre-Christmas fall in that area since 9 December 9th, 1967.”

My stats in London suggest that the system was a bit of a non-event here. Another account of December 1990 is covered here.

rain


met office
Met Office synoptic charts, general situation and surface obs for December 8th 1990

story

Constable’s fair view of Waterloo Bridge

A sketch of Waterloo Bridge by John Constable sold for £2.3m as auction this week.

The canvas, confirmed as the first prototype for “The Opening of Waterloo Bridge”, the celebrated work by one of Britain’s greatest landscape artists that hangs in Tate Britain. was discovered hanging in the hallway of a private home.

It is an excellent example of how Constable managed to harness the realistic detail of skies of the period, a detail that was overlooked by artists before him.

1817Sketched shortly after his 41st birthday on June 18th 1817, the scene depicts a pleasant summer afternoon, echoing that day’s meteorological observations in Luke Howard’s Climate of London: a high of 26C with light SE’ly winds, the start of a fine spell of weather.

It is thought that Constable, who in 1817 moved from his native Suffolk to London, had been greatly influenced by Howard’s work on naming the clouds a decade or so earlier. It was the same year that Howard gave his Seven Lectures In Meteorology, the subject matter of which was later published as the first meteorological textbook in 1837.

The sketch, which shows ceremonial barges leaving the shore at Whitehall to celebrate the opening of the new bridge, with St Paul’s Cathedral and the spires of Wren’s City churches visible beyond, fetched £2,289,000, far the figure it was expected to receive, between £1m and £1.5m, at Sotheby’s, on Wednesday.

waterloo
“The Opening of Waterloo Bridge seen from Whitehall Stairs, June 18 1817,” oil on canvas, by the English artist John Constable. 51.5″ X 85.83″. Courtesy of the Tate Britain, London.}} |Source=http://www.the-athenaeum.org/


November 2017: below average, dry

November 2017 was another dry month. Just over 33mm of rain was recorded, the driest November since 2011 and the 40th driest since 1797.Screen Shot 2017-12-02 at 17.23.28

The monthly mean finished 7.1C, 1C below average and only the fourth cooler than average month this year.

Some 71 hours of sunshine were recorded, 122 per cent of average – the sunniest November since 2007.

Air frosts: 6, Ground frosts: 17, snow falling: 1 (just a few flakes on the 30th, the first November snow in years.)

The start of December looks like it start mainly dry, an anticyclone over the Atlantic that has brought respite from last week’s cold weather will pull away into the continent to be replaced by low pressure. This depression will track across northern England gradually pulling cold, Polar air across the UK on Thursday.

The models go against what has followed dry Novembers in the past – patterns overwhelmingly suggest that December will be average to rather mild and on the dry side. Winter is looking average overall.

Here follows the full weather diary for November…Full stats for the month here:http://1drv.ms/1rSfT7Y

Summary for November 2017
Temperature (°C):
Mean (1 minute)  7.4
Mean (min+max)   7.1
Mean Minimum     3.5
Mean Maximum     10.6
Minimum          -2.7 day 24
Maximum          15.5 day 22
Highest Minimum  12.3 day 21
Lowest Maximum   3.7 day 30
Air frosts       6
Rainfall (mm):
Total for month  33.3
Wettest day      8.5 day 10
High rain rate   12.1 day 22
Rain days        14
Dry days         16
Wind (mph):
Highest Gust     22.1 day 23
Average Speed    2.7
Wind Run         1952.8 miles
Gale days        0
Pressure (mb):
Maximum          1029.6 day 17
Minimum          985.2 day 22
Days with snow falling         1
Days with snow lying at 0900   0
Total hours of sunshine        71.2
Screen Shot 2017-12-02 at 17.24.28

London’s December extremes since 1959

I’ve put together a few top 10s of stats for Wanstead, St James’s Park and Heathrow for the month of December.

Probably most notable is how the month in 1978 lurched from being very mild and wet to very cold in under three weeks later, setting up one of the coldest-ever winters.

Screen Shot 2017-12-02 at 12.41.15

dec recs

December Heathrow

Some national UK December values according to TORRO

Hottest: 18.3C Achnashellach – 2nd 1948
Coldest: -27.2C Altnaharra, Highland – 30th 1995
Wettest: 199.1mm Dalness, Highland – 17th 1966

Climatology

Here’s a couple of graphs showing the maxima and rainfall. Notice the spike just before Christmas day which reflects the singularity which has an 84 per cent probability.

december maxima.PNG

December minima.PNG

december rainfall.PNG

London winter forecast 2017/18

I’ve been doing these written winter forecasts for five years now but this year I’ve never seen such a spread of probabilities as to how winter may pan out. So, if by the end of reading this you are none the wiser, you’re not alone!

The mean temperature for winter 2017/18 is looking average overall with average precipitation. While that doesn’t sound exciting for anyone looking for colder weather and snow I think the figures mask frequent 3 or 4 day-long cold snaps from the Arctic interspersed with milder interludes from Atlantic incursions; typical characteristics of a pattern driven by the troposphere. For anything longer term we have to hope for a warming of the stratosphere, a sudden stratospheric warming over the Arctic, that downwells into the troposphere, reversing the general westerly circulation. We are overdue an ‘SSW’ event but, even if one were to happen, its effects wouldn’t be felt until much later in the winter.

The current cold snap follows the recent disruption of the polar vortex. The ‘displaced polar vortex’ regime seems to be becoming more common as the Arctic gets warmer and maintains more open water during winter. This leads to anomalous ridging over the Arctic, which results in a displaced or bifurcated vortex, which leads to somewhere in midlatitude getting persistent anomalous cold. There was very cold air around last year but the UK missed out; the heart of the cold plunging down far to our east with snow falling on beaches in Crete!

This week’s cold snap looks like it will be short lived though the ‘displaced vortex’ could be an early sign of yet another pattern transition in the troposphere. Looking at the latest model output it is uncertain how long the next polar vortex perturbation will be.

So, whether we see any cold, snow-worthy, air this winter is a lottery – though I think our chances are a lot better than they have been for the past 5 years.

Because October and November have been so dry I’ve had very little to work with in terms of stats to try to find if the current pattern is similar to previous autumns. Instead I’ve looked in depth at ENSO, QBO and local meteorological data.

ENSO

The El Niño–Southern Oscillation (ENSO) is a periodic variation in winds and sea surface temperatures over the tropical eastern Pacific Ocean. It is forecast to be mildly negative (La Nina) over the coming winter. Many doubt whether it has an impact on our winter but there seems to be a connection with strong La Ninas and very mild winters. Because it is forecast to only be mildly negative it’s impact may be very small. I had a look at similar years were ENSO was -0.4 in September and came up with the following.

Screen Shot 2017-12-01 at 13.55.24

QBO

I also had a look the quasi-biennial oscillation (QBO), the quasiperiodic oscillation of the equatorial zonal wind between easterlies and westerlies in the tropical stratosphere. This produced the following table of probabilities.

Screen Shot 2017-12-01 at 13.59.48

Singularities / patterns

My traditional method of looking back for similar patterns of weather in the autumn produced this table.

Screen Shot 2017-12-01 at 14.02.38


 So, considering all three tables together, would suggest, probably bizarrely given the cold start to this month, a rather mild December followed by an average January and February.
Screen Shot 2017-12-01 at 14.08.18

London’s November extremes since 1959

I’ve put together a few top 10s of stats for Wanstead, St James’s Park and Heathrow for the month of November.

Probably most notable is how the month in 2010 lurched from being so warm at the start to so cold three weeks later, setting up December to be one of the coldest on record.

wanstead

November SJP

heathrow

Some national UK November values according to TORRO

Hottest: 21.7C Prestatyn, Clwyd – 4th 1946
Coldest: -23.3C Braemar, Grampian – 14th 1919
Wettest: 211.1mm Lluest Wen Reservoir, Rhondda – 11th 1929

November climatology

In terms of climatology November maxima, considering the 1981-2010 average, shows a steady fall until the 15th. And another steady fall to the 22nd before things level off. This would reflect the November singularities; St Martin’s Summer, between 15th and 21st, peaking on the 18th, occurs in 66 per cent of years. The Early December storms singularity can arrive this month, on the 24th, the air off the Atlantic raising the mean temperature.

november average maxima

The average rainfall graphic shows that downpour amounts are variable through the month. A tendency for dry weather around the 15th reflects the St Martin’s Summer singularity.

november rain

This graphic shows the average 9am air pressure in November since 2013.

pressure


October 2017: warm, very dry and dull

October 2017 was a very dry month. Just 12.6mm of rain were recorded, the driest October since 1995 and the 11th driest since 1797.

The monthly mean finished 13.1C, 1.3C above average and the seventh warmer than average month this year.

Some 81 hours of sunshine were recorded, 76 per cent of average – the 4th duller than average month in a row. Just three months have been sunnier than normal in 2017!

Air frosts: 0, Ground frosts: 2

The first half of November looks like it will be predominantly anticyclonic. Expect lots of calm weather with the usual frost and fog.

Here follows the full weather diary for October…Full stats for the month here:http://1drv.ms/1rSfT7Y

Summary for October 2017
Temperature (°C):
Mean (1 minute)  13.2
Mean (min+max)   13.1
Mean Minimum     9.7
Mean Maximum     16.6
Minimum          0.9 day 29
Maximum          22.2 day 16
Highest Minimum  15.8 day 13
Lowest Maximum   11.3 day 30
Air frosts       0
Rainfall (mm):
Total for month  12.6
Wettest day      2.8 day 18
High rain rate   12.1 day 11
Rain days        8
Dry days         23
Wind (mph):
Highest Gust     23.5 day 02
Average Speed    3.4
Wind Run         2495.1 miles
Gale days        0
Pressure (mb):
Maximum          1034.0 day 27
Minimum          996.3 day 19
Days with snow falling         0
Days with snow lying at 0900   0
Total hours of sunshine        0.0


Centuries of London fogs

November normally marks the return of those autumn staples frost and fog and this December marks the 65th anniversary of the Great Smog.

Looking back through the archives the worst fogs tend to appear throughout these two months, set off by recurring weather patterns. The usual scenario, an anticyclone centred over Switzerland and Austria, leaves our part of the UK in a light SE’ly feed off the continent. Warm air aloft traps already poor quality air at ground level, the temperature inversion gradually leading to increasing levels of pollution.

During the Georgian Regency period fog occurs numerous times in Luke Howard’s Climate of London.

November 27th 1816 : “The atmosphere was so darkened yesterday morning in the vicinity of the metropolis by the thick fog combined with smoke that in some parts it appeared like a cloudy night. In the neighbourhood of Walworth and Camberwell it was so completely dark that some of the coachmen driving stages were obliged to get down and lead their horses with a lantern.” (Evening Mail)

December 31st 1817: “The fog of Wednesday (31st) seems to have been confined to the metropolis and the immediate vicinity. No further to the northward than the back of Euston Square the weather was clear and even bright. A gentleman who came to town from Enfield saw no fog till he approached London. Southward of London it extended as far as Clapham and it was rather thicker in some of the environs than in the metropolis itself. Upon an average 10ft was the distance at which objects became invisible out of doors. Within doors it was impossible to read without a candle.”

November 3rd 1820: “A very thick fog in the morning.”
And on the 18th: “An extremely thick fog which remained most of the morning. About 10am the coachmen on the road were unable to see the heads of their horses which in many instances were obliged to be led.”

In 1828 several days in November were noted for their fogginess, including 11th, 17th and 19th. The 12th had “extreme dense fog all day.”

“The fog of Wednesday (12th) has seldom been exceeded in opacity in the metropolis and its neighbourhood. It began to thicken very much about half past twelve o’clock from which time till near two the effect was most distressing making the eyes smart and almost suffocating those who were in the street, particularly asthmatic persons.

“In the city all the bankers and offices of different descriptions as well as the principal shops were obliged to have lights. To see with any distinctness further than across the street was impossible. All the narrow lanes beyond the perspective of a few yards were absolutely in a state of darkness and in the great thoroughfares the hallooing of coachmen and drivers to avoid each other seemingly issuing from the opaque mass in which they were enveloped was calculated to awaken all the caution of riders as well as of pedestrians who had to cross the streets.

“On the Thames as on land the tendency which fog has to enlarge distant objects was strikingly illustrated. The smallest vessels on their approach seemed magnified to thrice their usual dimensions. St Paul’s had a prodigious effect through the mist though neither that nor the Monument were visible above the height of the houses. This optical illusion is said to arise from the fog diminishing the brightness of objects and consequently suggesting a greater distance since while the visual angle remains the same the greater the distance the greater the real magnitude. It cleared off a little about a quarter past two but returned with all its density in the evening. (Public Ledger)

The following year 1829 saw a virtual repeat with wintry weather setting in at the end of the month. Fog was recorded on November 2nd, 11th and 19th. On the 20th the diary entry read: “hoar frost, foggy day and so thick at night as to prevent travelling,” before the weather turned colder on 24th: “a hoar frost, cloudy, a heavy fall of snow from 10pm through the night – 4 inches and upwards on the ground. 25th: a little more snow, thaw. 26th: thaw going on cloudy, very cold. 27th: very thick fog, drizzly.”

With coal being the primary source of heat and power for millions of Londoners the air during anticyclonic conditions would have been thick with acrid soot. The smell of coal in pea soupers, fogs caused by a mixture of soot, smoke and fog, is referred by a Mr Guppy in the letters page of The Times on December 5th 1837.

A London particular…
Not only was the darkness so great [in the morning] that the shops were all lighted up, but also every object in the streets, however near, was totally obscured from the view of the persons walking along. In Piccadilly the darkness was very great, and the confusion caused by the vehicles running against each other beyond description. About 9 o’clock the Hastings branch coach, which had just left the Old White Horse Cellar, while endeavouring to turn into St. James’s Street, ran into the shop window of Mr Hoby, the celebrated bootmaker, at the western corner, which it demolished with a fearful crash, breaking upwards of 40 squares of glass.

Fast forward 35 years, with the industrial revolution in full swing, a notable fog in December 1873 was described in The Medical Times and Gazette as “one of the most disastrous this generation has known,” going on to point out that “to persons with cardiac and respiratory disease it has in numerous instances proved fatal.” Some 273 people died as a result of bronchitis caused by the coal-smoke saturated fog which enveloped the city for days.

09121873
Reanalysis charts enable us to see how an anticyclone centred over Austria allowed ideal conditions for fog to form, the worst conditions probably being on November 9th 1873

With the population of London steadily increasing, together with ever higher demand for fossil fuels, the fogs grew steadily filthier. Throughout 1892, the letters pages of The Times were filled with complaints about the increasing number of fogs which slowed the metropolis to a crawl. Most were concerned with what could be done to either end the great scourge or to at least ameliorate the worst effects of the great seasonal nuisance.

By the autumn, the governor of the Gas Light and Coke Company was becoming tired of accusations that they were not supplying enough gas during fogs and pointed out that during a particularly foggy week in November, consumers used 60 million cubic feet of gas more than in the corresponding week a year earlier. Turning to the chief complainant, he suggested that his problem lay with his fittings “over which the company has no control” and went on to accuse him of “recklessly bring[ing] a baseless charge against this company.”

09111892
Conditions in November 1892 prompted many to write to The Times of London to complain about the ever increasing occurence of fog

And so it went on. But it would be another 60 years before the Great Smog, in December 1952 that led to at least 4,000 deaths and 100,000 being taken ill by the smog’s effects, finally brought about a wave of action that led to the Clean Air Act in 1956. The six days of the anticyclonic conditions are shown below.

30 mile fog 1952
How the Daily Express reported the ‘pea souper’ in 1952. Absolutely no need for any hype that plagues that paper’s weather stories today!

The anticyclones that caused these horrendous smogs still happen today. Since 2013 I have recorded 10 days of fog at 9am in the autumn / early winter seasons, including one in December 2013 that prompted the iconic image of Canary Wharf poking up through the gloom below.

canary
Canary Wharf fog picture: Metropolitan Police helicopter takes stunning pictures of fogbound London from the sky | Metro News

11122013

Fog on November 1st 2015 was thick enough to see the annual firework display on Wanstead Flats cancelled.

01112015

With the advent of the Clean Air Act the often annual problem of smogs became a thing of the past though, over the past few years, pollution levels have been creeping up again. Campaign groups such as Clean Air in London seem at last to have a handle on the seriousness of the situation and that these 19th century weather patterns that brought such horrendous conditions still occur today. Indeed this table, drawn up by Xmetman, shows how common high pressure still is in winter.

It would be interesting to see how pollution today, in terms of total airborne particulates, NO2 etc, compares with pollution that Londoners had to suffer throughout the 19th and 20th centuries.

Meteorology-based musings about east London and beyond