Sunshine of late seems to have been endless with the past 10 days being virtually cloudless from dawn to dusk.
After a very sunny March which saw over 170% of average sunshine recorded at Heathrow April has already seen over 56% of average sun hours in the first eight days.
In terms of the total percentage possible of sun hours the past 11 days are second only to a period in 1990 that stretched from April 27th until May 7th.
The pattern has seen an anticyclone near stationary to our north, generating a dry NE’ly feed. Some 12.2 hours of sunshine were recorded at Heathrow on the 6th.
In March I attended an avalanche course to try to better understand the dynamics of what causes masses of snow to suddenly roll down a mountain.
The Swiss Mountain Training level 2 syllabus didn’t disappoint and over the course of three days I was soon digging snow pits to study the layers and what causes them to occasionally release.
Shovels in hand I, along with my fellow students, was soon digging down to a depth of over 150cm. Probes revealed a huge temperature difference; from -11C at the surface to just above freezing at the base.
There’s been quite a few superlatives thrown at this early January cold spell, not least the recording of the coldest January night at Altnaharra in 15 years.
Snowfalls across the Highlands, Lake District and northern England have been notable in their longevity relative to recent years.
But the absence of any lying snow at 9am in this locality and fairly standard minima for January left me looking elsewhere for something notable.
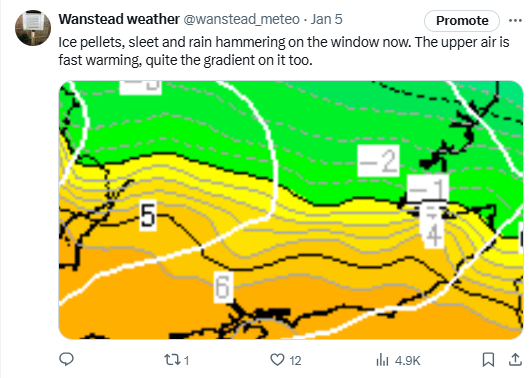
Airmass battlegrounds are a regular feature of UK winters though I can’t remember a time when this region has been right on the boundary.
The temperature on the 5th climbed from 3.2C at 0810 to 11.3C at 1050. Here it hovered until 0710 on the 6th before plunging to 3.2C again by 0910 – a period of just 2 hours.
There was some transient snowfall on the evening of the 4th but it lasted a matter of hours with the incoming warm air after midnight..
The coming winter is likely to be mild and wet overall thanks to a predominant south-westerly Atlantic regime.
While that may sound grim for any snow and cold lovers reading this I would suggest that the possibility of brief cold snaps this season are higher than they have been during the last few winters.
This year I have tried to improve my statistical method by adding warming on to previous years to, hopefully, give better results.
In terms of rainfall and mean temperature a total of eleven years were similar to this October and November, spanning 1826 to 2021.
The probabilities for the following DJF winter were thus.
Mean temperature
Probability
Rainfall
Probability
Very mild
46%
Wet
33%
Average to mild
33%
Average
37%
Below average
21%
Dry
30%
London winter forecast 2024/25
Looking deeper into the stats I had a look at the Oceanic Niño Index; no years were similar to this one though the index only goes as far back as 1950 – so no real help.
The prognosis for snow at this point seems bleak – though chances may be heightened should we experience a stratospheric sudden warming in December / January. Though, as seen in 1987 where a vortex ‘split’ was recorded, this would still not guarantee wintry weather.
Looking at the data month to month would suggest the best chance of a cold snap around December 22nd through Christmas before warming up in the New Year. Beyond that I would suggest that the chances of another cold snap in January are higher than they have been for the last few winters. February, however, looks very mild and possibly very wet.
It’s been an unusual autumn so far. A very notable lack of sun from the end of October into November was followed by an early cold snap before Storm Bert brought flooding chaos to parts of south Wales, the West Country and elsewhere.
Just before the beginning of every winter I have a crack at predicting what winter will be like; the results often being very mixed.
However, on looking at the stats so far there’s virtually no years that have been similar to this autumn; the one year being 1968.
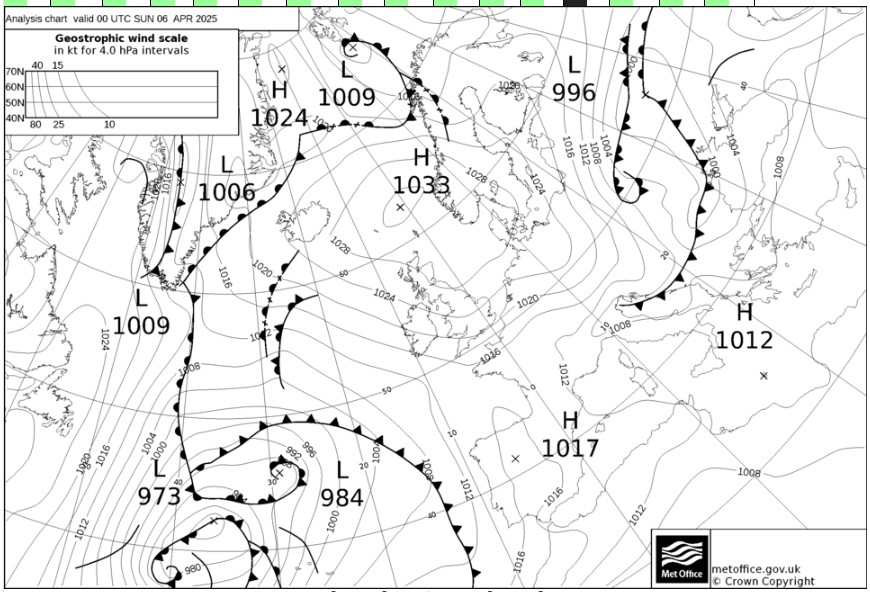
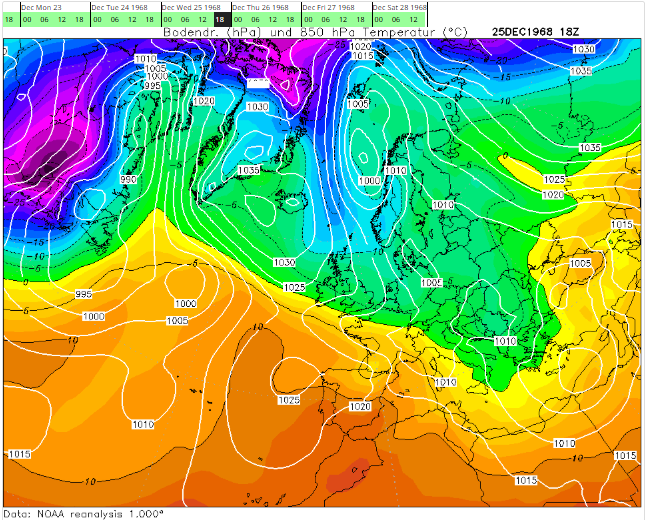
1968, looking back at reanalyis charts, swung from mild to cold with snow on Christmas Day. The Weather Outlook mentions the conditions on the 25th.
Though the odds are very long at this stage the 850mb chart for 1968 is not beyond the realms of possibilities given the recent synoptic patterns. And if not the 25th I would suggest that a cold snap between Christmas and New Year is a better chance than evens this year.
1968 was the year Bing Crosby sung an alternative intro to White Christmas while marooned in a sunny California.
The sun is shining, the grass is green; the orange and palm trees sway. There’s never been such a day in Beverly Hills, LA. But it’s December 24th , and I long to be up north!
Though we think of snow at Christmas in London it is very rare. And has often been rare been since Victorian times.
Since October 28th there has been just 1.7 hours of sunshine at Heathrow.
The 12-day spell up to and including November 8th is the dullest at the airport since at least 1960.
If you look further back at other London records, including Kew – a record that includes the years 1912-1940 – there is no other period with as few hours as this year.
A look at the synoptic situation since the end of October shows an anticyclone drifting around the near continent giving us mostly dry, dull and misty weather while also perpetuating the troughs and convergence zones that have brought catastrophic flooding over parts of Iberia and the Balearics.
Note that sunshine data at Kew was missing for the years 1941 and 1943 to 1946.
Today marks the 866th consecutive day that the rolling 365-day mean has been above 12C, a level that is nearly a degree above the average annual mean temperature for this region.
The next longest period, back to 1960, was 499 days starting on June 9th 2003.
The graph below shows that since around 2015 this 23,644 day period has been stuck in a high rut.
Looking at months on their own it has now been over 20 since this station recorded a month around a degree cooler than average.
The monthly mean temperature anomalies considering 1981-2010 averages.
This September is looking like it will be yet another milder than average month. If the mean for 2024 finishes above the level of 12C it will be the third 12C year in a row!
Prior to this an annual mean of 12C has been recorded on only 11 occasions since 1960: 1989, 1997, 1999, 2002, 2003, 2011, 2014, 2018, 2020, 2022, 2023 .
The period around the autumnal equinox appears to be getting wetter in this part of the UK.
Since 9am on Sunday 36mm has fallen at Wanstead, some 60% of the monthly total so far! Elsewhere, not too far away near Milton Keynes, Flitwick has recorded 124mm!
A look at the local stats shows that the week either side of September 22nd has been getting wetter since 2010.
A look at the rolling 10-year average since 1960 shows an increase since 2011.
This September has seen a lot of convective activity with three days of thunder, already more than the whole of meteorological summer.
The first storms arrived during the early hours of the 8th. Lots of thunder and lightning though only 7.1mm of rain. Further storms bubbled up at 1200 and 1720 with 9.8mm of rain.
Both the 11th and 12th have seen further thunderstorms develop with hail recorded though rain amounts were low; with 0.4mm and 0.6mm recorded respectively.


You must be logged in to post a comment.